
A new GA release for the Windows Cloudflare One Client is now available on the stable releases downloads page.
This release contains minor fixes and improvements.
The next stable release for Windows will introduce the new Cloudflare One Client UI, providing a cleaner and more intuitive design as well as easier access to common actions and information.
Changes and improvements
- Fixed an issue causing Windows client tunnel interface initialization failure which prevented clients from establishing a tunnel for connection.
- Consumer-only CLI commands are now clearly distinguished from Zero Trust commands.
- Added detailed QUIC connection metrics to diagnostic logs for better troubleshooting.
- Added monitoring for tunnel statistics collection timeouts.
- Switched tunnel congestion control algorithm for local proxy mode to Cubic for improved reliability across platforms.
- Fixed packet capture failing on tunnel interface when the tunnel interface is renamed by SCCM VPN boundary support.
- Fixed unnecessary registration deletion caused by RDP connections in multi-user mode.
- Fixed increased tunnel interface start-up time due to a race between duplicate address detection (DAD) and disabling NetBT.
- Fixed tunnel failing to connect when the system DNS search list contains unexpected characters.
- Empty MDM files are now rejected instead of being incorrectly accepted as a single MDM config.
- Fixed an issue in local proxy mode where the client could become unresponsive due to upstream connection timeouts.
- Fixed an issue where the emergency disconnect status of a prior organization persisted after a switch to a different organization.
- Fixed initiating managed network detections checks when no network is available, which caused device profile flapping.
- Fixed an issue where degraded Windows Management Instrumentation (WMI) state could put the client in a failed connection state loop during initialization.
Known issues
For Windows 11 24H2 users, Microsoft has confirmed a regression that may lead to performance issues like mouse lag, audio cracking, or other slowdowns. Cloudflare recommends users experiencing these issues upgrade to a minimum Windows 11 24H2 version KB5062553 or higher for resolution. This warning will be omitted from future release notes. This Windows update was released in July 2025.
Devices with KB5055523 installed may receive a warning about
Win32/ClickFix.ABAbeing present in the installer. To resolve this false positive, update Microsoft Security Intelligence to version 1.429.19.0 or later. This warning will be omitted from future release notes. This Microsoft Security Intelligence update was released in May 2025.DNS resolution may be broken when the following conditions are all true:
- The client is in Secure Web Gateway without DNS filtering (tunnel-only) mode.
- A custom DNS server address is configured on the primary network adapter.
- The custom DNS server address on the primary network adapter is changed while the client is connected.
To work around this issue, reconnect the client by selecting Disconnect and then Connect in the client user interface.
-
Cloudflare has officially launched a redesigned "Get Help" Support Portal to eliminate friction and get you to a resolution faster. Previously, navigating support meant clicking through multiple tiles, categorizing your own technical issues across 50+ conditional fields, and translating your problem into Cloudflare's internal taxonomy.
The new experience replaces that complexity with a personalized front door built around your specific account plan. Whether you are under a DDoS attack or have a simple billing question, the portal now presents a single, clean page that surfaces the direct paths available to you — such as "Ask AI", "Chat with a human", or "Community" — without the manual triage.
- One Page, Clear Choices: No more navigating a grid of overlapping categories. The portal now uses action cards tailored to your plan (Free, Pro, Business, or Enterprise), ensuring you only see the support channels you can actually use.
- A Radically Simpler Support Form: We've reduced the ticket submission process from four+ screens and 50+ fields to a single screen with five critical inputs. You describe the issue in your own words, and our backend handles the categorization.
- AI-Driven Triage: Using Cloudflare Workers AI ↗ and Vectorize ↗, the portal now automatically generates case subjects and predicts product categories.
Behind the scenes, we've moved the complexity from the user to our own developer stack. When you describe an issue, we use semantic embeddings to capture intent rather than just keywords.
By leveraging case-based reasoning, our system compares your request against millions of resolved cases to route your inquiry to the specialist best equipped to help. This ensures that while the front-end experience is simpler for you, the back-end routing is more accurate than ever.
To learn more, refer to the Support documentation or select Get Help directly in the Cloudflare Dashboard ↗.
This week's release introduces new detections for a critical Remote Code Execution (RCE) vulnerability in MCP Server (CVE-2026-23744), alongside targeted protection for an authentication bypass vulnerability in SolarWinds products (CVE-2025-40552). Additionally, this release includes a new generic detection rule designed to identify and block Cross-Site Scripting (XSS) injection attempts leveraging "OnEvent" handlers within HTTP cookies.
Key Findings
-
MCP Server (CVE-2026-23744): A vulnerability in the Model Context Protocol (MCP) server implementation where malformed input payloads can trigger a memory corruption state, allowing for arbitrary code execution.
-
SolarWinds (CVE-2025-40552): A critical flaw in the authentication module allows unauthenticated attackers to bypass security filters and gain unauthorized access to the management console due to improper identity token validation.
-
XSS OnEvents Cookies: This generic rule identifies malicious event handlers (such as onload or onerror) embedded within HTTP cookie values.
Impact
Successful exploitation of the MCP Server and SolarWinds vulnerabilities could allow unauthenticated attackers to execute arbitrary code or gain administrative control, leading to a full system takeover. Additionally, the new generic XSS detection prevents attackers from leveraging browser event handlers in cookies to hijack user sessions or execute malicious scripts.
Ruleset Rule ID Legacy Rule ID Description Previous Action New Action Comments Cloudflare Managed Ruleset N/A Log Disabled Generic Rules - Command Execution - 5 - Body This is a new detection. Cloudflare Managed Ruleset N/A Log Disabled Generic Rules - Command Execution - 5 - Header This is a new detection. Cloudflare Managed Ruleset N/A Log Block Generic Rules - Command Execution - 5 - URI This is a new detection. Cloudflare Managed Ruleset N/A Log Block MCP Server - Remote Code Execution - CVE:CVE-2026-23744 This is a new detection. Cloudflare Managed Ruleset N/A Log Block XSS - OnEvents - Cookies This is a new detection. Cloudflare Managed Ruleset N/A Log Disabled SQLi - Evasion - Body This is a new detection. Cloudflare Managed Ruleset N/A Log Disabled SQLi - Evasion - Headers This is a new detection. Cloudflare Managed Ruleset N/A Log Disabled SQLi - Evasion - URI This is a new detection. Cloudflare Managed Ruleset N/A Log Disabled SQLi - LIKE 3 - Body This is a new detection. Cloudflare Managed Ruleset N/A Log Disabled SQLi - LIKE 3 - URI This is a new detection. Cloudflare Managed Ruleset N/A Log Disabled SQLi - UNION - 2 - Body This is a new detection. Cloudflare Managed Ruleset N/A Log Disabled SQLi - UNION - 2 - URI This is a new detection. Cloudflare Managed Ruleset N/A Log Block SolarWinds - Auth Bypass - CVE:CVE-2025-40552 This is a new detection. -
Announcement Date Release Date Release Behavior Legacy Rule ID Rule ID Description Comments 2026-04-07 2026-04-13 Log N/A Cisco Secure FMC - RCE via upgradeReadinessCall - CVE:CVE-2026-20079 This is a new detection. 2026-04-07 2026-04-13 Log N/A FortiClient EMS - Pre-Auth SQL Injection - CVE:CVE-2026-21643 This is a new detection. 2026-04-07 2026-04-13 Log N/A Mesop - Remote Code Execution - Base64 Payload - CVE:CVE-2026-33057 This is a new detection. 2026-04-07 2026-04-13 Log N/A React Server - DOS - CVE:CVE-2026-23864 - 1 - Beta This rule has been merged into the original rule "React Server - DOS - CVE:CVE-2026-23864 - 1" (ID:
Cloudflare Email Security now supports DANE (DNS-based Authentication of Named Entities) for MX deployments. This enhancement strengthens email transport security by enabling DNSSEC-backed certificate verification for our regional MX records.
- Regional MX hostnames now publish DANE TLSA records backed by DNSSEC, enabling DANE-capable SMTP senders to cryptographically validate certificate identities before establishing TLS connections—moving beyond opportunistic encryption to verified encrypted delivery.
- DANE support is automatically available for all customers using regional MX deployments. No additional configuration is required; DANE-capable mail infrastructure will automatically validate MX certificates using the published records.
This applies to all Email Security packages:
- Advantage
- Enterprise
- Enterprise + PhishGuard
We're announcing the public beta of Organizations for enterprise customers, a new top-level Cloudflare container that lets Cloudflare customers manage multiple accounts, members, analytics, and shared policies from one centralized location.
What's New
Organizations [BETA]: Organizations are a new top-level container for centrally managing multiple accounts. Each Organization supports up to 500 accounts and 500 zones, giving larger teams a single place to administer resources at scale.
Self-serve onboarding: Enterprise customers can create an Organization in the dashboard and assign accounts where they are already Super Administrators.
Centralized Account Management: At launch, every Organization member has the Organization Super Admin role. Organization Super Admins can invite other users and manage any child account under the Organization implicitly. Shared policies: Share WAF or Gateway policies across multiple accounts within your Organization to simplify centralized policy management. Implicit access: Members of an Organization automatically receive Super Administrator permissions across child accounts, removing the need for explicit membership on each account. Additional Org-level roles will be available over the course of the year.
Unified analytics: View, filter, and download aggregate HTTP analytics across all Organization child accounts from a single dashboard for centralized visibility into traffic patterns and security events.
Terraform provider support: Manage Organizations with infrastructure as code from day one. Provision organizations, assign accounts, and configure settings programmatically with the Cloudflare Terraform provider ↗.
Shared policies: Share WAF or Gateway policies across multiple accounts within your Organization to simplify centralized policy management.
For more info:
Cloudflare has added a new field to the Gateway DNS Logpush dataset:
- ResponseTimeMs: Total response time of the DNS request in milliseconds.
For the complete field definitions, refer to Gateway DNS dataset.
We are partnering with Google to bring
@cf/google/gemma-4-26b-a4b-itto Workers AI. Gemma 4 26B A4B is a Mixture-of-Experts (MoE) model built from Gemini 3 research, with 26B total parameters and only 4B active per forward pass. By activating a small subset of parameters during inference, the model runs almost as fast as a 4B-parameter model while delivering the quality of a much larger one.Gemma 4 is Google's most capable family of open models, designed to maximize intelligence-per-parameter.
- Mixture-of-Experts architecture with 8 active experts out of 128 total (plus 1 shared expert), delivering frontier-level performance at a fraction of the compute cost of dense models
- 256,000 token context window for retaining full conversation history, tool definitions, and long documents across extended sessions
- Built-in thinking mode that lets the model reason step-by-step before answering, improving accuracy on complex tasks
- Vision understanding for object detection, document and PDF parsing, screen and UI understanding, chart comprehension, OCR (including multilingual), and handwriting recognition, with support for variable aspect ratios and resolutions
- Function calling with native support for structured tool use, enabling agentic workflows and multi-step planning
- Multilingual with out-of-the-box support for 35+ languages, pre-trained on 140+ languages
- Coding for code generation, completion, and correction
Use Gemma 4 26B A4B through the Workers AI binding (
env.AI.run()), the REST API at/runor/v1/chat/completions, or the OpenAI-compatible endpoint.For more information, refer to the Gemma 4 26B A4B model page.
A new GA release for the macOS Cloudflare One Client is now available on the stable releases downloads page.
This release contains minor fixes and improvements.
The next stable release for macOS will introduce the new Cloudflare One Client UI, providing a cleaner and more intuitive design as well as easier access to common actions and information.
Changes and improvements
- Empty MDM files are now rejected instead of being incorrectly accepted as a single MDM config.
- Fixed an issue in local proxy mode where the client could become unresponsive due to upstream connection timeouts.
- Fixed an issue where the emergency disconnect status of a prior organization persisted after a switch to a different organization.
- Consumer-only CLI commands are now clearly distinguished from Zero Trust commands.
- Added detailed QUIC connection metrics to diagnostic logs for better troubleshooting.
- Added monitoring for tunnel statistics collection timeouts.
- Switched tunnel congestion control algorithm for local proxy mode to Cubic for improved reliability across platforms.
- Fixed initiating managed network detections checks when no network is available, which caused device profile flapping.
A new GA release for the Linux Cloudflare One Client is now available on the stable releases downloads page.
This release contains minor fixes and improvements.
The next stable release for Linux will introduce the new Cloudflare One Client UI, providing a cleaner and more intuitive design as well as easier access to common actions and information.
Changes and improvements
- Empty MDM files are now rejected instead of being incorrectly accepted as a single MDM config.
- Fixed an issue in local proxy mode where the client could become unresponsive due to upstream connection timeouts.
- Fixed an issue where the emergency disconnect status of a prior organization persisted after a switch to a different organization.
- Consumer-only CLI commands are now clearly distinguished from Zero Trust commands.
- Added detailed QUIC connection metrics to diagnostic logs for better troubleshooting.
- Added monitoring for tunnel statistics collection timeouts.
- Switched tunnel congestion control algorithm for local proxy mode to Cubic for improved reliability across platforms.
- Fixed initiating managed network detections checks when no network is available, which caused device profile flapping.
AI Gateway now supports automatic retries at the gateway level. When an upstream provider returns an error, your gateway retries the request based on the retry policy you configure, without requiring any client-side changes.
You can configure the retry count (up to 5 attempts), the delay between retries (from 100ms to 5 seconds), and the backoff strategy (Constant, Linear, or Exponential). These defaults apply to all requests through the gateway, and per-request headers can override them.
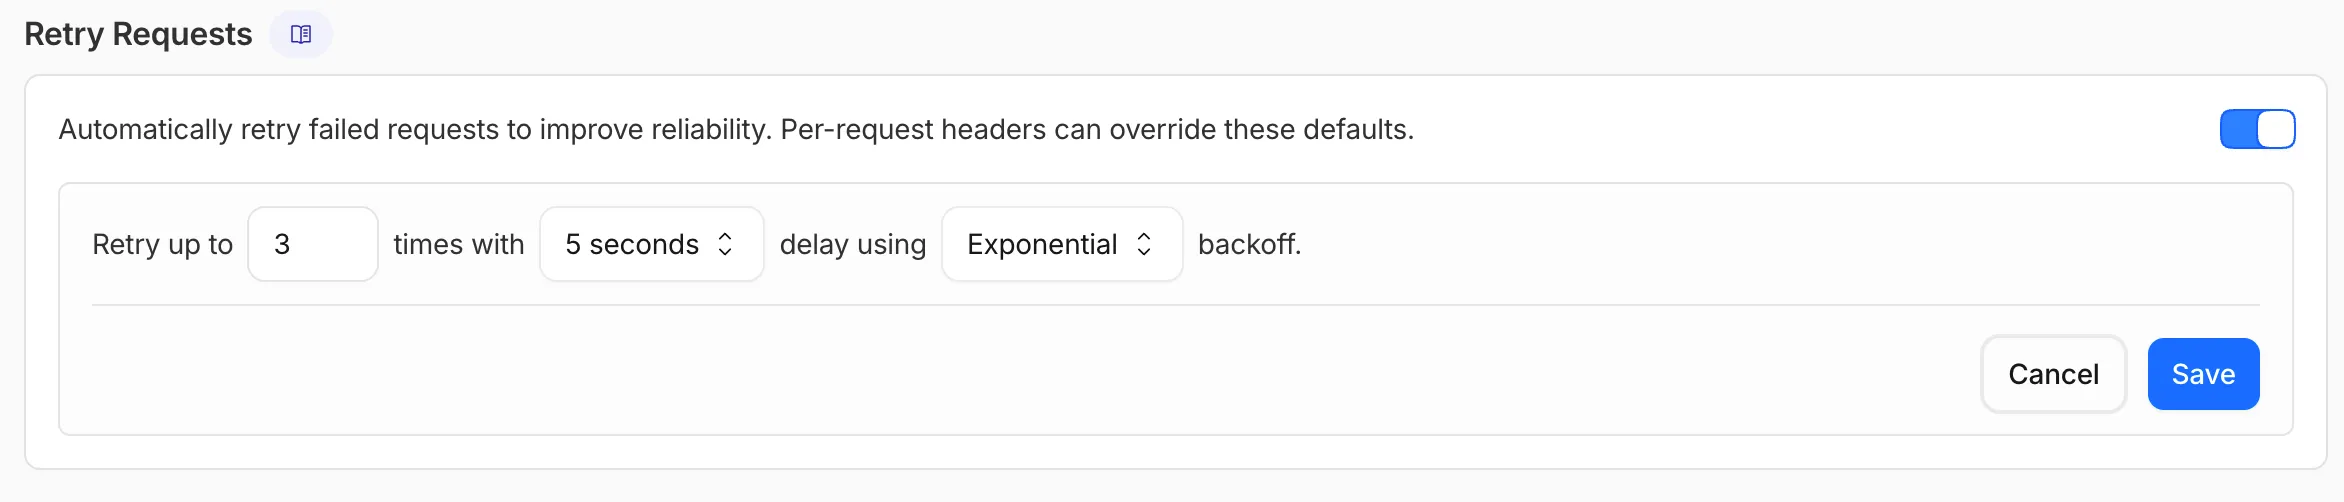
This is particularly useful when you do not control the client making the request and cannot implement retry logic on the caller side. For more complex failover scenarios — such as failing across different providers — use Dynamic Routing.
For more information, refer to Manage gateways.
Cloudflare Logpush now supports BigQuery as a native destination.
Logs from Cloudflare can be sent to Google Cloud BigQuery ↗ via Logpush. The destination can be configured through the Logpush UI in the Cloudflare dashboard or by using the Logpush API.
For more information, refer to the Destination Configuration documentation.
All
wrangler workflowscommands now accept a--localflag to target a Workflow running in a localwrangler devsession instead of the production API.You can now manage the full Workflow lifecycle locally, including triggering Workflows, listing instances, pausing, resuming, restarting, terminating, and sending events:
Terminal window npx wrangler workflows list --localnpx wrangler workflows trigger my-workflow --localnpx wrangler workflows instances list my-workflow --localnpx wrangler workflows instances pause my-workflow <INSTANCE_ID> --localnpx wrangler workflows instances send-event my-workflow <INSTANCE_ID> --type my-event --localAll commands also accept
--portto target a specificwrangler devsession (defaults to8787).For more information, refer to Workflows local development.
AI Search supports a
wrangler ai-searchcommand namespace. Use it to manage instances from the command line.The following commands are available:
Command Description wrangler ai-search createCreate a new instance with an interactive wizard wrangler ai-search listList all instances in your account wrangler ai-search getGet details of a specific instance wrangler ai-search updateUpdate the configuration of an instance wrangler ai-search deleteDelete an instance wrangler ai-search searchRun a search query against an instance wrangler ai-search statsGet usage statistics for an instance The
createcommand guides you through setup, choosing a name, source type (r2orweb), and data source. You can also pass all options as flags for non-interactive use:Terminal window wrangler ai-search create my-instance --type r2 --source my-bucketUse
wrangler ai-search searchto query an instance directly from the CLI:Terminal window wrangler ai-search search my-instance --query "how do I configure caching?"All commands support
--jsonfor structured output that scripts and AI agents can parse directly.For full usage details, refer to the Wrangler commands documentation.
Access authentication logs and Gateway activity logs (DNS, Network, and HTTP) now feature a refreshed user interface that gives you more flexibility when viewing and analyzing your logs.
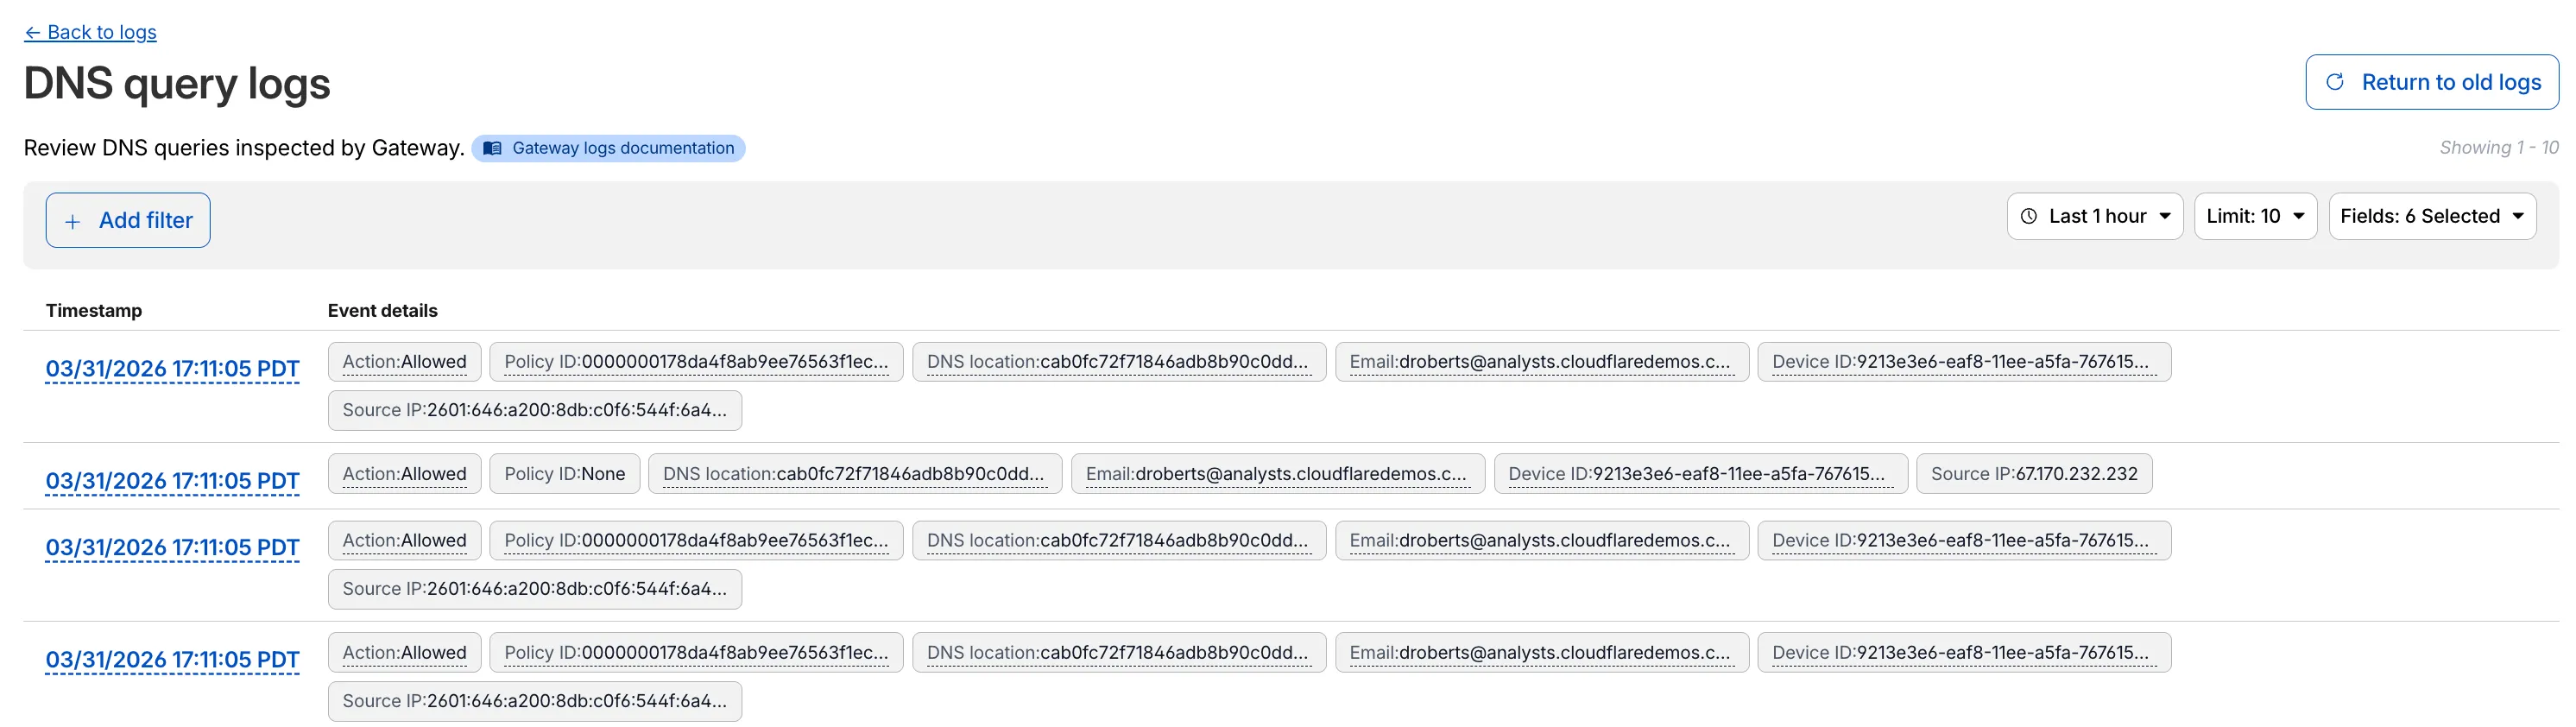
The updated UI includes:
- Filter by field - Select any field value to add it as a filter and narrow down your results.
- Customizable fields - Choose which fields to display in the log table. Querying for fewer fields improves log loading performance.
- View details - Select a timestamp to view the full details of a log entry.
- Switch to classic view - Return to the previous log viewer interface if needed.
For more information, refer to Access authentication logs and Gateway activity logs.
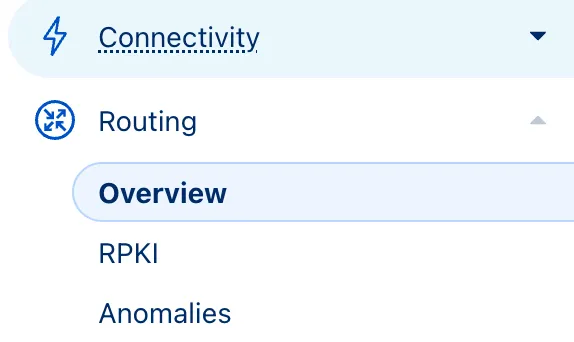
Radar now features an expanded Routing section ↗ with dedicated sub-pages, providing a more organized and in-depth view of the global routing ecosystem. This restructuring lays the groundwork for additional routing features and widgets coming in the near future.
The single Routing page has been split into three focused sub-pages:
- Overview ↗ — Routing statistics, IP address space trends, BGP announcements, and the new Top 100 ASes ranking.
- RPKI ↗ — RPKI validation status, ASPA deployment trends, and per-ASN ASPA provider details.
- Anomalies ↗ — BGP route leaks, origin hijacks, and Multi-Origin AS (MOAS) conflicts.
The routing overview now includes a Top 100 ASes table ranking autonomous systems by customer cone size, IPv4 address space, or IPv6 address space. Users can switch between rankings using a segmented control.
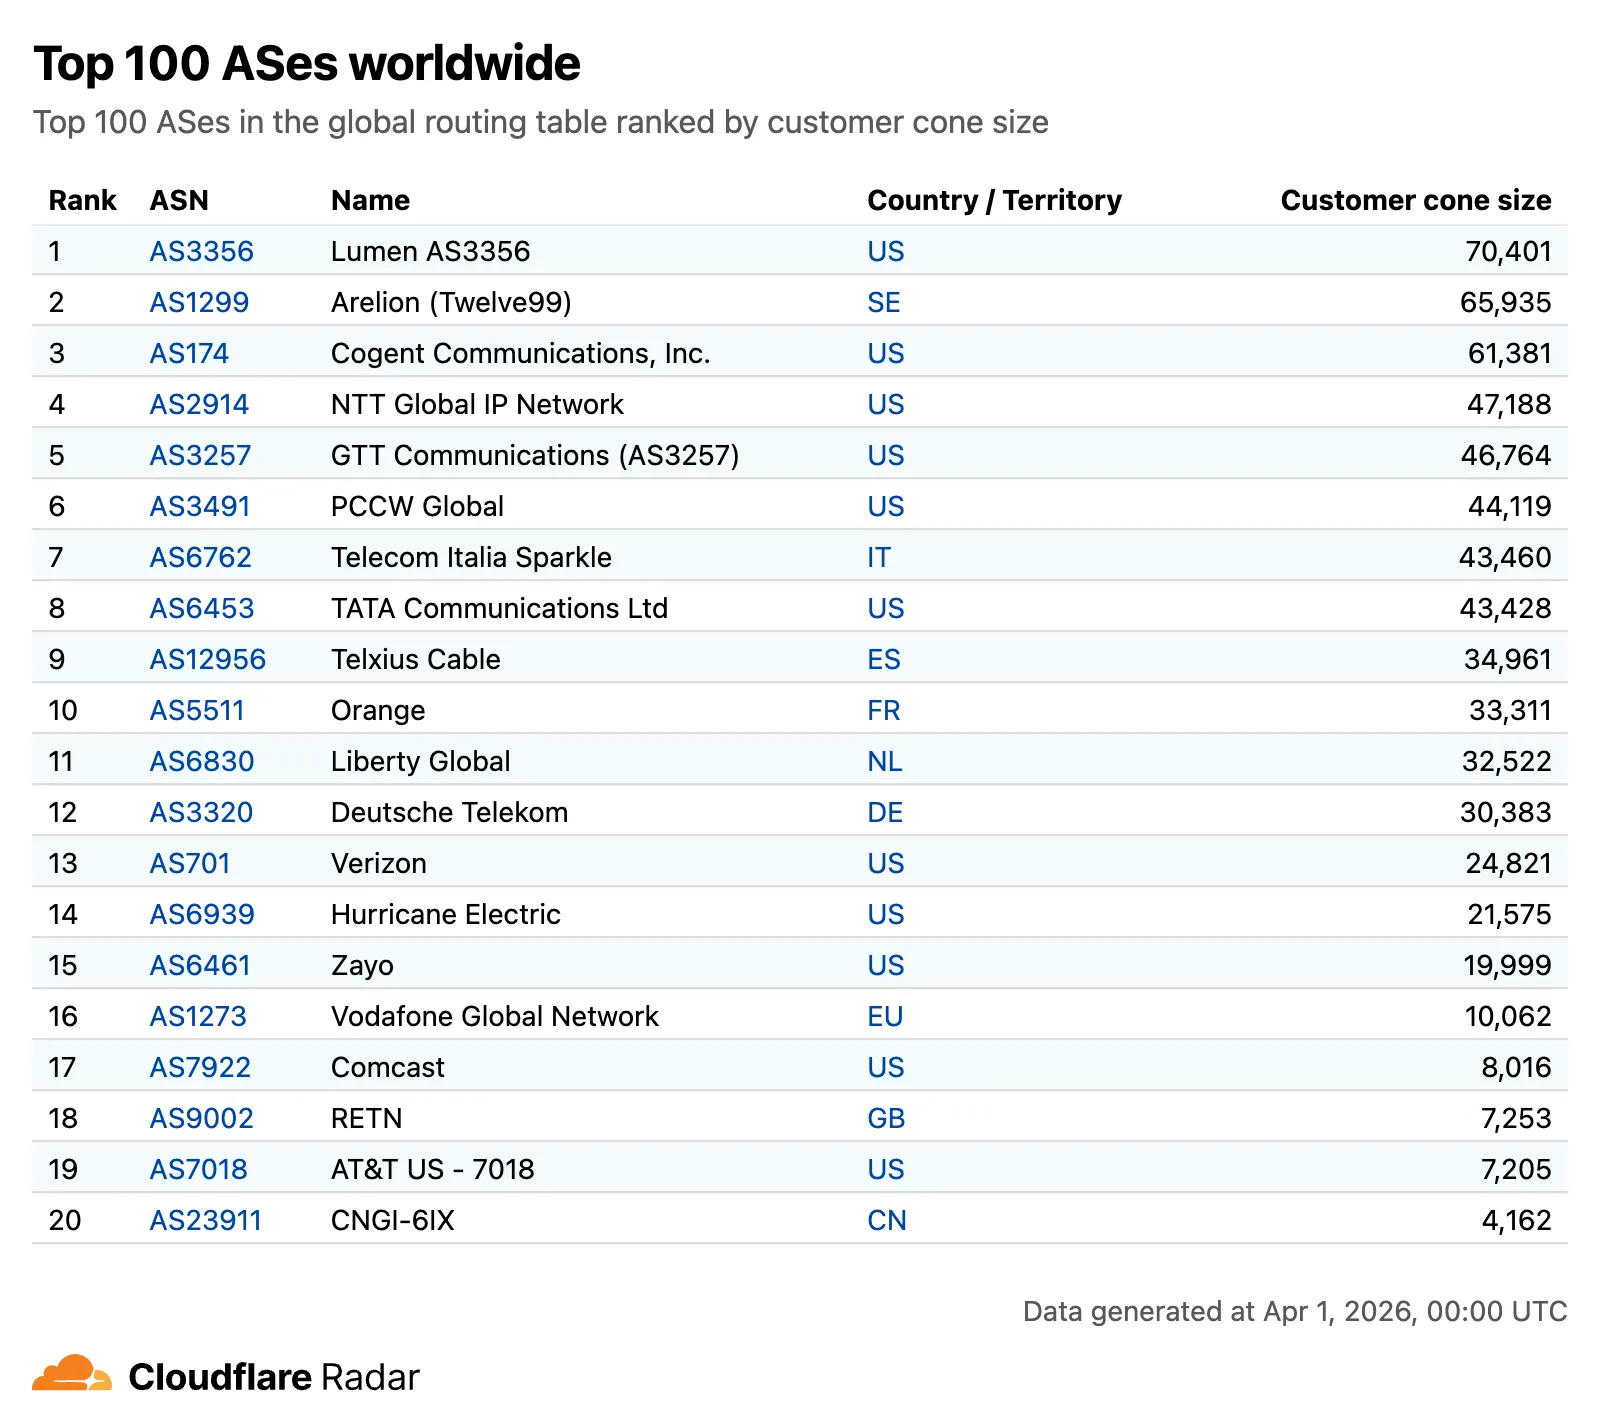
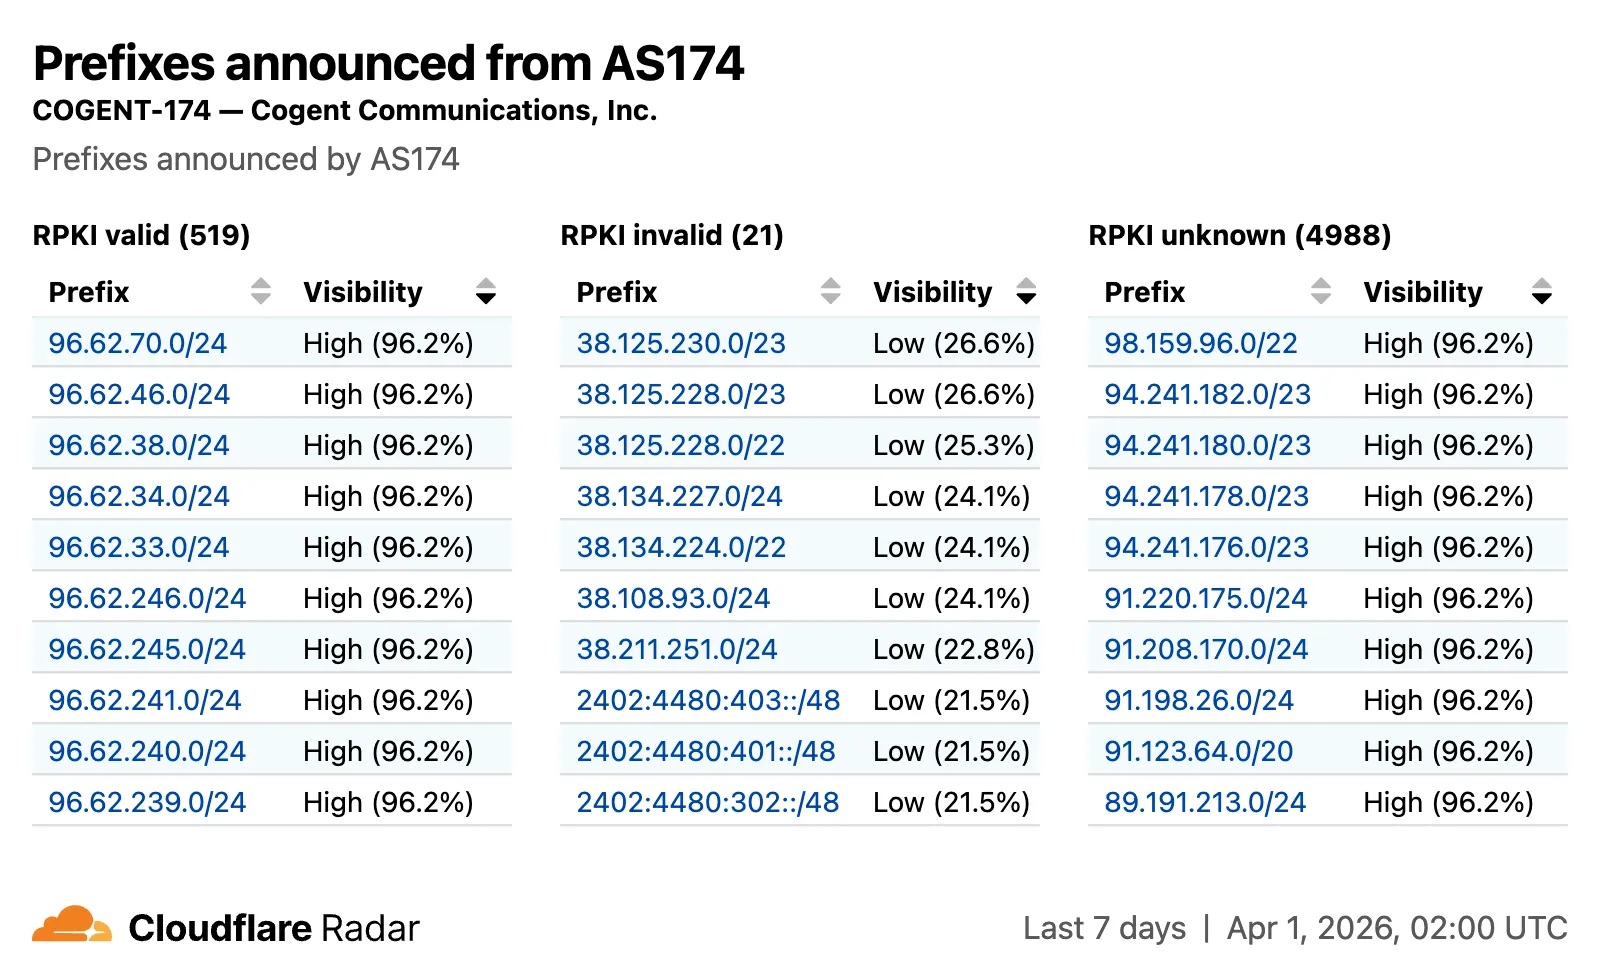
The RPKI sub-page introduces a RPKI validation view for per-ASN pages, showing prefixes grouped by RPKI validation status (Valid, Invalid, Unknown) with visibility scores.
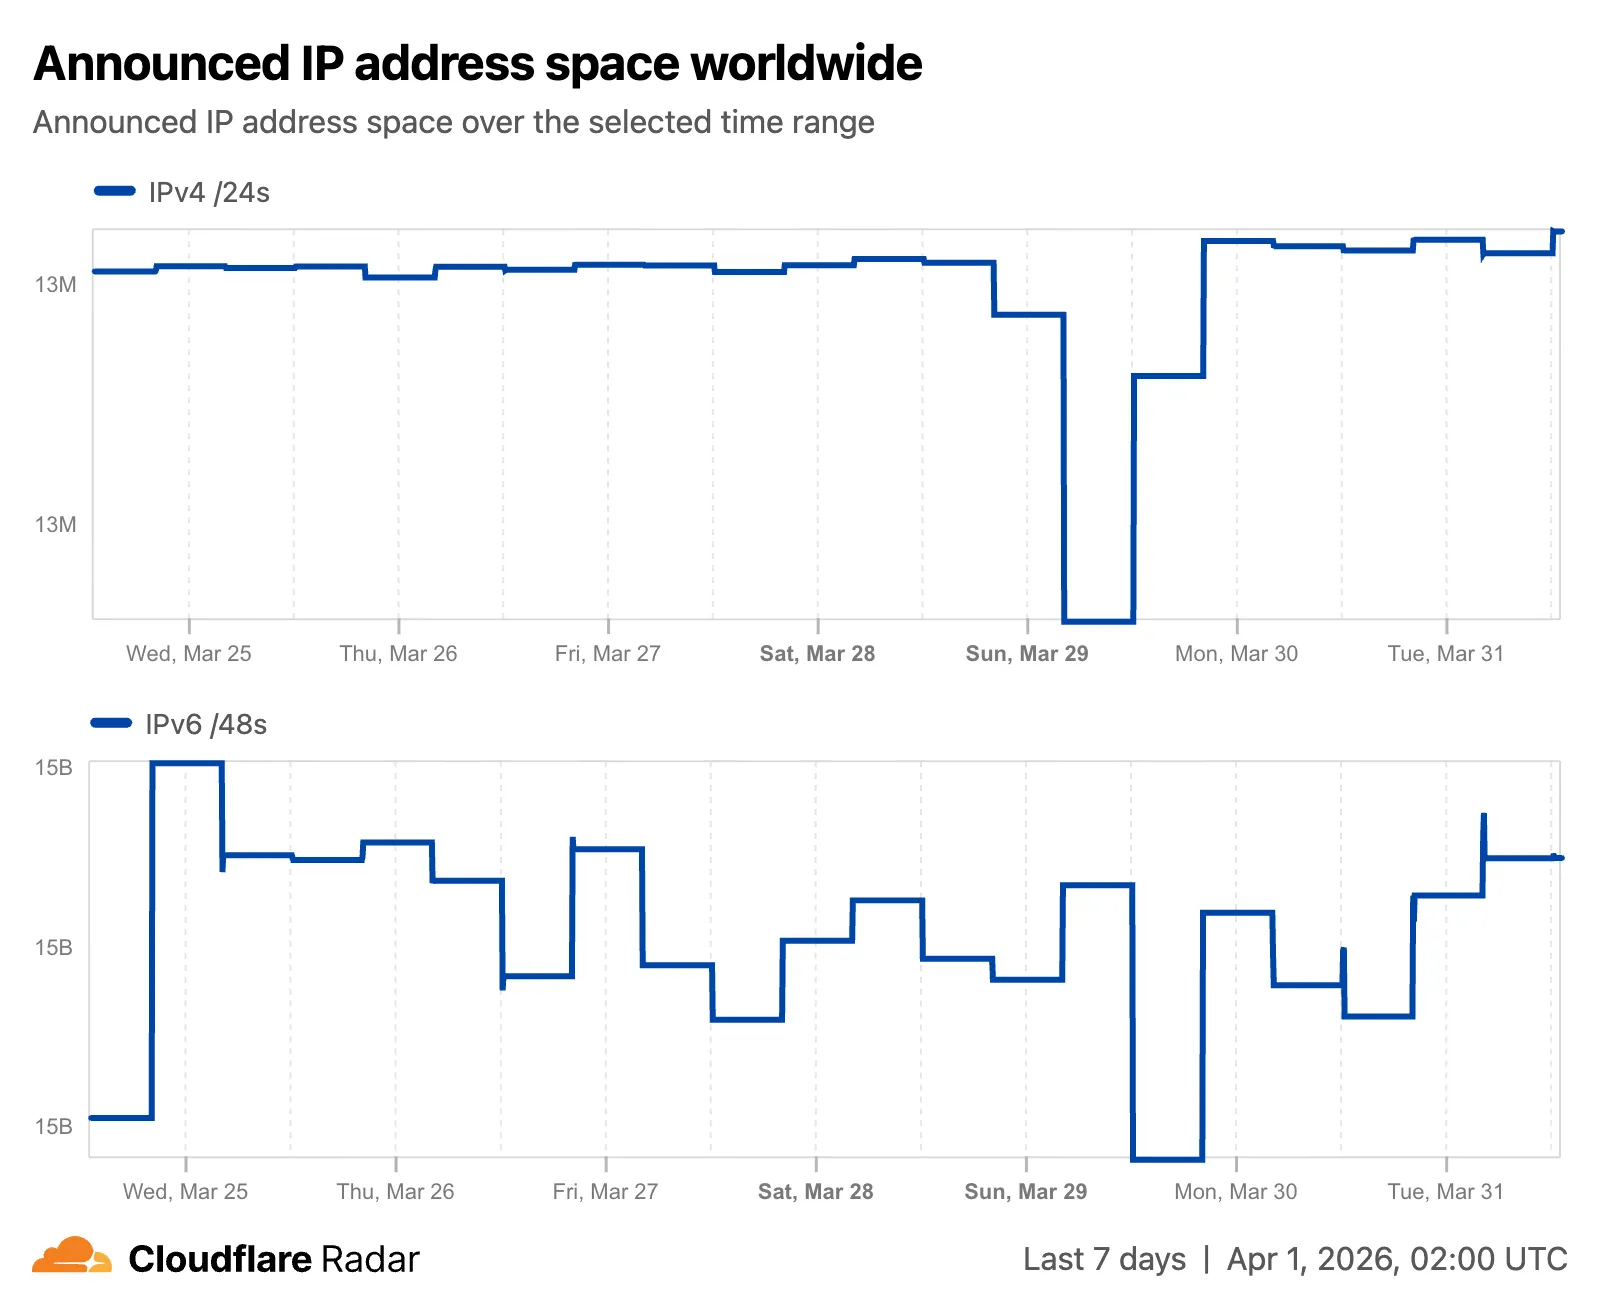
The IP address space ↗ chart now displays both IPv4 and IPv6 trends stacked vertically and is available on global, country, and AS views.
Check out the Radar routing section ↗ to explore the data, and stay tuned for more routing insights coming soon.
Two new fields are now available in rule expressions that surface Layer 4 transport telemetry from the client connection. Together with the existing
cf.timings.client_tcp_rtt_msecfield, these fields give you a complete picture of connection quality for both TCP and QUIC traffic — enabling transport-aware rules without requiring any client-side changes.Previously, QUIC RTT and delivery rate data was only available via the
Server-Timing: cfL4response header. These new fields make the same data available directly in rule expressions, so you can use them in Transform Rules, WAF Custom Rules, and other phases that support dynamic fields.Field Type Description cf.timings.client_quic_rtt_msecInteger The smoothed QUIC round-trip time (RTT) between Cloudflare and the client in milliseconds. Only populated for QUIC (HTTP/3) connections. Returns 0for TCP connections.cf.edge.l4.delivery_rateInteger The most recent data delivery rate estimate for the client connection, in bytes per second. Returns 0when L4 statistics are not available for the request.Use a request header transform rule to tag requests from high-latency connections, so your origin can serve a lighter page variant:
Rule expression:
cf.timings.client_tcp_rtt_msec > 200 or cf.timings.client_quic_rtt_msec > 200Header modifications:
Operation Header name Value Set X-High-Latencytruecf.edge.l4.delivery_rate > 0 and cf.edge.l4.delivery_rate < 100000For more information, refer to Request Header Transform Rules and the fields reference.
Workers Builds now supports Deploy Hooks — trigger builds from your headless CMS, a Cron Trigger, a Slack bot, or any system that can send an HTTP request.
Each Deploy Hook is a unique URL tied to a specific branch. Send it a
POSTand your Worker builds and deploys.Terminal window curl -X POST "https://api.cloudflare.com/client/v4/workers/builds/deploy_hooks/<DEPLOY_HOOK_ID>"To create one, go to Workers & Pages > your Worker > Settings > Builds > Deploy Hooks.
Since a Deploy Hook is a URL, you can also call it from another Worker. For example, a Worker with a Cron Trigger can rebuild your project on a schedule:
JavaScript export default {async scheduled(event, env, ctx) {ctx.waitUntil(fetch(env.DEPLOY_HOOK_URL, { method: "POST" }));},};TypeScript export default {async scheduled(event: ScheduledEvent, env: Env, ctx: ExecutionContext): Promise<void> {ctx.waitUntil(fetch(env.DEPLOY_HOOK_URL, { method: "POST" }));},} satisfies ExportedHandler<Env>;You can also use Deploy Hooks to rebuild when your CMS publishes new content or deploy from a Slack slash command.
- Automatic deduplication: If a Deploy Hook fires multiple times before the first build starts running, redundant builds are automatically skipped. This keeps your build queue clean when webhooks retry or CMS events arrive in bursts.
- Last triggered: The dashboard shows when each hook was last triggered.
- Build source: Your Worker's build history shows which Deploy Hook started each build by name.
Deploy Hooks are rate limited to 10 builds per minute per Worker and 100 builds per minute per account. For all limits, see Limits & pricing.
To get started, read the Deploy Hooks documentation.
Three new properties are now available on
request.cfin Workers that expose Layer 4 transport telemetry from the client connection. These properties let your Worker make decisions based on real-time connection quality signals — such as round-trip time and data delivery rate — without requiring any client-side changes.Previously, this telemetry was only available via the
Server-Timing: cfL4response header. These new properties surface the same data directly in the Workers runtime, so you can use it for routing, logging, or response customization.Property Type Description clientTcpRttnumber | undefined The smoothed TCP round-trip time (RTT) between Cloudflare and the client in milliseconds. Only present for TCP connections (HTTP/1, HTTP/2). For example, 22.clientQuicRttnumber | undefined The smoothed QUIC round-trip time (RTT) between Cloudflare and the client in milliseconds. Only present for QUIC connections (HTTP/3). For example, 42.edgeL4Object | undefined Layer 4 transport statistics. Contains deliveryRate(number) — the most recent data delivery rate estimate for the connection, in bytes per second. For example,123456.JavaScript export default {async fetch(request) {const cf = request.cf;const rtt = cf.clientTcpRtt ?? cf.clientQuicRtt ?? 0;const deliveryRate = cf.edgeL4?.deliveryRate ?? 0;const transport = cf.clientTcpRtt ? "TCP" : "QUIC";console.log(`Transport: ${transport}, RTT: ${rtt}ms, Delivery rate: ${deliveryRate} B/s`);const headers = new Headers(request.headers);headers.set("X-Client-RTT", String(rtt));headers.set("X-Delivery-Rate", String(deliveryRate));return fetch(new Request(request, { headers }));},};For more information, refer to Workers Runtime APIs: Request.
Internal DNS is now in open beta.
Internal DNS is bundled as a part of Cloudflare Gateway and is now available to every Enterprise customer with one of the following subscriptions:
- Cloudflare Zero Trust Enterprise
- Cloudflare Gateway Enterprise
To learn more and get started, refer to the Internal DNS documentation.
This week's release introduces new detections for a critical authentication bypass vulnerability in Fortinet products (CVE-2025-59718), alongside three new generic detection rules designed to identify and block HTTP Parameter Pollution attempts. Additionally, this release includes targeted protection for a high-impact unrestricted file upload vulnerability in Magento and Adobe Commerce.
Key Findings
-
CVE-2025-59718: An improper cryptographic signature verification vulnerability in Fortinet FortiOS, FortiProxy, and FortiSwitchManager. This may allow an unauthenticated attacker to bypass the FortiCloud SSO login authentication using a maliciously crafted SAML message, if that feature is enabled on the device.
-
Magento 2 - Unrestricted File Upload: A critical flaw in Magento and Adobe Commerce allows unauthenticated attackers to bypass security checks and upload malicious files to the server, potentially leading to Remote Code Execution (RCE).
Impact
Successful exploitation of the Fortinet and Magento vulnerabilities could allow unauthenticated attackers to gain administrative control or deploy webshells, leading to complete server compromise and data theft.
Ruleset Rule ID Legacy Rule ID Description Previous Action New Action Comments Cloudflare Managed Ruleset N/A Generic Rules - Parameter Pollution - Body Log Disabled This is a new detection. Cloudflare Managed Ruleset N/A Generic Rules - Parameter Pollution - Header - Form Log Disabled This is a new detection. Cloudflare Managed Ruleset N/A Generic Rules - Parameter Pollution - URI Log Disabled This is a new detection. Cloudflare Managed Ruleset N/A Magento 2 - Unrestricted file upload Log Block This is a new detection. Cloudflare Managed Ruleset N/A Fortinet FortiCloud SSO - Authentication Bypass - CVE:CVE-2025-59718 Log Block This is a new detection. -
Four new fields are now available on
request.cf.tlsClientAuthin Workers for requests that include a mutual TLS (mTLS) client certificate. These fields encode the client certificate and its intermediate chain in RFC 9440 ↗ format — the same standard format used by theClient-CertandClient-Cert-ChainHTTP headers — so your Worker can forward them directly to your origin without any custom parsing or encoding logic.Field Type Description certRFC9440String The client leaf certificate in RFC 9440 format ( :base64-DER:). Empty if no client certificate was presented.certRFC9440TooLargeBoolean trueif the leaf certificate exceeded 10 KB and was omitted fromcertRFC9440.certChainRFC9440String The intermediate certificate chain in RFC 9440 format as a comma-separated list. Empty if no intermediates were sent or if the chain exceeded 16 KB. certChainRFC9440TooLargeBoolean trueif the intermediate chain exceeded 16 KB and was omitted fromcertChainRFC9440.JavaScript export default {async fetch(request) {const tls = request.cf.tlsClientAuth;// Only forward if cert was verified and chain is completeif (!tls || !tls.certVerified || tls.certRevoked || tls.certChainRFC9440TooLarge) {return new Response("Unauthorized", { status: 401 });}const headers = new Headers(request.headers);headers.set("Client-Cert", tls.certRFC9440);headers.set("Client-Cert-Chain", tls.certChainRFC9440);return fetch(new Request(request, { headers }));},};For more information, refer to Client certificate variables and Mutual TLS authentication.
Containers and Sandboxes now support connecting directly to Workers over HTTP. This allows you to call Workers functions and bindings, like KV or R2, from within the container at specific hostnames.
Define an
outboundhandler to capture any HTTP request or useoutboundByHostto capture requests to individual hostnames and IPs.JavaScript export class MyApp extends Sandbox {}MyApp.outbound = async (request, env, ctx) => {// you can run arbitrary functions defined in your Worker on any HTTP requestreturn await someWorkersFunction(request.body);};MyApp.outboundByHost = {"my.worker": async (request, env, ctx) => {return await anotherFunction(request.body);},};In this example, requests from the container to
http://my.workerwill run the function defined withinoutboundByHost, and any other HTTP requests will run theoutboundhandler. These handlers run entirely inside the Workers runtime, outside of the container sandbox.Each handler has access to
env, so it can call any binding set in Wrangler config. Code inside the container makes a standard HTTP request to that hostname and the outbound Worker translates it into a binding call.JavaScript export class MyApp extends Sandbox {}MyApp.outboundByHost = {"my.kv": async (request, env, ctx) => {const key = new URL(request.url).pathname.slice(1);const value = await env.KV.get(key);return new Response(value ?? "", { status: value ? 200 : 404 });},"my.r2": async (request, env, ctx) => {const key = new URL(request.url).pathname.slice(1);const object = await env.BUCKET.get(key);return new Response(object?.body ?? "", { status: object ? 200 : 404 });},};Now, from inside the container sandbox,
curl http://my.kv/some-keywill access Workers KV andcurl http://my.r2/some-objectwill access R2.Use
ctx.containerIdto reference the container's automatically provisioned Durable Object.JavaScript export class MyContainer extends Container {}MyContainer.outboundByHost = {"get-state.do": async (request, env, ctx) => {const id = env.MY_CONTAINER.idFromString(ctx.containerId);const stub = env.MY_CONTAINER.get(id);return stub.getStateForKey(request.body);},};This provides an easy way to associate state with any container instance, and includes a built-in SQLite database.
Upgrade to
@cloudflare/containersversion 0.2.0 or later, or@cloudflare/sandboxversion 0.8.0 or later to use outbound Workers.Refer to Containers outbound traffic and Sandboxes outbound traffic for more details and examples.
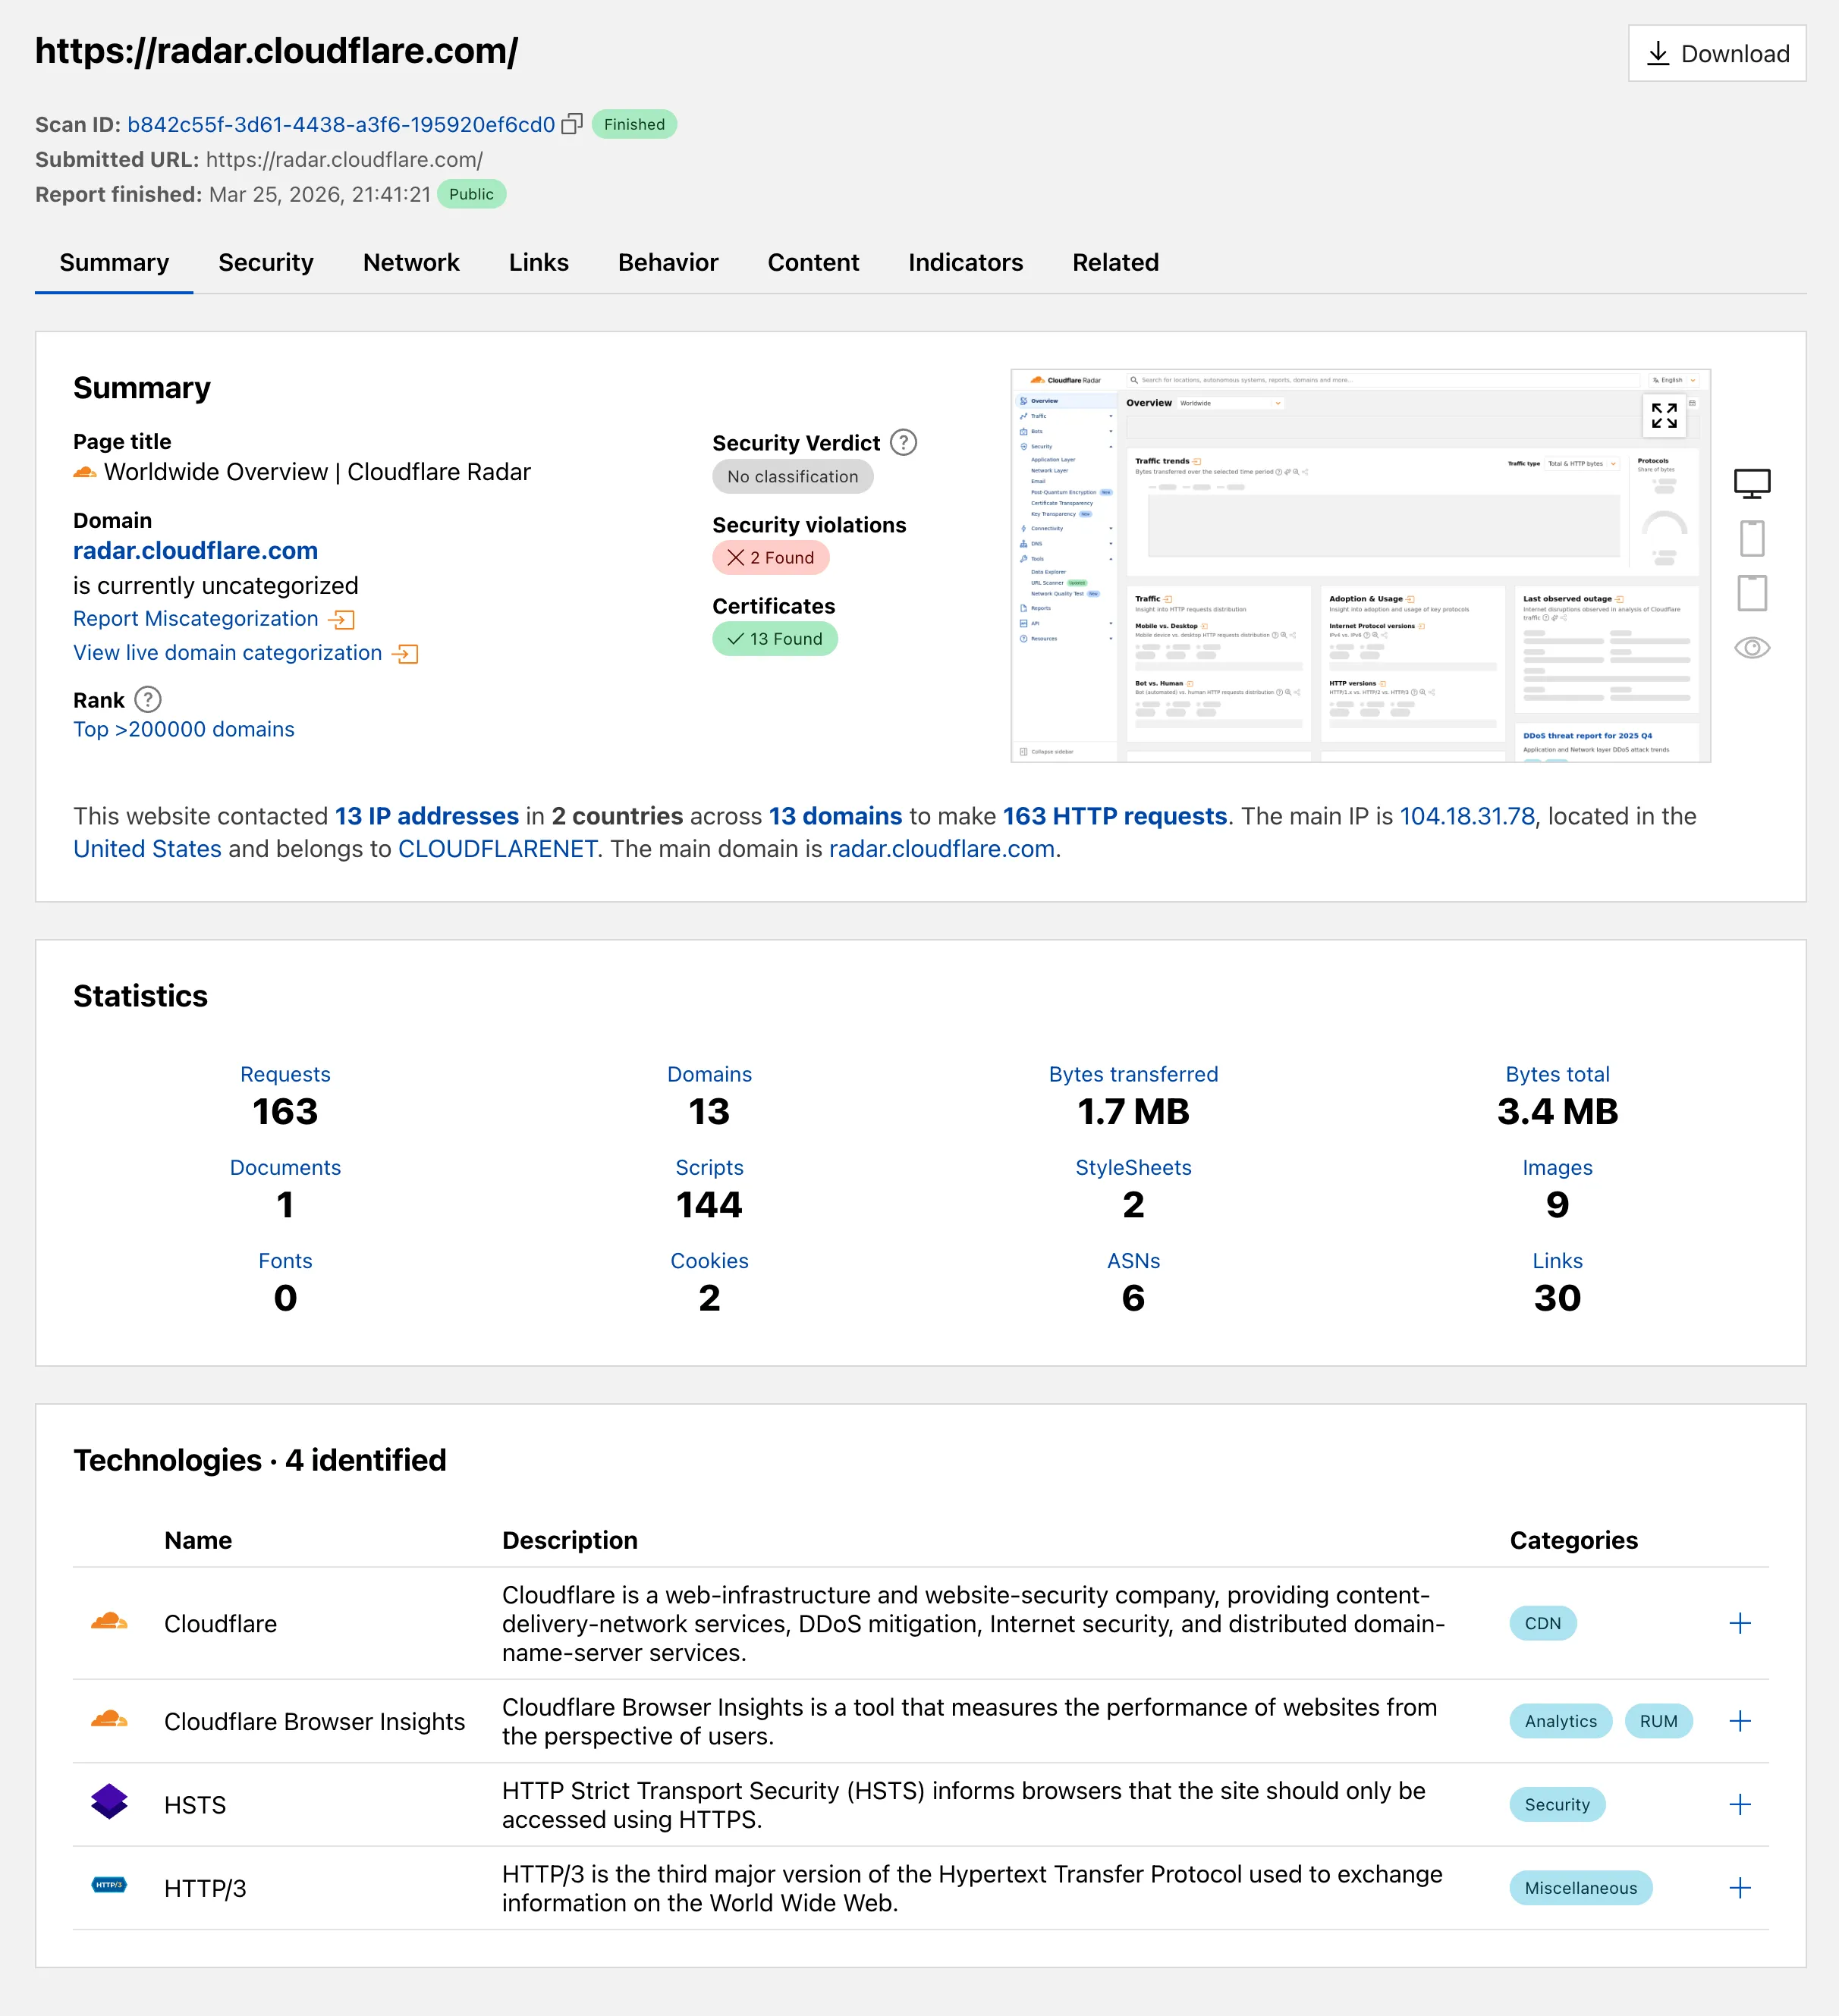
Radar ships several improvements to the URL Scanner ↗ that make scan reports more informative and easier to share:
- Live screenshots — the summary card now includes an option to capture a live screenshot of the scanned URL on demand using the Browser Rendering API.
- Save as PDF — a new button generates a print-optimized document aggregating all tab contents (Summary, Security, Network, Behavior, and Indicators) into a single file.
- Download as JSON — raw scan data is available as a JSON download for programmatic use.
- Redesigned summary layout — page information and security details are now displayed side by side with the screenshot, with a layout that adapts to narrower viewports.
- File downloads — downloads are separated into a dedicated card with expandable rows showing each file's source URL and SHA256 hash.
- Detailed IP address data — the Network tab now includes additional detail per IP address observed during the scan.
Explore these improvements on the Cloudflare Radar URL Scanner ↗.
Logpush now supports higher-precision timestamp formats for log output. You can configure jobs to output timestamps at millisecond or nanosecond precision. This is available in both the Logpush UI in the Cloudflare dashboard and the Logpush API.
To use the new formats, set
timestamp_formatin your Logpush job'soutput_options:rfc3339ms—2024-02-17T23:52:01.123Zrfc3339ns—2024-02-17T23:52:01.123456789Z
Default timestamp formats apply unless explicitly set. The dashboard defaults to
rfc3339and the API defaults tounixnano.For more information, refer to the Log output options documentation.