Monitor Cloudflare Tunnel with Grafana
Grafana ↗ is a dashboard tool that visualizes data stored in other databases. You can use Grafana to convert your tunnel metrics into actionable insights.
It is not possible to push metrics directly from cloudflared to Grafana. Instead, cloudflared runs a Prometheus ↗ metrics endpoint, which a Prometheus server periodically scrapes. Grafana then uses Prometheus as a data source to present metrics to the administrator.
flowchart LR

  subgraph 192.168.1.1
  A[cloudflared]-->B[Metrics endpoint]
  end

  B--->C
  subgraph 192.168.1.2
  C[Prometheus server]-->D[Grafana dashboard]
  end
This tutorial covers how to create the metrics endpoint, set up the Prometheus server, and view the data in Grafana.
- You will need a Cloudflare Tunnel. To create a tunnel, refer to our getting started guide.
If your tunnel was created via the CLI, run the following command on the cloudflared server (192.168.1.1):
cloudflared tunnel --metrics 192.168.1.1:60123 run my-tunnelIf your tunnel was created via the dashboard, the --metrics flag must be added to your cloudflared system service configuration. Refer to Add tunnel run parameters for instructions on how to do this.
On the Prometheus and Grafana server (192.168.1.2):
-
Download ↗ Prometheus.
-
Extract Prometheus:
Terminal window tar xvfz prometheus-*.tar.gzcd prometheus-* -
Open
prometheus.ymlin a text editor and add thecloudflaredjob to the end of the file:# my global configglobal:scrape_interval: 15s # Set the scrape interval to every 15 seconds. Default is every 1 minute.evaluation_interval: 15s # Evaluate rules every 15 seconds. The default is every 1 minute.# scrape_timeout is set to the global default (10s).# Alertmanager configurationalerting:alertmanagers:- static_configs:- targets:# - alertmanager:9093# Load rules once and periodically evaluate them according to the global 'evaluation_interval'.rule_files:# - "first_rules.yml"# - "second_rules.yml"# A scrape configuration containing exactly one endpoint to scrape:# Here it's Prometheus itself.scrape_configs:# The job name is added as a label `job=<job_name>` to any timeseries scraped from this config.- job_name: "prometheus"# metrics_path defaults to '/metrics'# scheme defaults to 'http'.static_configs:- targets: ["localhost:9090"] ## Address of Prometheus dashboard- job_name: "cloudflared"static_configs:- targets: ["198.168.1.1:60123"] ## cloudflared server IP and the --metrics port configured for the tunnel -
Start Prometheus:
Terminal window ./prometheus --config.file="prometheus.yml"You can optionally configure Prometheus to run as a service so that it does not need to be manually started if the machine reboots.
-
Open a browser and go to
http://localhost:9090/. You should be able to access the Prometheus dashboard. -
To verify that Prometheus is fetching tunnel metrics, enter
cloudflared_tunnel_total_requestsinto the expression console and select Execute.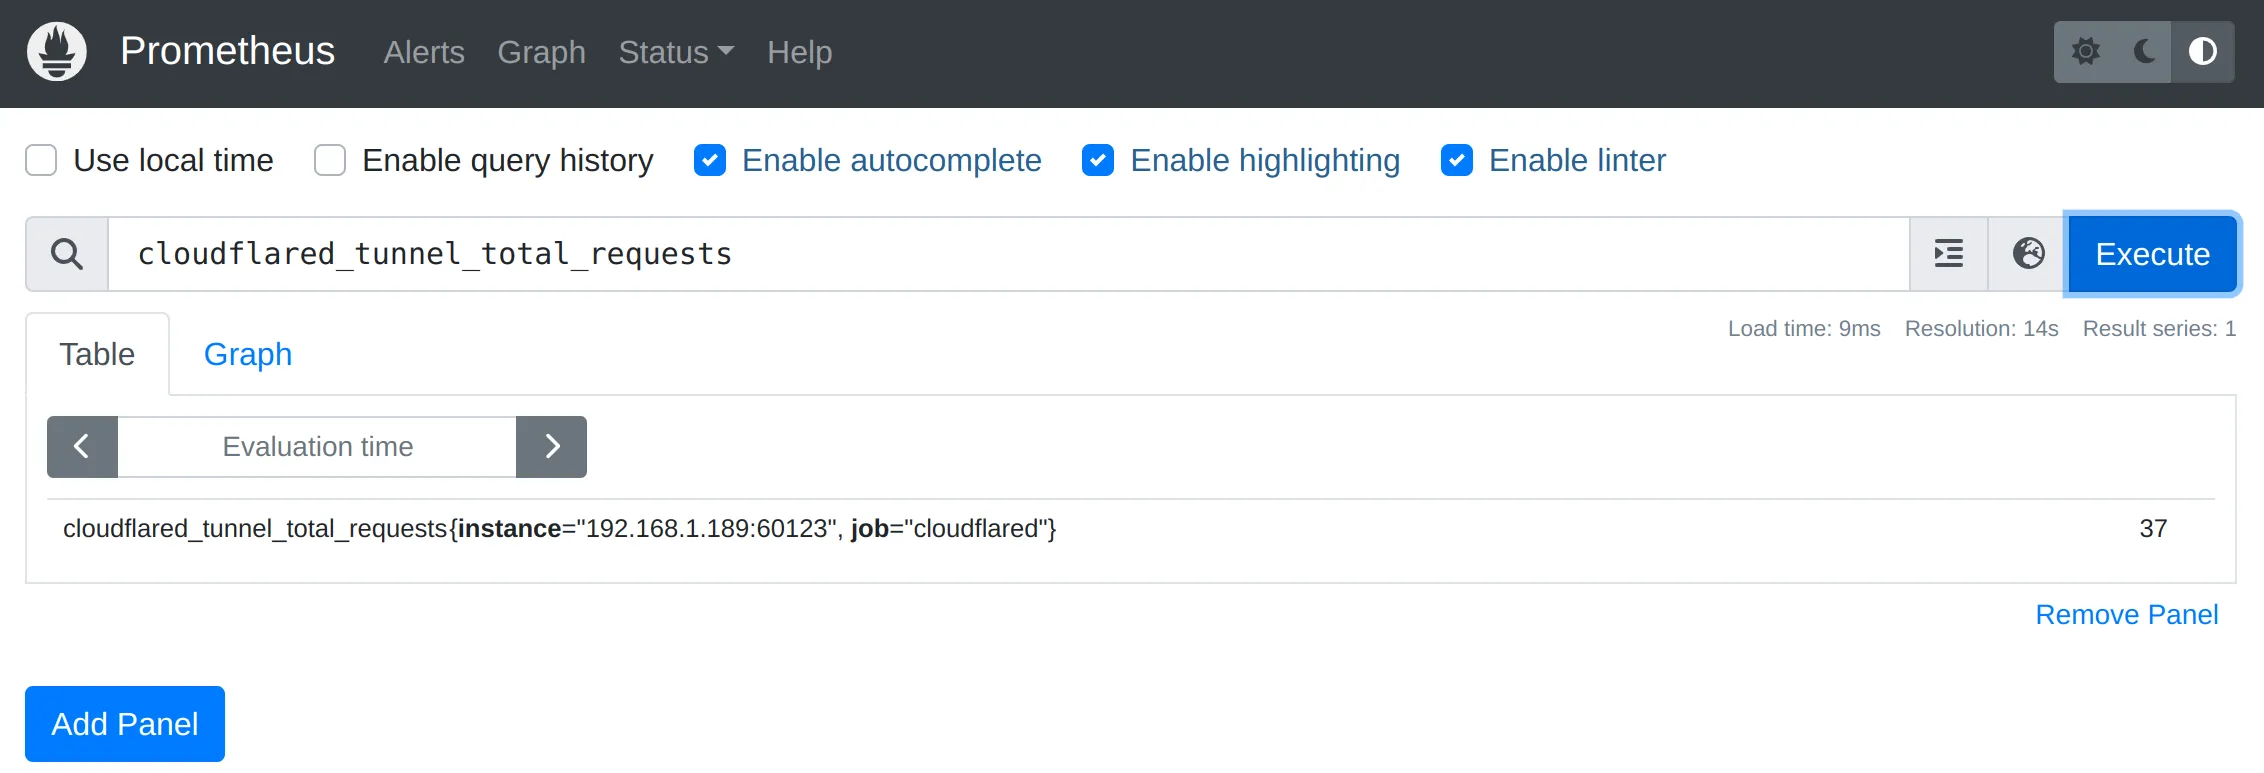
Refer to Available metrics to check what other metrics are available.
-
Download ↗ and install Grafana.
-
Start Grafana as a system service:
Terminal window sudo systemctl daemon-reloadsudo systemctl start grafana-server -
Verify that Grafana is running:
Terminal window sudo systemctl status grafana-server -
Open a browser and go to
http://localhost:3000/. The default HTTP port that Grafana listens to is3000unless you have configured a different port. -
On the sign-in page, enter your Grafana credentials.
To test without an account, you can enter
adminfor both the username and password and skip the password change step. -
In Grafana, go to Connections > Data sources.
-
Select Add a new data source and select Prometheus.
-
In the Prometheus server URL field, enter the IP address and port of your Prometheus dashboard (
http://localhost:9090). -
Select Save & test.
- In Grafana, go to Dashboards > New > New dashboard.
- Select Add visualization.
- Select Prometheus.
- In the metrics field, enter
cloudflared_tunnel_total_requestsand select Run queries. You will see a graph showing the number of requests as a function of time.
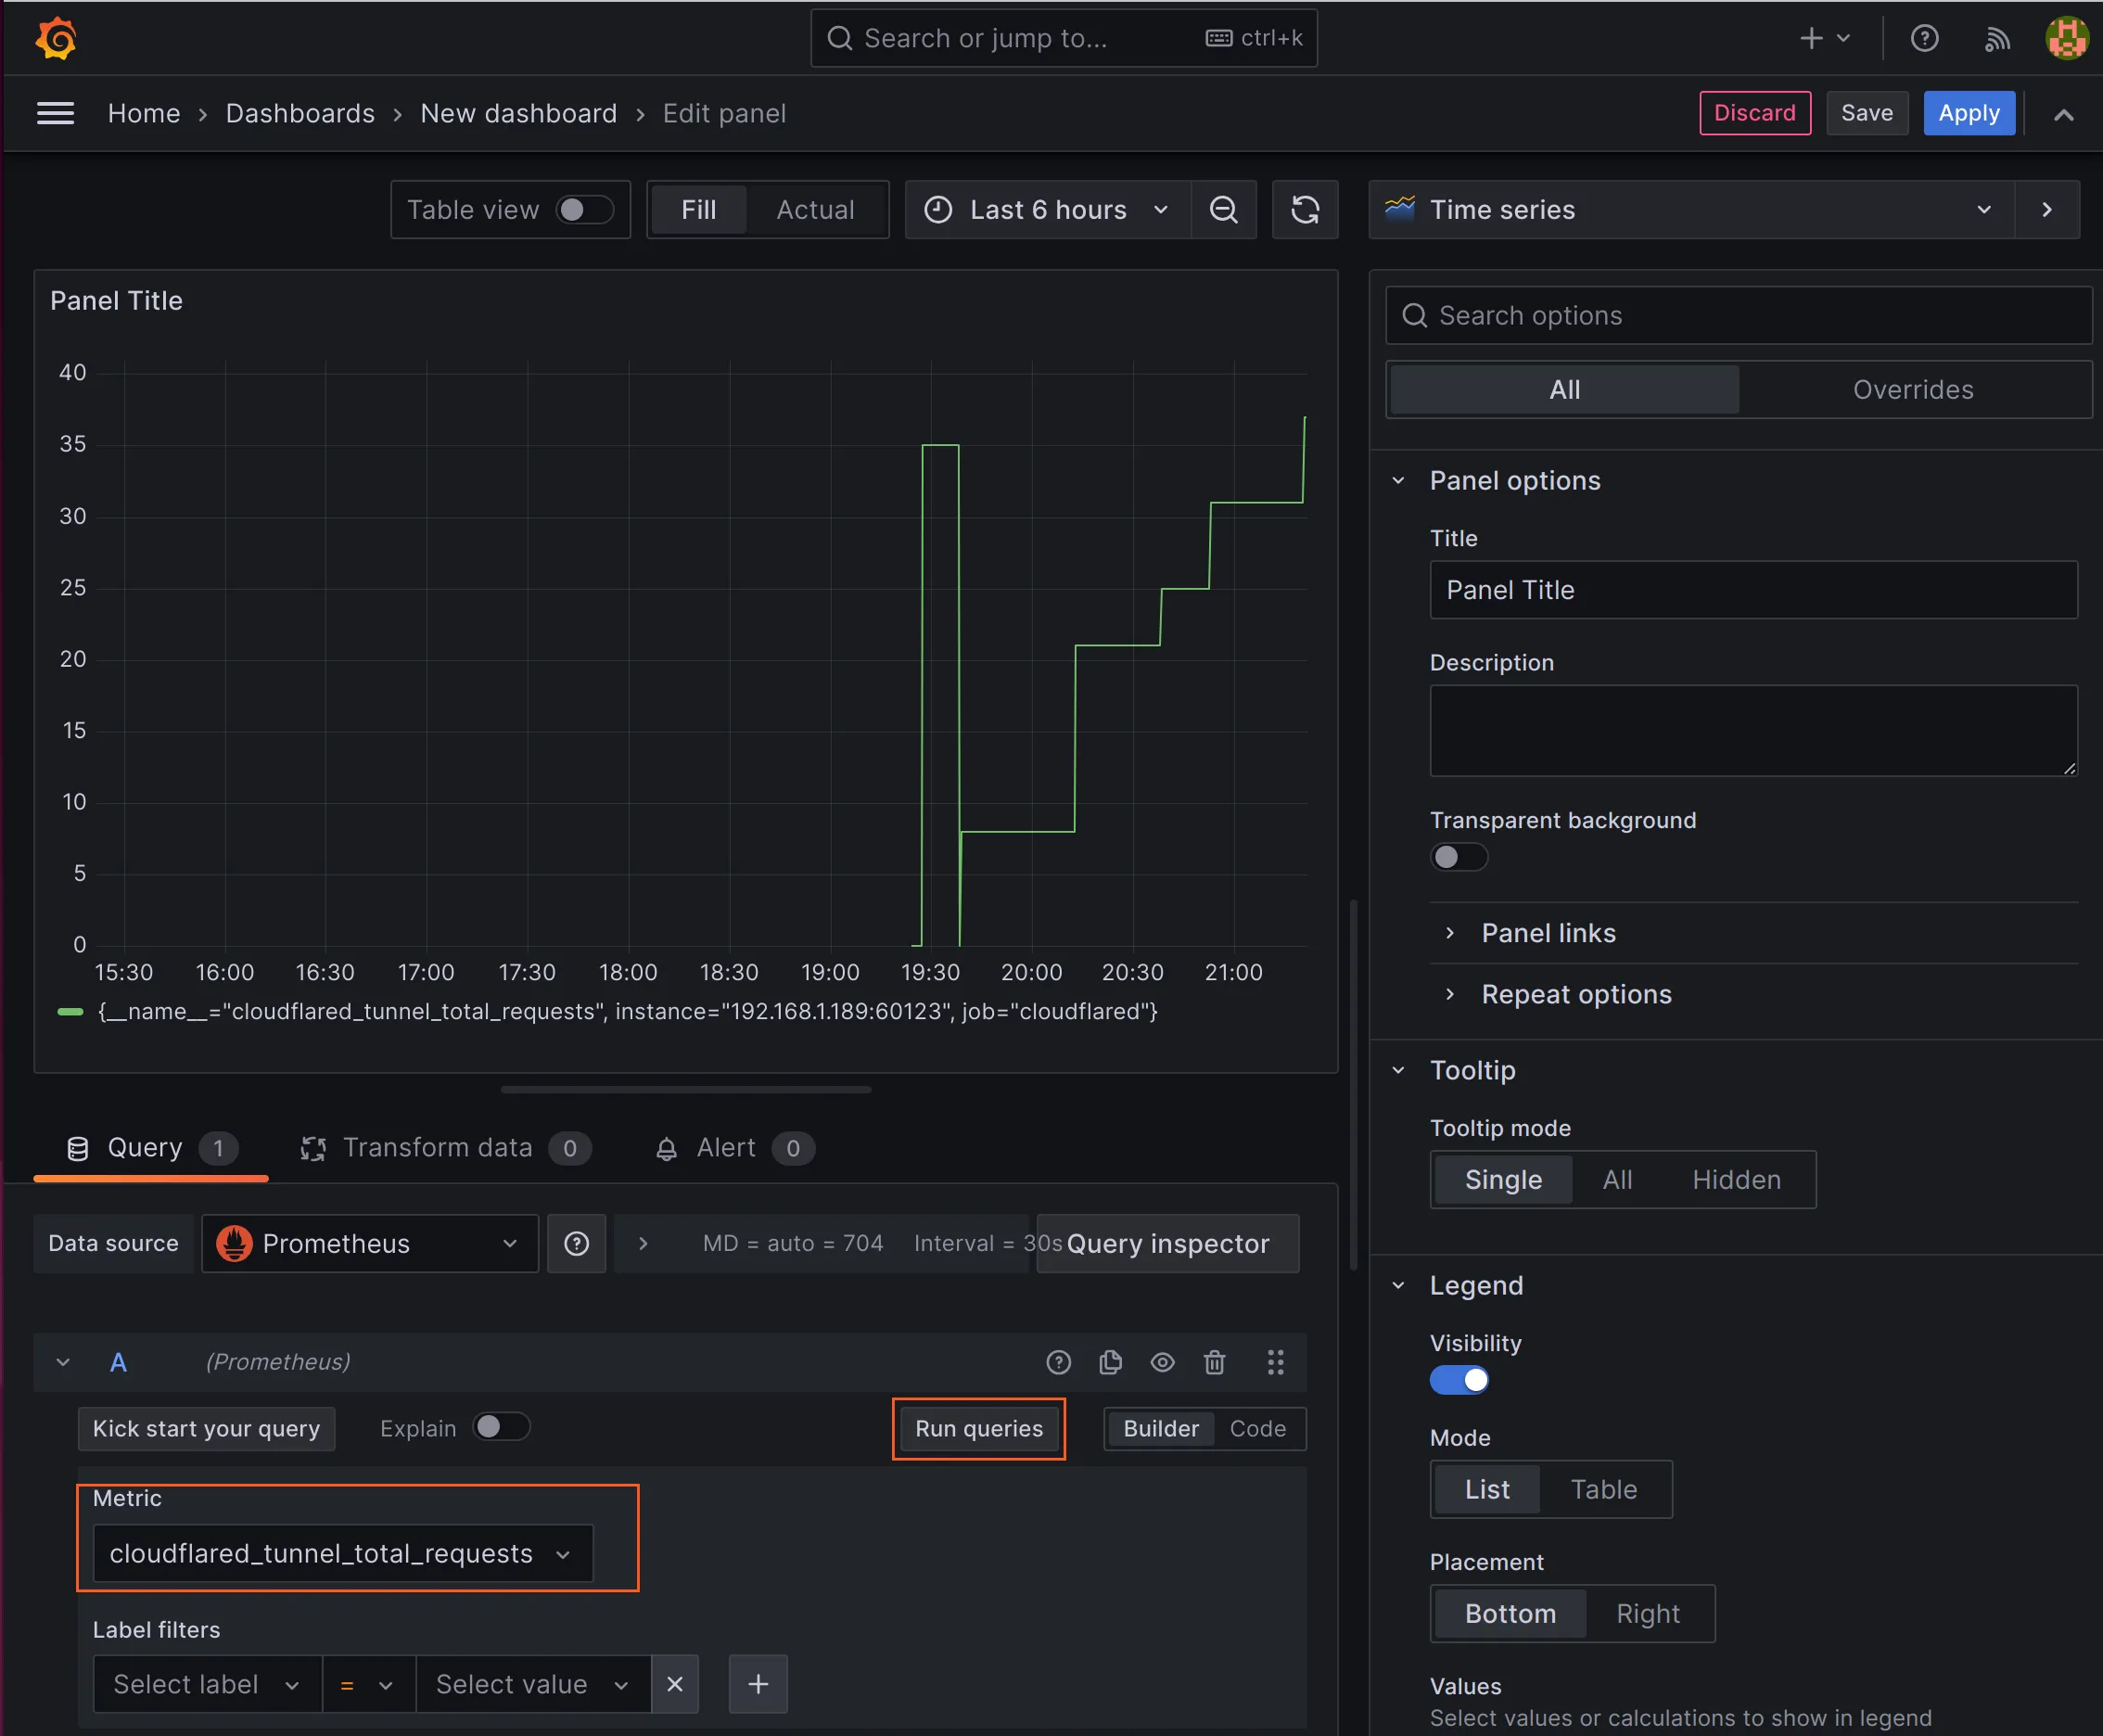
You can add operations to the queries to modify what is displayed. For example, you could show all tunnel requests over a recent period of time, such as a day, rather than all tunnel requests since metrics began reporting.