Tail Workers
A Tail Worker receives information about the execution of other Workers (known as producer Workers), such as HTTP statuses, data passed to console.log() or uncaught exceptions. Tail Workers can process logs for alerts, debugging, or analytics.
Tail Workers are available to all customers on the Workers Paid and Enterprise tiers. Tail Workers are billed by CPU time, not by the number of requests.
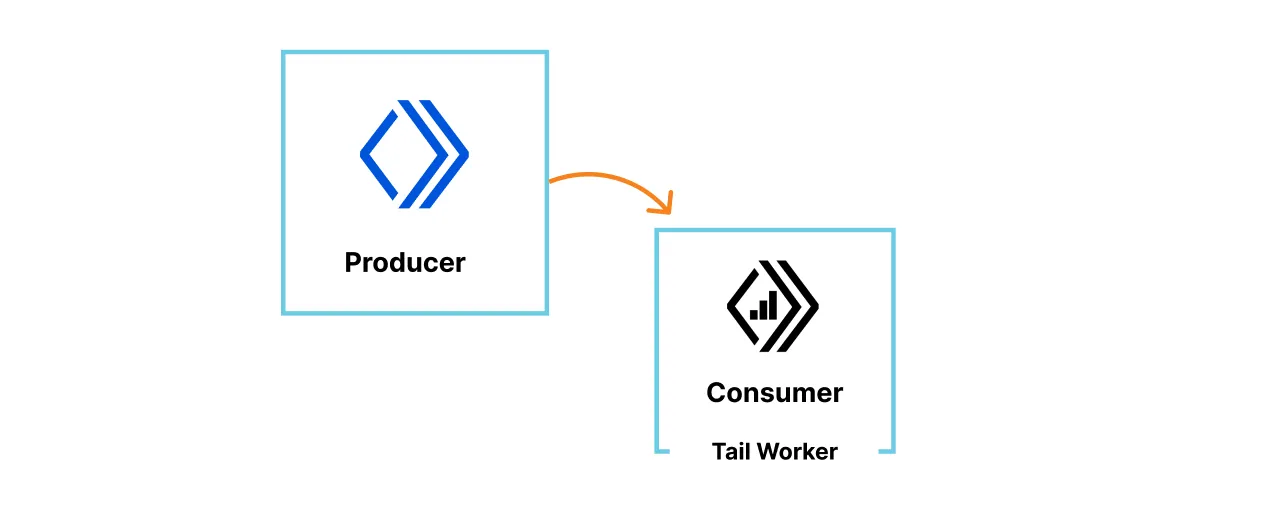
A Tail Worker is automatically invoked after the invocation of a producer Worker (the Worker the Tail Worker will track) that contains the application logic. It captures events after the producer has finished executing. Events throughout the request lifecycle, including potential sub-requests via Service Bindings and Dynamic Dispatch, will be included. You can filter, change the format of the data, and send events to any HTTP endpoint. For quick debugging, Tail Workers can be used to send logs to KV or any database.
To configure a Tail Worker:
- Create a Worker to serve as the Tail Worker.
- Add a
tail()handler to your Worker. Thetail()handler is invoked every time the producer Worker to which a Tail Worker is connected is invoked. The following Worker code is a Tail Worker that sends its data to an HTTP endpoint:
export default { async tail(events) { fetch("https://example.com/endpoint", { method: "POST", body: JSON.stringify(events), }); },};The following Worker code is an example of what the events object may look like:
[ { "scriptName": "Example script", "outcome": "exception", "eventTimestamp": 1587058642005, "event": { "request": { "url": "https://example.com/some/requested/url", "method": "GET", "headers": { "cf-ray": "57d55f210d7b95f3", "x-custom-header-name": "my-header-value" }, "cf": { "colo": "SJC" } } }, "logs": [ { "message": ["string passed to console.log()"], "level": "log", "timestamp": 1587058642005 } ], "exceptions": [ { "name": "Error", "message": "Threw a sample exception", "timestamp": 1587058642005 } ], "diagnosticsChannelEvents": [ { "channel": "foo", "message": "The diagnostic channel message", "timestamp": 1587058642005 } ] }]- Add the following to the Wrangler file of the producer Worker:
{ "tail_consumers": [ { "service": "<TAIL_WORKER_NAME>" } ]}[[tail_consumers]]service = "<TAIL_WORKER_NAME>"If you need aggregated analytics rather than individual log events, consider writing to Workers Analytics Engine from your Tail Worker. Analytics Engine is optimized for high-cardinality, time-series data that you can query with SQL.
For example, you can use a Tail Worker to count errors by endpoint, track response times by customer, or build usage metrics, then write those aggregates to Analytics Engine for querying and visualization.
export default { async tail(events, env) { for (const event of events) { env.ANALYTICS.writeDataPoint({ blobs: [event.scriptName, event.outcome], doubles: [1], indexes: [event.event?.request?.cf?.colo ?? "unknown"], }); } },};Refer to the Analytics Engine documentation for more details on writing and querying data.
tail()Handler API docs - Learn how to set up atail()handler in your Worker.- Analytics Engine - Write custom analytics from your Worker for high-cardinality, time-series queries.
- Errors and exceptions - Review common Workers errors.
- Local development - Develop and test your Workers locally.
- Source maps and stack traces - Learn how to enable source maps and generate stack traces for Workers.