Attaching a Debugger
You can use regular Node.js tools to debug your Workers. Setting breakpoints, watching values and inspecting the call stack are all examples of things you can do with a debugger.
The easiest way to debug a Worker in VSCode is to create a new configuration.
Open the Run and Debug menu in the VSCode activity bar and create a
.vscode/launch.json file that contains the following:
---filename: .vscode/launch.json---{ "configurations": [ { "name": "Miniflare", "type": "node", "request": "attach", "port": 9229, "cwd": "/", "resolveSourceMapLocations": null, "attachExistingChildren": false, "autoAttachChildProcesses": false, } ]}From the Run and Debug menu in the activity bar, select the Miniflare
configuration, and click the green play button to start debugging.
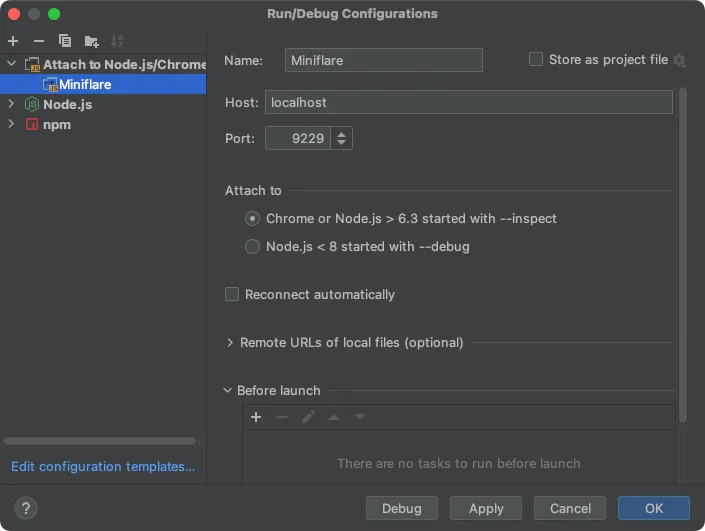
Create a new configuration, by clicking Add Configuration in the top right.
Click the plus button in the top left of the popup and create a new
Node.js/Chrome configuration. Set the Host field to localhost and the
Port field to 9229. Then click OK.
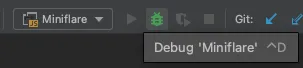
With the new configuration selected, click the green debug button to start debugging.
Breakpoints can also be added via the Workers DevTools. For more information, read the guide in the Cloudflare Workers docs.