Query Builder
The Query Builder helps you write structured queries to investigate and visualize your telemetry data. The Query Builder searches the Workers Observability dataset, which currently includes all logs stored by Workers Logs.
The Query Builder can be found in the Observability page of the Cloudflare dashboard:
Go to ObservabilityThe Query Builder is available to all developers and requires no enablement. Queries search all Workers Logs stored by Cloudflare. If you have not yet enabled Workers Logs, you can do so by adding the following setting to your Worker's Wrangler file and redeploying your Worker.
{ "observability": { "enabled": true, "logs": { "invocation_logs": true, "head_sampling_rate": 1 // optional. default = 1. } }}[observability]enabled = true
[observability.logs] invocation_logs = true head_sampling_rate = 1-
In the Cloudflare dashboard, go to the Workers & Pages page.
Go to Workers & Pages -
Select your Worker.
-
Select Observability in the left-hand navigation panel, and then the Overview tab.
-
Select a Visualization.
-
Optional: Add fields to Filter, Group By, Order By, and Limit. For more information, see what composes a query.
-
Optional: Select the appropriate time range.
-
Select Run. The query will automatically run whenever changes are made.
The Query Builder supports many visualization operators, including:
| Function | Arguments | Description |
|---|---|---|
| Count | n/a | The total number of rows matching the query conditions |
| Count Distinct | any field | The number of occurrences of the unique values in the dataset |
| Min | numeric field | The smallest value for the field in the dataset |
| Max | numeric field | The largest value for the field in the dataset |
| Sum | numeric field | The total of all of the values for the field in the dataset |
| Average | numeric field | The average of the field in the dataset |
| Standard Deviation | numeric field | The standard deviation of the field in the dataset |
| Variance | numeric field | The variance of the field in the dataset |
| P001 | numeric field | The value of the field below which 0.1% of the data falls |
| P01 | numeric field | The value of the field below with 1% of the data falls |
| P05 | numeric field | The value of the field below with 5% of the data falls |
| P10 | numeric field | The value of the field below with 10% of the data falls |
| P25 | numeric field | The value of the field below with 25% of the data falls |
| Median (P50) | numeric field | The value of the field below with 50% of the data falls |
| P75 | numeric field | The value of the field below with 75% of the data falls |
| P90 | numeric field | The value of the field below with 90% of the data falls |
| P95 | numeric field | The value of the field below with 95% of the data falls |
| P99 | numeric field | The value of the field below with 99% of the data falls |
| P999 | numeric field | The value of the field below with 99.9% of the data falls |
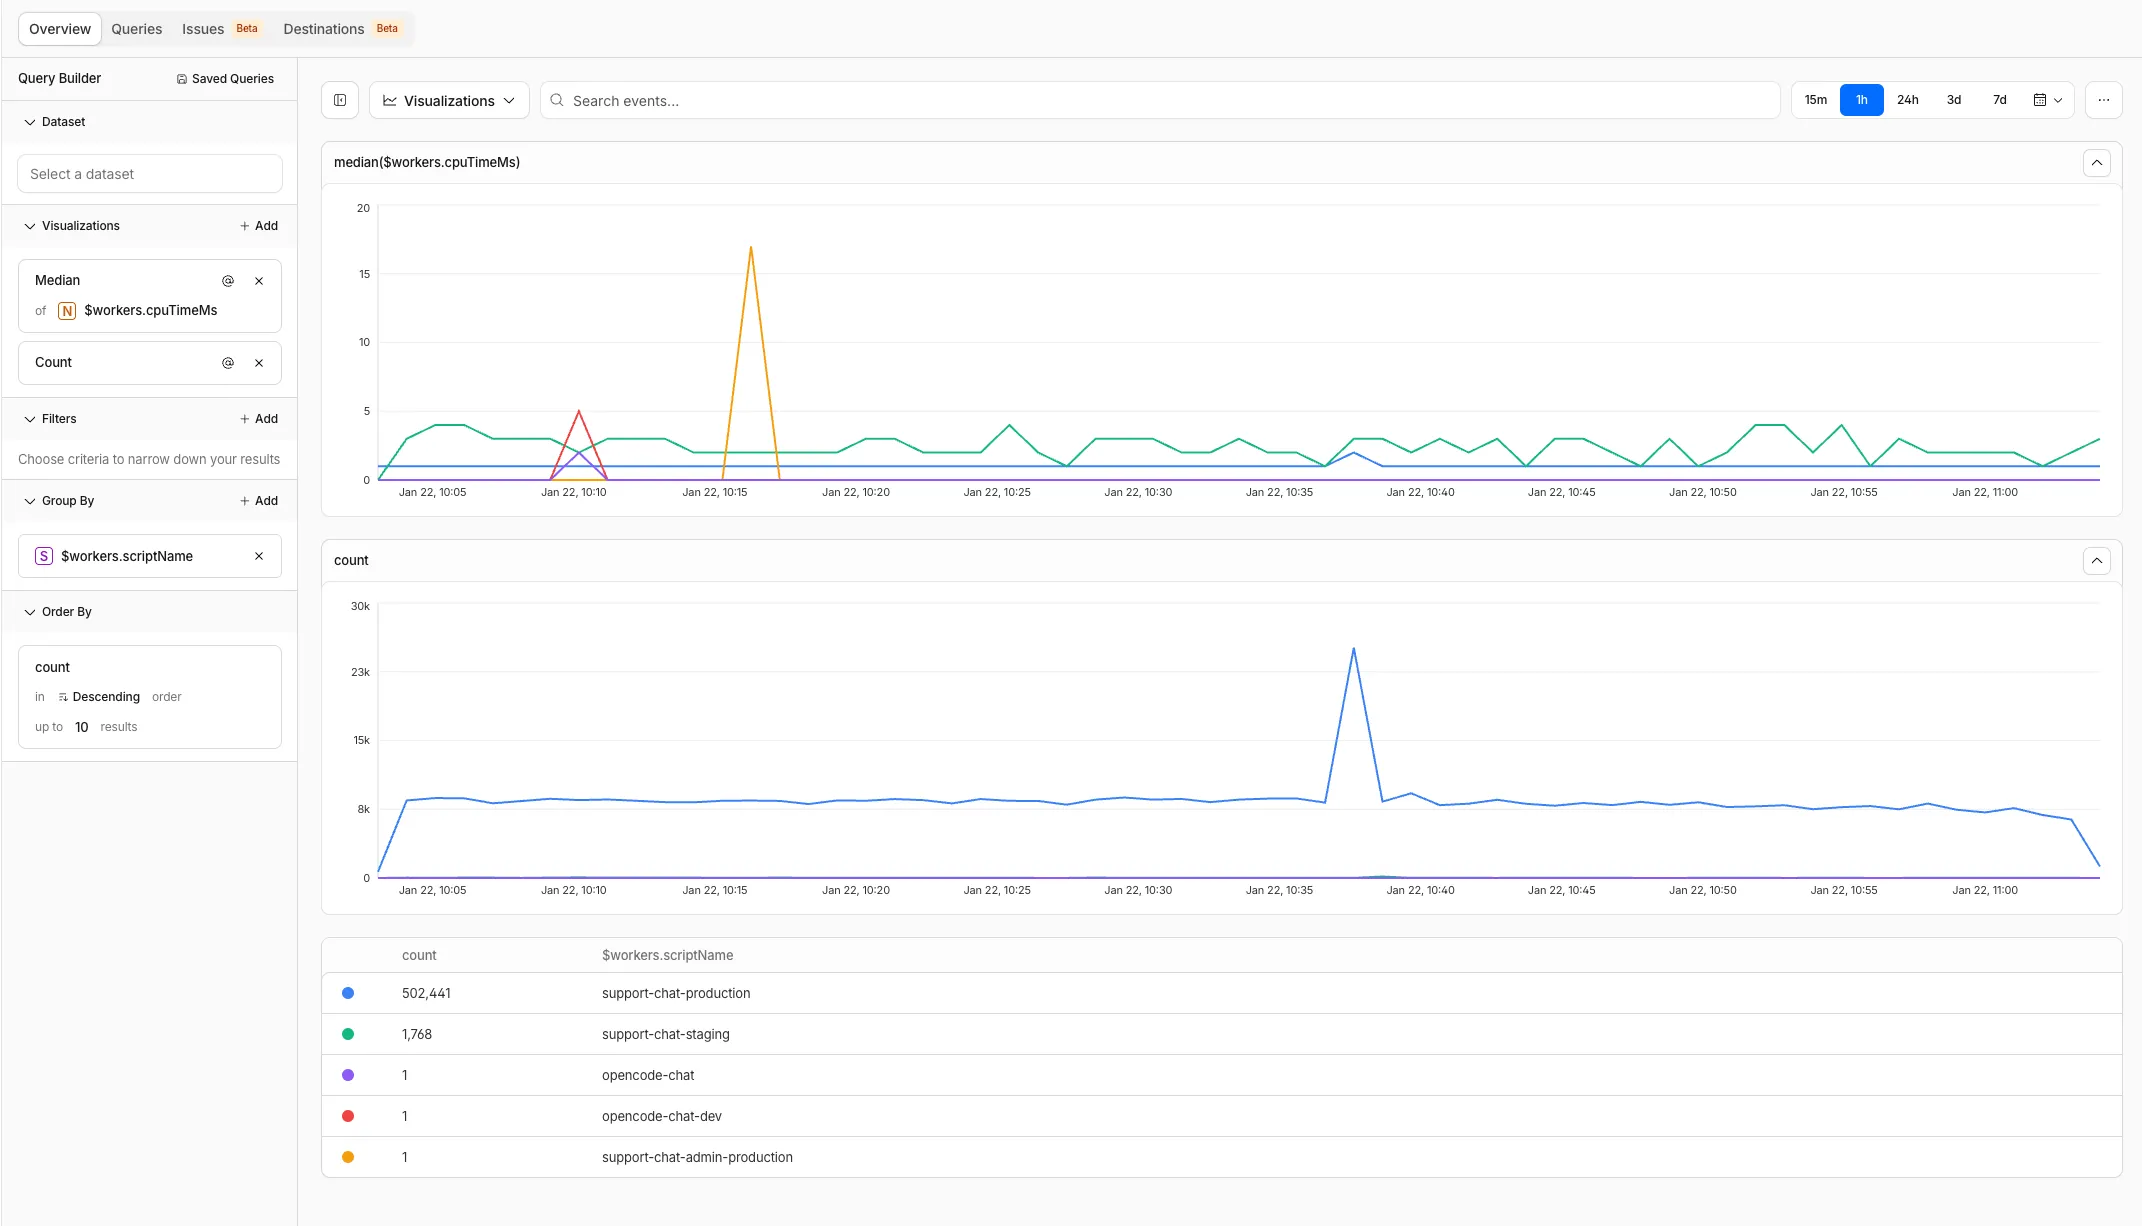
You can add multiple visualizations in a single query. Each visualization renders a graph. A single summary table is also returned, which shows the raw query results.
All methods are aggregate functions. Most methods operate on a specific field in the log event. Count is an exception, and is an aggregate function that returns the number of log events matching the filter conditions.
Filters help return the columns that match the specified conditions. Filters have three components: a key, an operator, and a value.
The key is any field in a log event. For example, you may choose $workers.cpuTimeMs or $metadata.message.
The operator is a logical condition that evaluates to true or false. See the table below for supported conditions:
| Data Type | Valid Conditions (Operators) |
|---|---|
| Numeric | Equals, Does not equal, Greater, Greater or equals, Less, Less or equals, Exists, Does not exist |
| String | Equals, Does not equal, Includes, Does not include, Regex, Exists, Does not exist, Starts with |
The value for a numeric field is an integer. The value for a string field is any string.
To add a filter:
- Select + in the Filter section. 2. Select Select key... and
input a key name. For example,
$workers.cpuTimeMs. 3. Select the operator and change it to the operator best suited. For example,Greater than. 4. Select Select value... and input a value. For example,100.
When you run the query with the filter specified above, only log events where $workers.cpuTimeMs > 100 will be returned.
Adding multiple filters combines them with an AND operator, meaning that only events matching all the filters will be returned.
Search is a text filter that returns only events containing the specified text. Search can be helpful as a quick filtering mechanism, or to search for unique identifiable values in your logs.
Group By combines rows that have the same value into summary rows. For example, if a query adds $workers.event.request.cf.country as a Group By field, then the summary table will group by country.
Order By affects how the results are sorted in the summary table. If asc is selected, the results are sorted in ascending order - from least to greatest. If desc is selected, the results are sorted in descending order - from greatest to least.
Limit restricts the number of results returned. When paired with Order By, it can be used to return the "top" or "first" N results.
When you select a time range, you specify the time interval where you want to look for matching events. The retention period is dependent on your plan type.
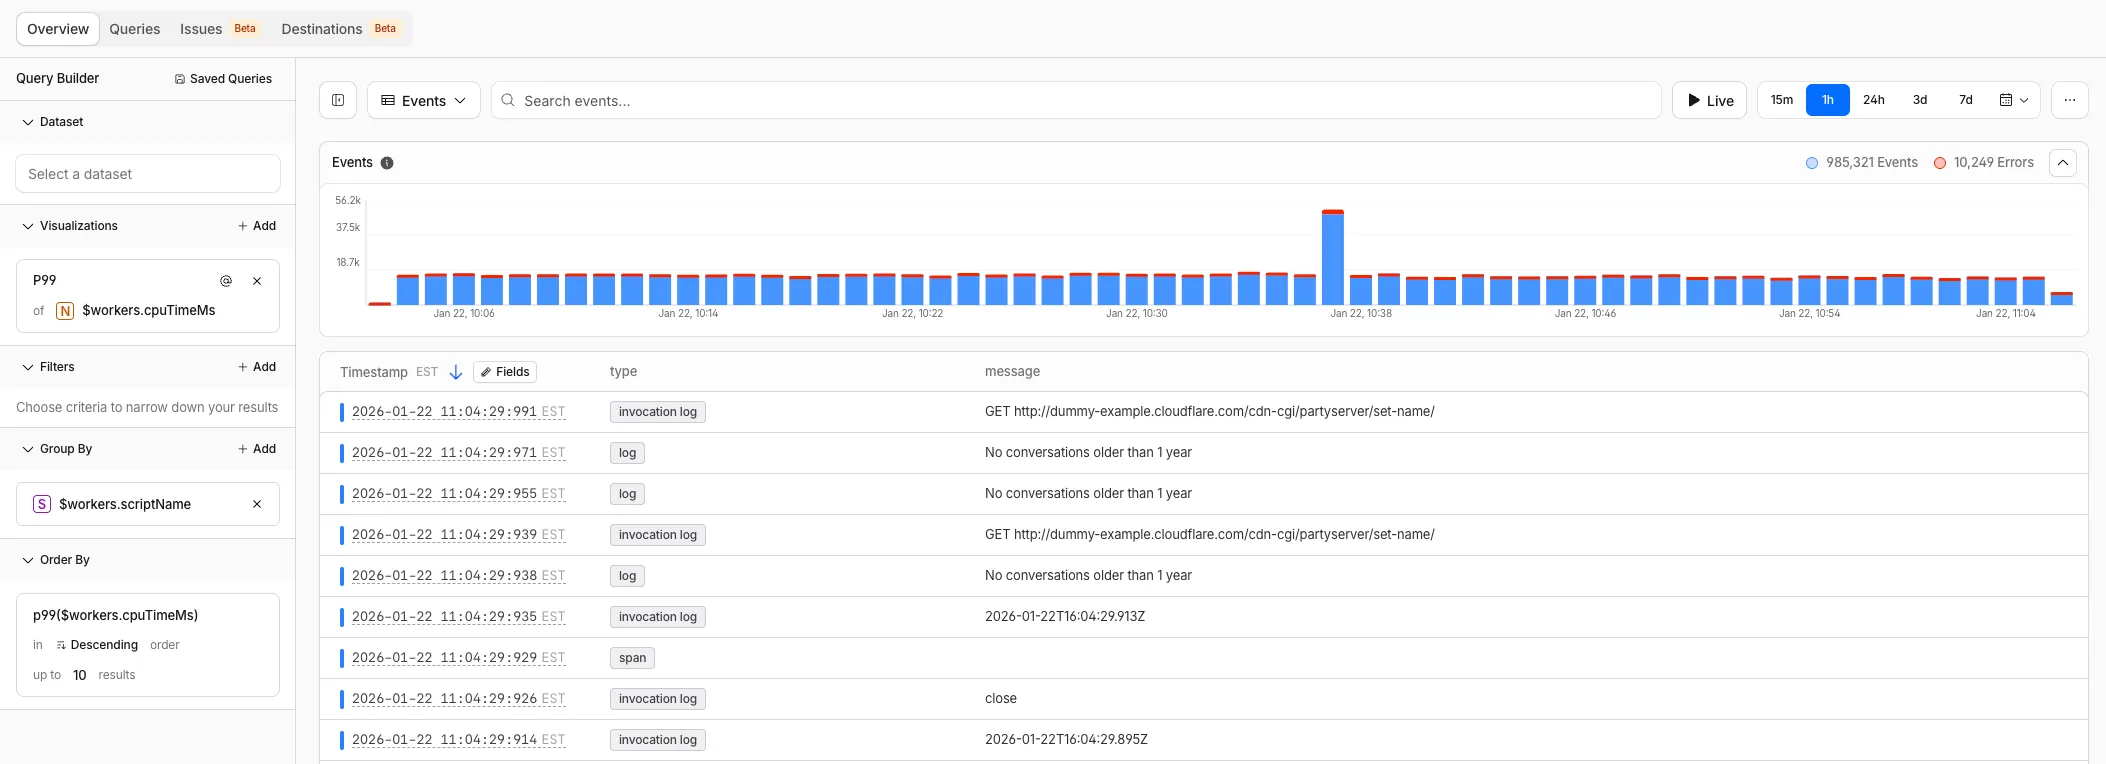
There are three views for queries: Visualizations, Invocations, and Events.
The Visualizations tab shows graphs and a summary table for the query.
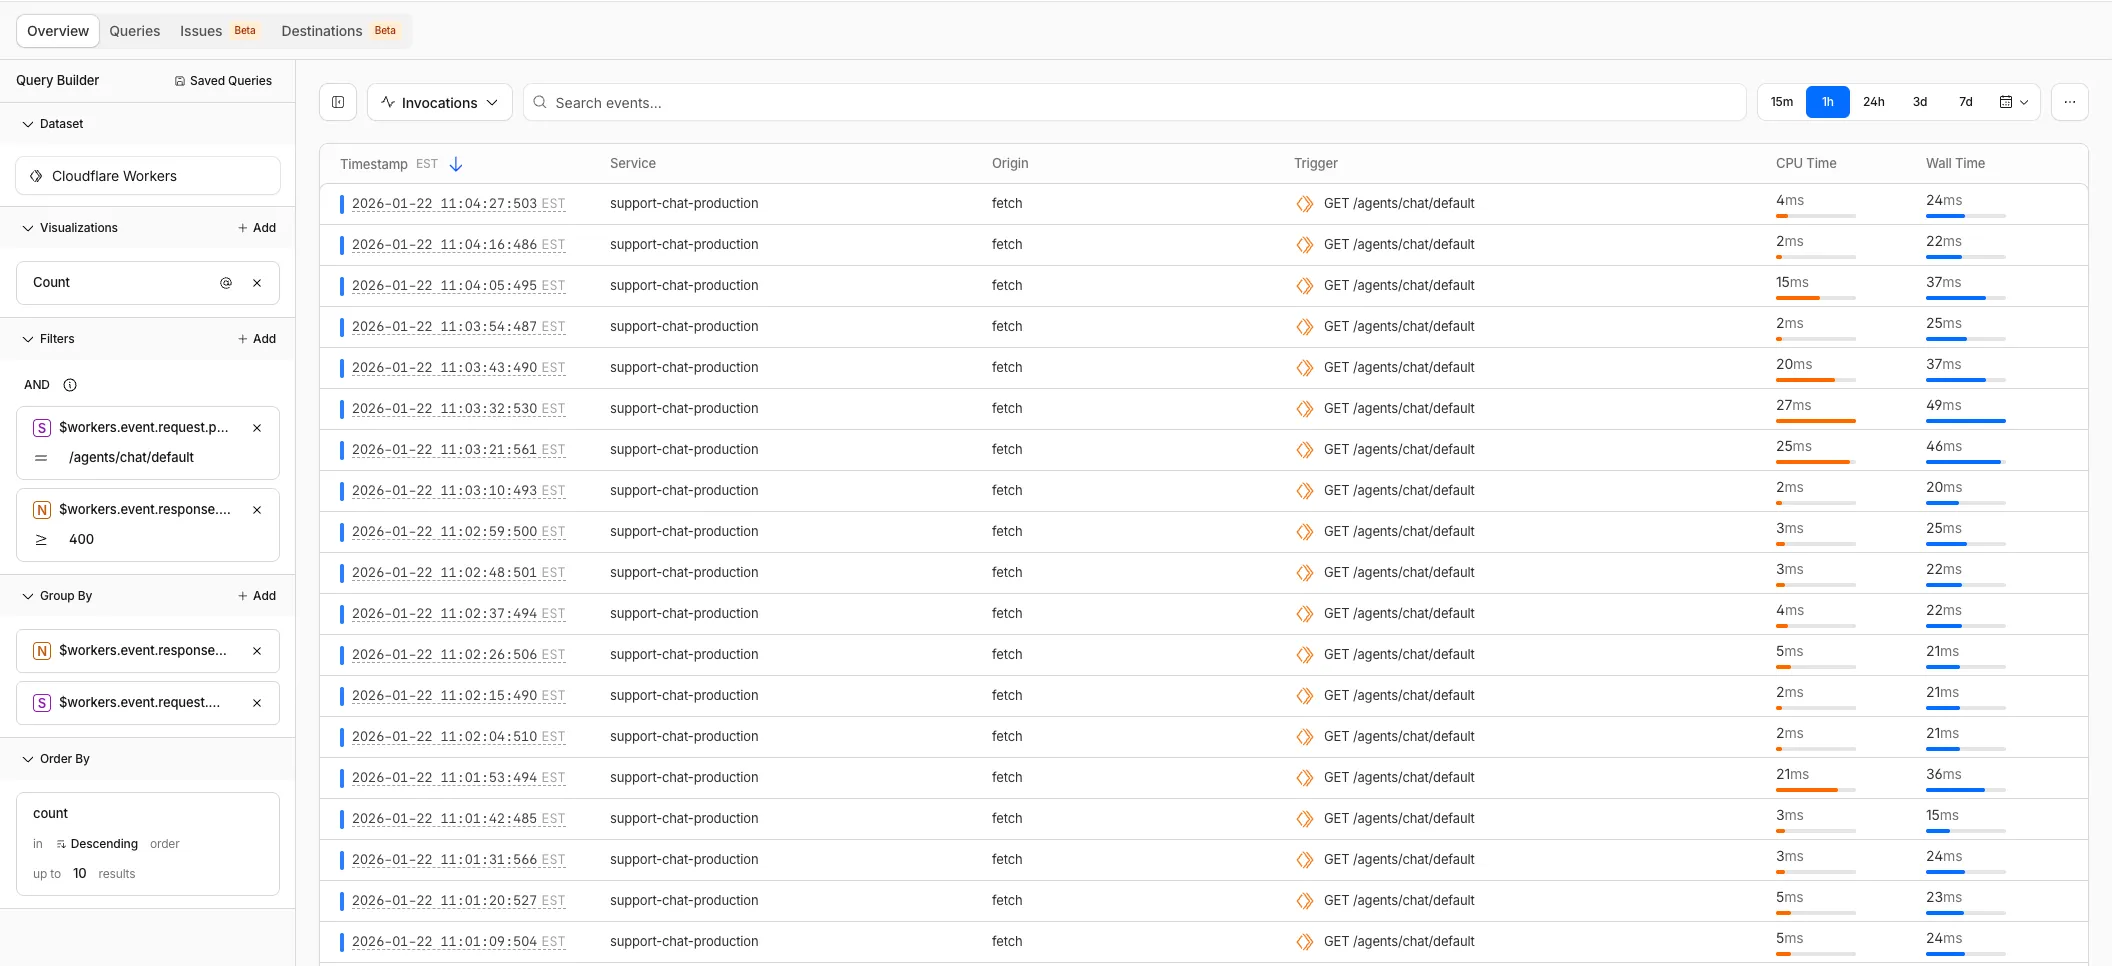
The Invocations tab shows all logs, grouped by by the invocation, and ordered by timestamp. Only invocations matching the query criteria are returned.
The Events tab shows all logs, ordered by timestamp. Only events matching the query criteria are returned. The Events tab can be customized to add additional fields in the view.
It is recommended to save queries that may be reused for future investigations. You can save a query with a name, description, and custom tags by selecting Save Query. Queries are saved at the account-level and are accessible to all users in the account.
Saved queries can be re-run by selecting the relevant query from the Queries tab. You can edit the query and save edits.
Queries can be starred by users. Starred queries are unique to the user, and not to the account.
Saved queries can be deleted from the Queries tab. If you delete a query, the query is deleted for all users in the account.
-
In the Cloudflare dashboard, go to the Observability page.
Go to Observability -
Select the Queries tab.
-
On the right-hand side, select the three dots for additional actions.
-
Select Delete Query and follow the instructions.
Saved queries are assigned a unique URL and can be shared with any user in the account.
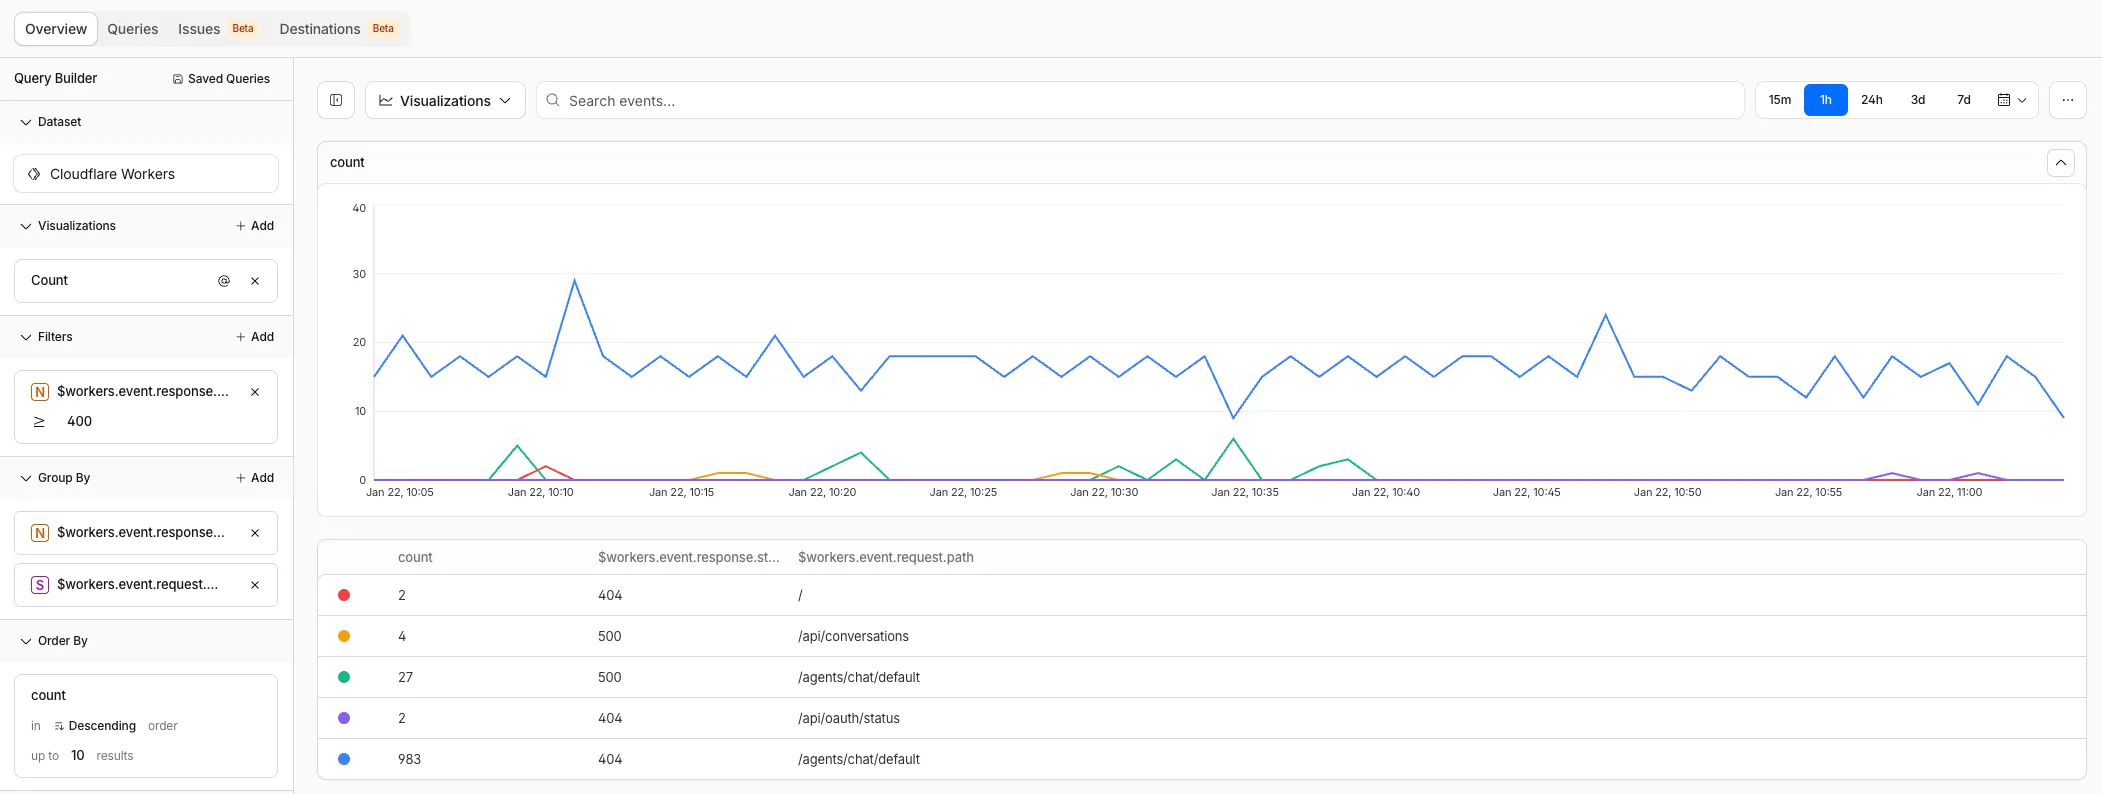
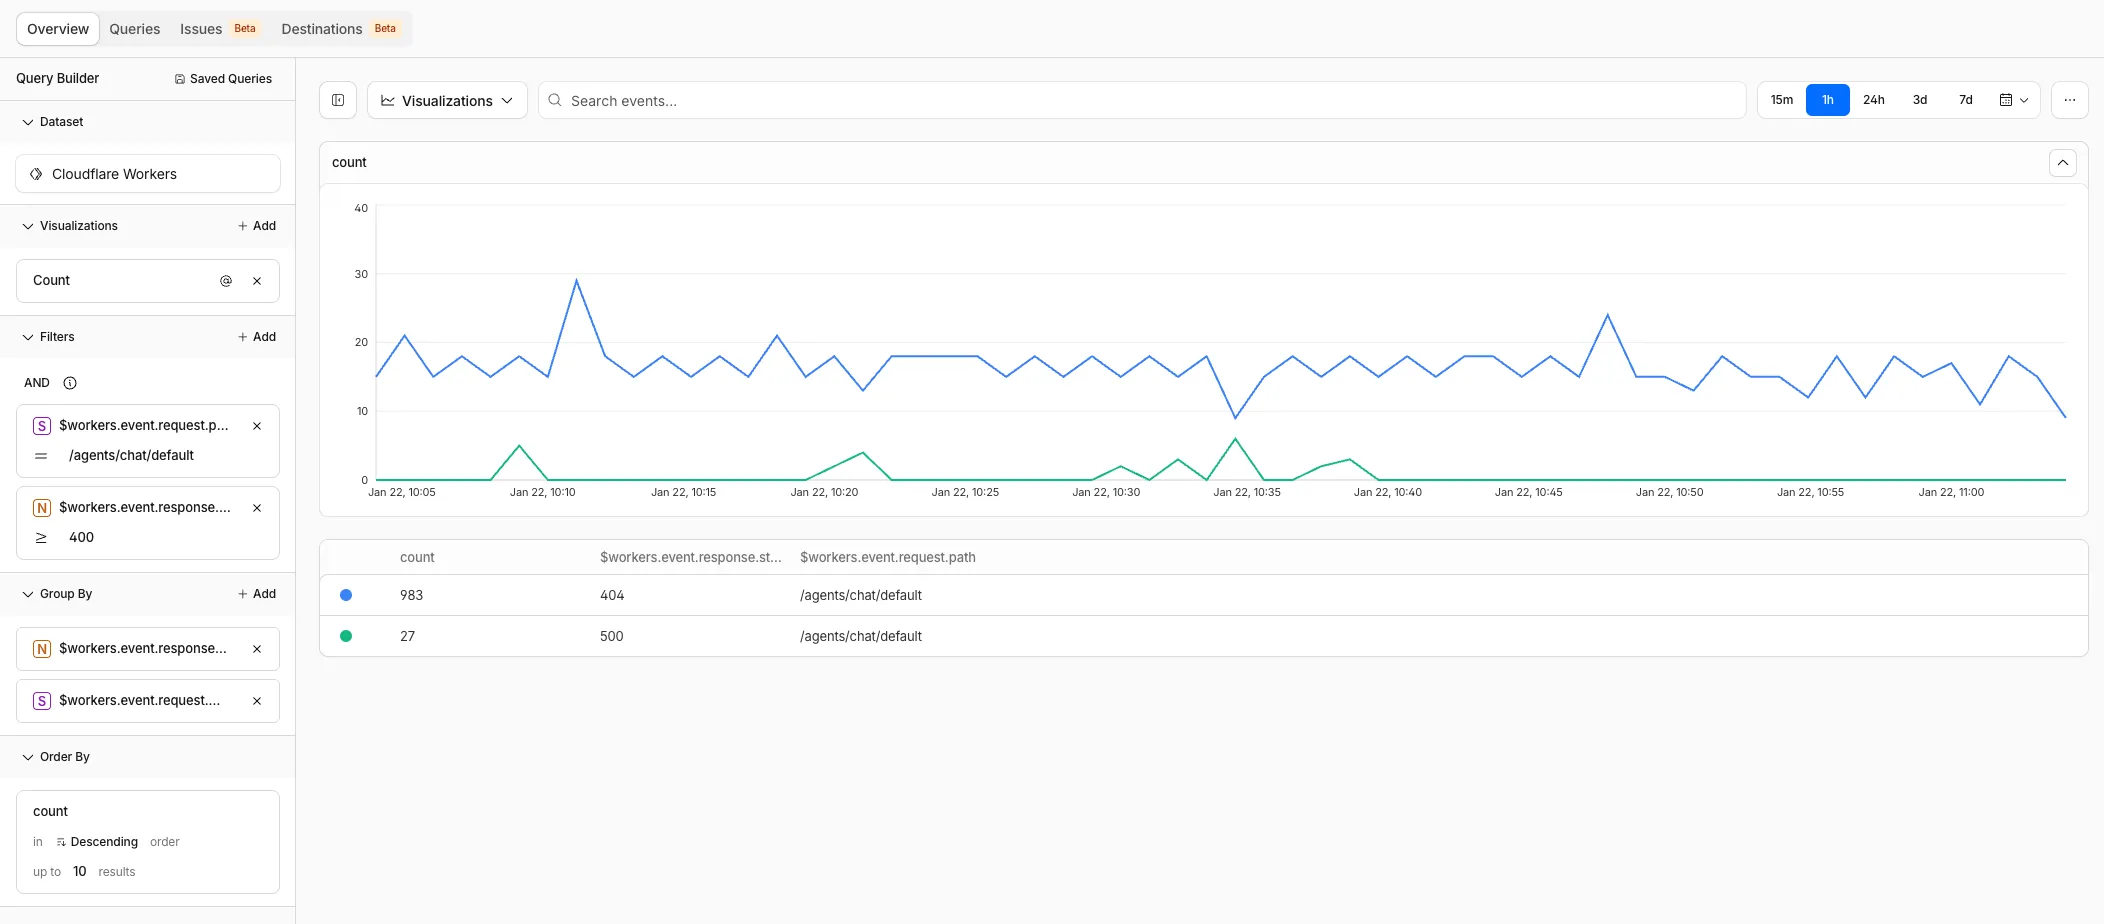
In this example, we will construct a query to find and debug all paths that respond with 5xx errors. First, we create a base query. In this base query, we want to visualize by
the raw event count. We can add a filter for $workers.event.response.status that is greater than 500.
Then, we group by $workers.event.request.path and $workers.event.response.status to identify the number of requests that were
affected by this behavior.
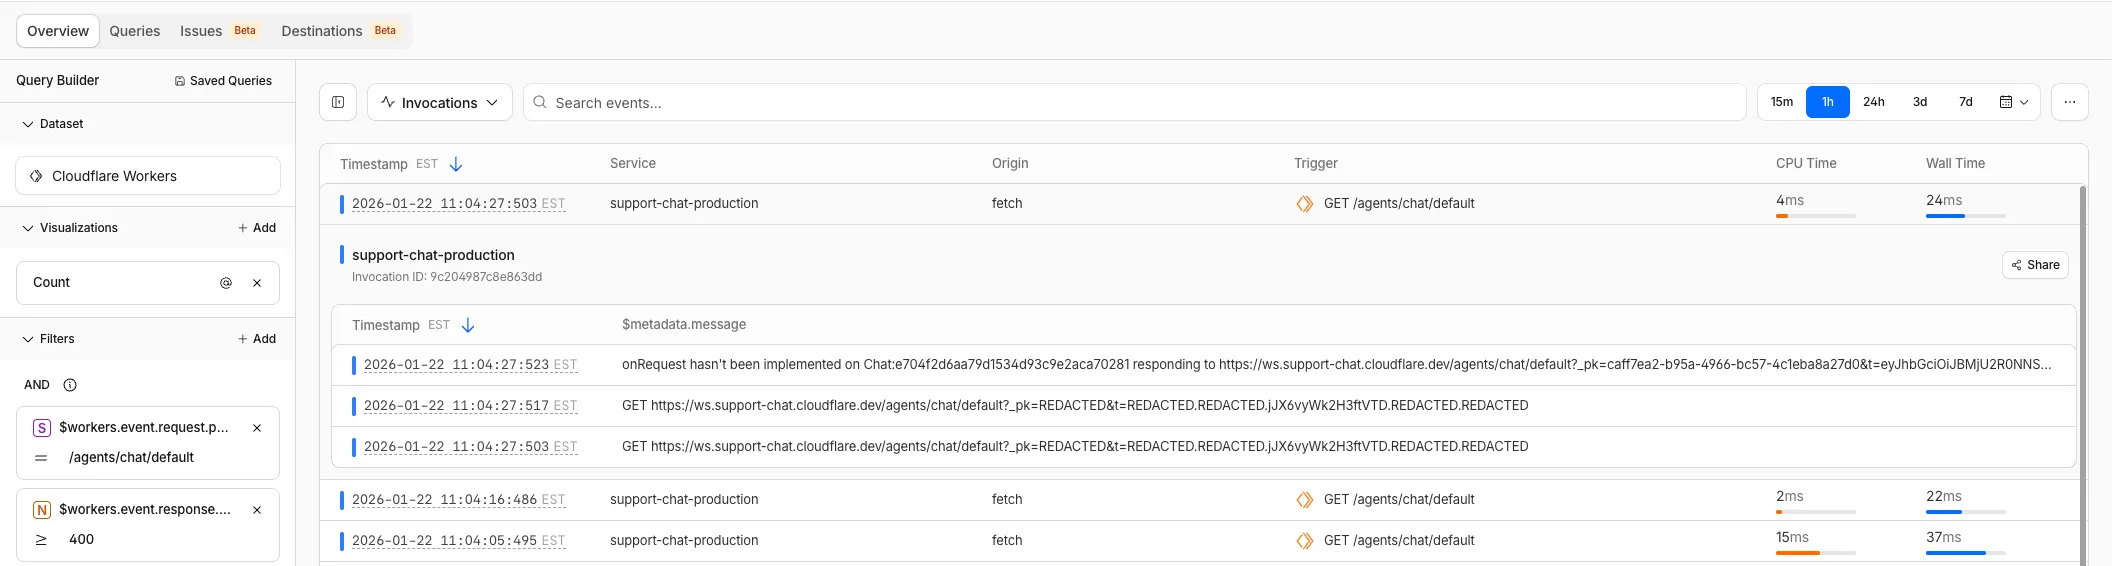
The results show that the /agents/chat/default path has been experiencing 404s and 500s. Now, we can apply a filter for this path and investigate.
Now, we can investigate by selecting the Invocations tab. We can see that there were two logged invocations of this error.
We can expand a single invocation to view the relevant logs, and continue to debug.