Workers Logs
Workers Logs lets you automatically collect, store, filter, and analyze logging data emitted from Cloudflare Workers. Data is written to your Cloudflare Account, and you can query it in the dashboard for each of your Workers. All newly created Workers will come with the observability setting enabled by default.
Logs include invocation logs, custom logs, errors, and uncaught exceptions.
To send logs to a third party, use Workers Logpush or Tail Workers.
You must add the observability setting for your Worker to write logs to Workers Logs. Add the following setting to your Worker's Wrangler file and redeploy your Worker.
{ "observability": { "enabled": true, "head_sampling_rate": 1 // optional. default = 1. }}[observability]enabled = truehead_sampling_rate = 1Head-based sampling allows you set the percentage of Workers requests that are logged.
Environments allow you to deploy the same Worker application with different configurations. For example, you may want to configure a different head_sampling_rate to staging and production. To configure observability for an environment named staging: 1. Add the following configuration below [env.staging]
{ "env": { "staging": { "observability": { "enabled": true, "head_sampling_rate": 1 // optional } } }}[env.staging.observability]enabled = truehead_sampling_rate = 1- Deploy your Worker with
npx wrangler deploy -e staging - Repeat step 1 and 2 for each environment.
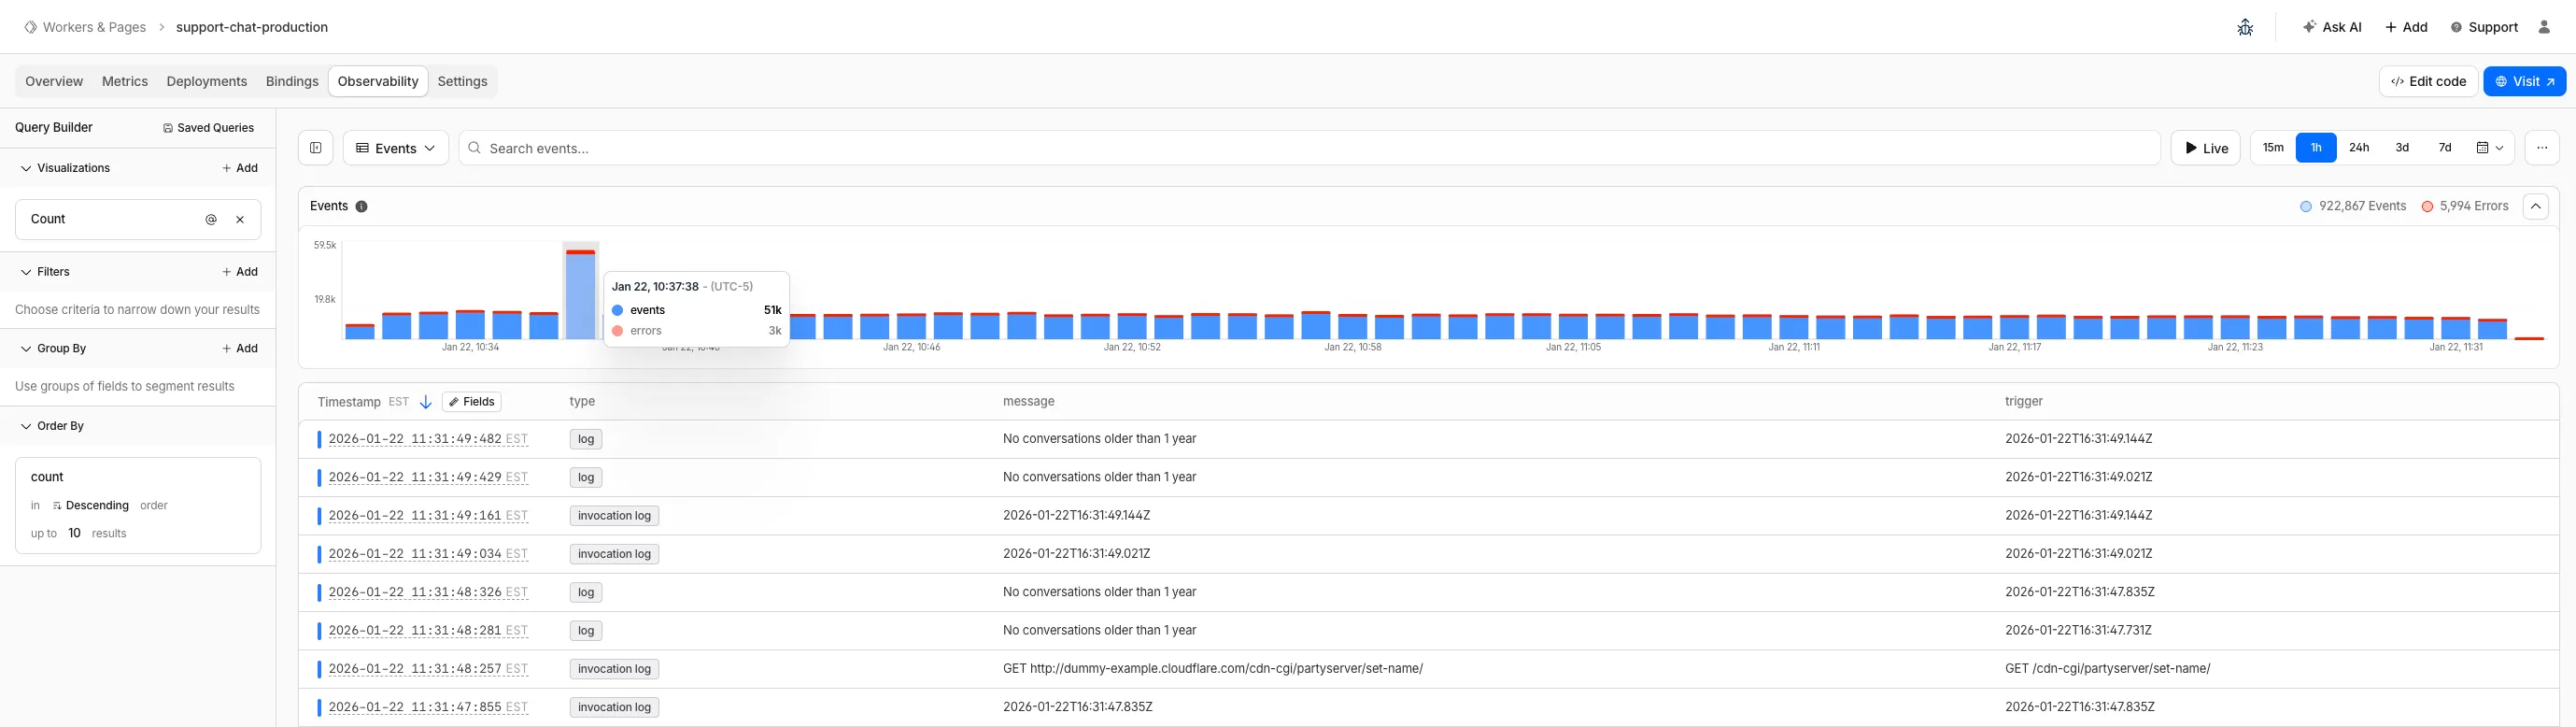
Access logs for your Worker from the Cloudflare dashboard:
-
In the Cloudflare dashboard, go to the Workers & Pages page.
Go to Workers & Pages -
In Overview, select your Worker.
-
Select Observability.
To get the most out of Workers Logs, it is recommended you log in JSON format. Workers Logs automatically extracts the fields and indexes them intelligently in the database. The benefit of this structured logging technique is in how it allows you to easily segment data across any dimension for fields with unlimited cardinality. Consider the following scenarios:
| Scenario | Logging Code | Event Log (Partial) |
|---|---|---|
| 1 | console.log("user_id: " + 123) | {message: "user_id: 123"} |
| 2 | console.log({user_id: 123}) | {user_id: 123} |
| 3 | console.log({user_id: 123, user_email: "a@example.com"}) | {user_id: 123, user_email: "a@example.com"} |
The difference between these examples is in how you index your logs to enable faster queries. In scenario 1, the user_id is embedded within a message. To find all logs relating to a particular user_id, you would have to run a text match. In scenarios 2 and 3, your logs can be filtered against the keys user_id and user_email.
Each Workers invocation returns a single invocation log that contains details such as the Request, Response, and related metadata. These invocation logs can be identified by the field $cloudflare.$metadata.type = "cf-worker-event". Each invocation log is enriched with information available to Cloudflare in the context of the invocation.
In the Workers Logs UI, logs are presented with a localized timestamp and a message. The message is dependent on the invocation handler. For example, Fetch requests will have a message describing the request method and the request URL, while cron events will be listed as cron. Below is a list of invocation handlers along with their invocation message.
Invocation logs can be disabled in wrangler by adding the invocation_logs = false configuration.
{ "observability": { "logs": { "invocation_logs": false } }}[observability.logs]invocation_logs = false| Invocation Handler | Invocation Message |
|---|---|
| Alarm | <Scheduled Time> |
| <Email Recipient> | |
| Fetch | <Method> <URL> |
| Queue | <Queue Name> |
| Cron | <UNIX-cron schedule> |
| Tail | tail |
| RPC | <RPC method> |
| WebSocket | <WebSocket Event Type> |
By default a Worker will emit invocation logs containing details about the request, response and related metadata.
You can also add custom logs throughout your code. Any console.log statements within your Worker will be visible in Workers Logs. The following example demonstrates a custom console.log within a Worker request handler.
export default {  async fetch(request) {    const { cf } = request;    const { city, country } = cf;
    console.log(`Request came from city: ${city} in country: ${country}`);
return new Response("Hello worker!", { headers: { "content-type": "text/plain" }, }); },};addEventListener("fetch", (event) => { event.respondWith(handleRequest(event.request));});
/** * Respond with hello worker text * @param {Request} request */async function handleRequest(request) { const { cf } = request; const { city, country } = cf;
console.log(`Request came from city: ${city} in country: ${country}`);
return new Response("Hello worker!", { headers: { "content-type": "text/plain" }, });}After you deploy the code above, view your Worker's logs in the dashboard or with real-time logs.
Head-based sampling allows you to log a percentage of incoming requests to your Cloudflare Worker. Especially for high-traffic applications, this helps reduce log volume and manage costs, while still providing meaningful insights into your application's performance. When you configure a head-based sampling rate, you can control the percentage of requests that get logged. All logs within the context of the request are collected.
To enable head-based sampling, set head_sampling_rate within the observability configuration. The valid range is from 0 to 1, where 0 indicates zero out of one hundred requests are logged, and 1 indicates every request is logged. If head_sampling_rate is unspecified, it is configured to a default value of 1 (100%). In the example below, head_sampling_rate is set to 0.01, which means one out of every one hundred requests is logged.
{ "observability": { "enabled": true, "head_sampling_rate": 0.01 // 1% sampling rate }}[observability]enabled = truehead_sampling_rate = 0.01| Description | Limit |
|---|---|
| Maximum log retention period | 7 Days |
| Maximum logs per account per day1 | 5 Billion |
| Maximum log size2 | 256 KB |
1 There is a daily limit of 5 billion logs per account per day. After the limit is exceed, a 1% head-based sample will be applied for the remainder of the day.
2 A single log has a maximum size limit of 256
KB. Logs exceeding that size will be
truncated and the log's $cloudflare.truncated field will be set to true.
Workers Logs is included in both the Free and Paid Workers plans.
| Log Events Written | Retention | |
|---|---|---|
| Workers Free | 200,000 per day | 3 Days |
| Workers Paid | 20 million included per month +$0.60 per additional million | 7 Days |
A Worker serves 15 million requests per month. Each request emits 1 invocation log and 1 console.log. head_sampling_rate is configured to 1.
| Monthly Costs | Formula | |
|---|---|---|
| Logs | $6.00 | ((15,000,000 requests per month * 2 logs per request * 100% sample) - 20,000,000 included logs) / 1,000,000 * $0.60 |
| Total | $6.00 |
A Worker serves 1 billion requests per month. Each request emits 1 invocation log and 1 console.log. head_sampling_rate is configured to 0.1.
| Monthly Costs | Formula | |
|---|---|---|
| Logs | $108.00 | ((1,000,000,000 requests per month * 2 logs per request * 10% sample) - 20,000,000 included logs) / 1,000,000 * $0.60 |
| Total | $108.00 |