Security Analytics
Security Analytics displays information about all incoming HTTP requests for your domain, including requests not handled by Cloudflare security products. This gives you visibility into your full traffic profile, not only the requests that triggered a security rule.
By default, Security Analytics shows requests from end users (requests to your site directly, as opposed to requests generated by Cloudflare products). Requests generated by Cloudflare Workers subrequests are not included.
Use the Security Analytics dashboard to:
- View the traffic distribution for your domain.
- Understand which traffic is being mitigated by Cloudflare security products, and where non-mitigated traffic is being served from (Cloudflare global network or origin server ↗).
- Analyze suspicious traffic and create tailored WAF custom rules based on applied filters.
- Review Cloudflare's security scores (attack score, bot score, malicious uploads, and leaked credentials results) with real data from your traffic.
- Find an appropriate rate limit for incoming traffic.
- Analyze suspicious traffic (new security dashboard only).
Security Analytics shows all traffic, whether or not Cloudflare acted on it. If you are looking for requests that Cloudflare security products acted on or flagged, refer to Security Events instead.
Zone/domain-level analytics are included with all plans, though the retention period, query window, displayed statistics, and filter options vary by plan. Account-level analytics are only available to customers on Business and Enterprise domain plans.
| Free | Pro | Business | Enterprise | |
|---|---|---|---|---|
Availability | Yes | Yes | Yes | Yes |
Historical time (data retention) | Up to the last 7 days | Up to the last 7 days | Up to the last 31 days | Up to the last 90 days |
Max query window | 24 hours | 7 days | 31 days | 31 days |
To use Security Analytics:
-
Log in to the Cloudflare dashboard ↗ and select your account.
-
Go to the account or zone/domain dashboard:
-
For the zone/domain dashboard, go to the Analytics page.
Go to Analytics -
For the account dashboard, go to the Security Analytics page.
Go to Security analytics
-
Adjust the scope of analytics by manually entering filter conditions. You can also select Filter or Exclude to filter by a field value. These buttons appear when you hover the analytics data legend.
To manually add a filter:
- Select Add filter.
- Select a field, an operator, and a value. For example, to filter events by source IP address, select the Source IP field, select the equals operator, and enter the IP address.
- Select Apply.
Take the following into account when entering filter values:
- Do not add quotes around values.
- Do not enter the
ASprefix when entering ASN numbers. For example, enter1423instead ofAS1423. - Wildcards are not supported.
Select the time frame you wish to analyze from the Previous 24 hours drop-down list.
To create a custom rule with an expression based on the filters you applied in Security Analytics, select Create custom security rule above the main chart.
The new security dashboard and the old dashboard have a few differences, including the order of the various sections on the Security Analytics page.
The suspicious activity section gives you information about suspicious requests that were identified by the Cloudflare detections you have enabled. The supported detections include:
- Account takeover
- Leaked credential check (only for user and password leaked)
- Malicious uploads
- WAF attack score
- AI Security for Apps
Each suspicious activity is classified with a severity score that can vary from critical to low. You can use the filter option to investigate further.
The main chart displays the following data for the selected time frame, according to the selected tab:
-
Traffic analysis: Traffic mitigated by the Cloudflare security platform, served by Cloudflare, and served by the origin server, according to the following classification:
- Mitigated by WAF: Requests blocked or challenged by Cloudflare's application security products such as the WAF and HTTP DDoS protection. Requests with Log, Skip, or Allow actions are not counted as mitigated.
- Served by Cloudflare: Requests served by the Cloudflare global network such as cached content and redirects.
- Served by origin: Requests served by your origin server.
-
Attack analysis: WAF attack score analysis of incoming requests, classifying them as Clean, Likely clean, Likely attack, or Attack.
-
Bot analysis: Bot score analysis of incoming requests, classifying them as Automated, Likely automated, Likely human, or Verified bot.
-
Request rate analysis: Displays data on the request rate for traffic matching the selected filters and time period. Use this tab to find an appropriate rate limit for incoming traffic matching the applied filters.
-
Cloudy analysis (beta): Get insights about your application security by using plain language to interrogate your data. For more information, refer to our blog post ↗.
This section presents top statistics about incoming requests highlighting relevant properties commonly used when performing a security analysis.
You can filter or exclude some of the top values by selecting Filter or Exclude next to each value.
To display additional top statistics, select More top statistics.
The provided insights show statistics for commonly used filters when doing security analyses, without immediately applying these filters to the displayed data.
If you find a high value in one or more insights, this can mean that there is a set of suspicious requests that you should investigate. Additionally, these insights are a good starting point for applying a first set of filters to the dashboard.
To apply the filters for an insight to the data displayed in the Security Analytics dashboard, select Filter next to the insight.
The Attack analysis, Bot analysis, Malicious uploads, and Account abuse detection sections display statistics related to Cloudflare's security scores for incoming requests in the selected time frame:
- Attack analysis: Uses WAF attack scores to classify requests based on the likelihood that the request is malicious.
- Bot analysis: Uses bot scores to classify requests based on the likelihood they come from automated traffic.
- Malicious uploads: Uses WAF content scanning scores to detect potentially malicious content uploaded in requests.
- Account abuse detection: Uses leaked credentials detection to identify login attempts with credentials that have been exposed in data breaches. All plans include access to the Leaked credential check under this section. For more information on what to do if you have leaked credentials, refer to Example mitigation rules.
You can examine different traffic segments according to the current metric (attack score, bot score, or content scanning). To apply score filters for different segments, select the buttons below the traffic chart. For example, select Likely attack under Attack analysis to filter requests that are likely an attack (requests with WAF attack score values between 21 and 50).
Additionally, you can use the slider tool below the chart to filter incoming requests according to the current metric. This allows you to filter traffic groups outside the predefined segments.
Security Analytics shows request logs for the selected time frame and applied filters, along with detailed information and security analyses of those requests.
By default, Security Analytics uses sampled logs (a subset of your traffic rather than every individual request). Sampling allows Cloudflare to return results in seconds, even when query volumes are large. If you are subscribed to Log Explorer, you may also have access to raw logs.
This section contains detailed log information for individual (sampled) requests in the selected time frame.
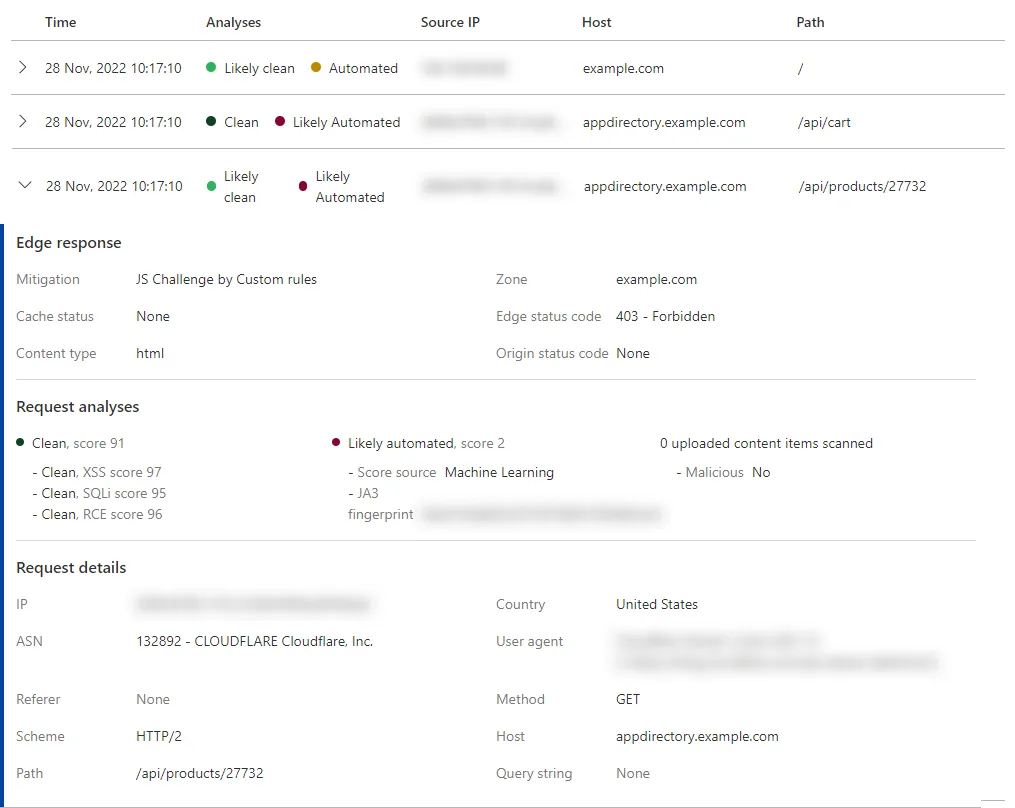
The displayed information includes:
- Mitigation action applied to the request
- Cache status
- Status code returned by the origin server to Cloudflare (in case of a cache miss)
- Status code returned by Cloudflare to the client
- Security scores for the request (attack, bot, uploaded content scanning)
- Request properties
When performing a forensic analysis, you sometimes select a very short time frame and apply several filters to identify a specific set of requests. In this situation, to get a better understanding of the incoming requests at a given point in time, you would require the full list of requests and not just a sample.
By default, Security Analytics shows sampled logs based on the filters you apply. Under certain conditions, you can switch to Raw logs. This view shows all the request logs for the selected time frame and filters instead of sampled logs. At this time, this view is only available when the number of sampled logs shown in the Security Analytics page is lower than 100.
To switch from sampled logs to raw logs, select Switch to raw logs under Sampled logs. This option is only available when the number of (sampled) logs for the selected time frame is lower than 100.
To switch from raw logs back to sampled logs, select Switch back to sampled logs.
You can switch to Log Explorer to dive deeper on your analysis while applying the same filters you used in Security Analytics. Raw logs in Security Analytics are based on the same data source used in Log Explorer.
The Security Analytics dashboard uses sampled data, except when showing raw logs.
If you query Security Analytics data through the GraphQL Analytics API, the primary underlying datasets are httpRequestsAdaptiveGroups and httpRequestsAdaptive. For more information, refer to Datasets (tables).
The data retention (historical time) and maximum query window of the datasets supporting Security Analytics differ from the dataset that powers Security Events.
The following tables show the different limits per Cloudflare plan:
| Data retention (historical time) for... | Free | Pro | Business | Enterprise |
|---|---|---|---|---|
Security Events (firewallEventsAdaptive) | 24 hours | 24 hours | 3 days | 30 days |
Security Analytics (httpRequestsAdaptive) | 7 days | 7 days | 31 days | 90 days |
| Maximum query window for... | Free | Pro | Business | Enterprise |
|---|---|---|---|---|
Security Events (firewallEventsAdaptive) | 24 hours | 24 hours | 3 days | 31 days |
Security Analytics (httpRequestsAdaptive) | 24 hours | 7 days | 31 days | 31 days |