Security Events
Security Events allows you to review mitigated requests and helps you tailor your security configurations. Use Security Events to investigate requests that Cloudflare security products acted on or flagged, identify false positives, and fine-tune your security rules.
If you want to analyze all incoming traffic, including requests that Cloudflare did not act on, refer to Security Analytics instead.
The main elements of the dashboard are the following:
- Events summary: Provides the number of security events on traffic during the selected time period, grouped according to the selected dimension (for example, Action, Host, Country).
- Events by service: Lists the security-related activity per security feature (for example, WAF, API Shield).
- Top events by source: Provides details of the traffic flagged or actioned by a Cloudflare security feature (for example, IP addresses, User Agents, Paths, Countries, Hosts, ASNs).
- Sampled logs: Summarizes security events by date to show the action taken and the applied Cloudflare security product.
Security Events displays information about requests actioned or flagged by Cloudflare security products, including features such as Browser Integrity Check. A single HTTP request can generate one or more security events when it triggers security features. The Security Events dashboard shows these individual events, not the HTTP requests themselves.
Available features vary according to your Cloudflare plan:
| Free | Pro | Business | Enterprise | |
|---|---|---|---|---|
Availability | Yes | Yes | Yes | Yes |
Dashboard features | Sampled logs only | All | All | All |
Account-level dashboard | No | No | No | Yes |
Historical time (data retention) | Up to the last 24 hours | Up to the last 24 hours | Up to the last 3 days | Up to the last 30 days |
Max query window | 24 hours | 24 hours | 3 days | 31 days |
Export report | No | No | Up to 500 events | Up to 500 events |
Print report | No | Yes | Yes | Yes |
To open Security Events for a given zone:
-
In the Cloudflare dashboard, go to the Analytics page.
Go to Analytics -
Select the Events tab.
- In the Cloudflare dashboard, go to Security > Events.
Additionally, Enterprise customers have access to the account-level dashboard:
Go to Security eventsYou can apply multiple filters and exclusions to narrow the scope of Security Events and adjust the report duration. Modifying the duration, filters, or exclusions affects the analytics data displayed on the entire page including Sampled logs and all graphs.
You can adjust the scope of analytics by manually entering filter conditions. Alternatively, select Filter or Exclude to filter by a field value. These buttons appear when you hover the analytics data legend.
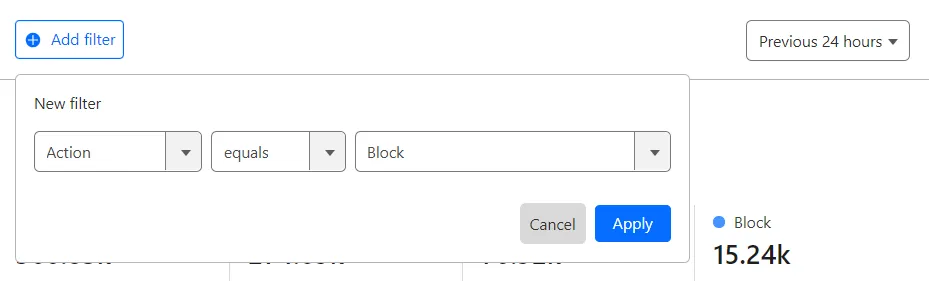
To manually add a filter:
- Select Add filter.
- Select a field, an operator, and a value. For example, to filter events by IP address, select IP for the field, select equals for the operator, and enter the IP address.
- Select Apply.
Take the following into account when entering filter values:
- Do not add quotes around values.
- Do not enter the
ASprefix when entering ASN numbers. For example, enter1423instead ofAS1423. - Wildcards are not supported.
To adjust report duration, select the desired duration from the dropdown. The default value is Last 24 hours.
The available report duration values depend on your Cloudflare plan. Refer to Availability for details.
To create a custom rule based on your current filters and exclusions:
- Old dashboard: Select Create custom rule.
- New security dashboard: Select Create custom security rule.
The Events summary section provides the number of security events on traffic during the selected time period, grouped according to the selected dimension (for example, Action, Host, Country, or ASN).
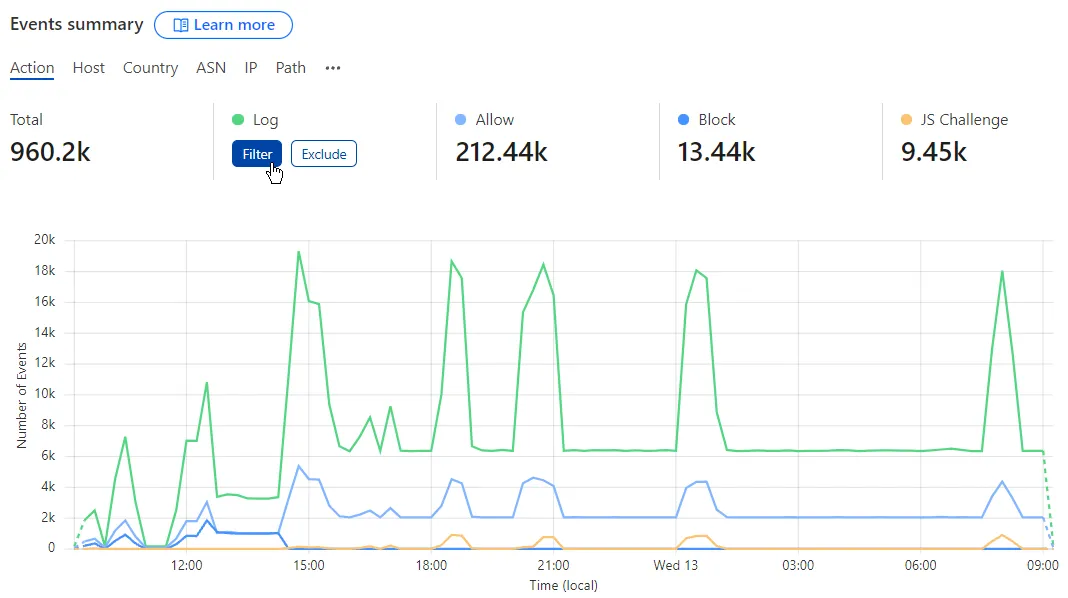
You can adjust the displayed data according to one of the values by selecting Filter or Exclude when hovering the legend.
The Events by service section lists the activity per Cloudflare security feature (for example, Managed rules or Rate limiting rules).
You can adjust the scope of Security Events to one of the displayed services by selecting Filter or Exclude when hovering the legend or by selecting the corresponding graph bar.
In Top events by source you can find details of the traffic flagged or actioned by a security feature — for example, IP Addresses, User Agents, Paths, and Countries.
You can adjust the scope of Security Events to one of the listed source values by selecting Filter or Exclude when hovering the value.
Sampled logs shows a subset of security events for the selected time period, listed by date with the action taken and the applied Cloudflare security feature. For large volumes of traffic, Cloudflare uses sampling to return results faster. This means that not every individual event may appear in the list.
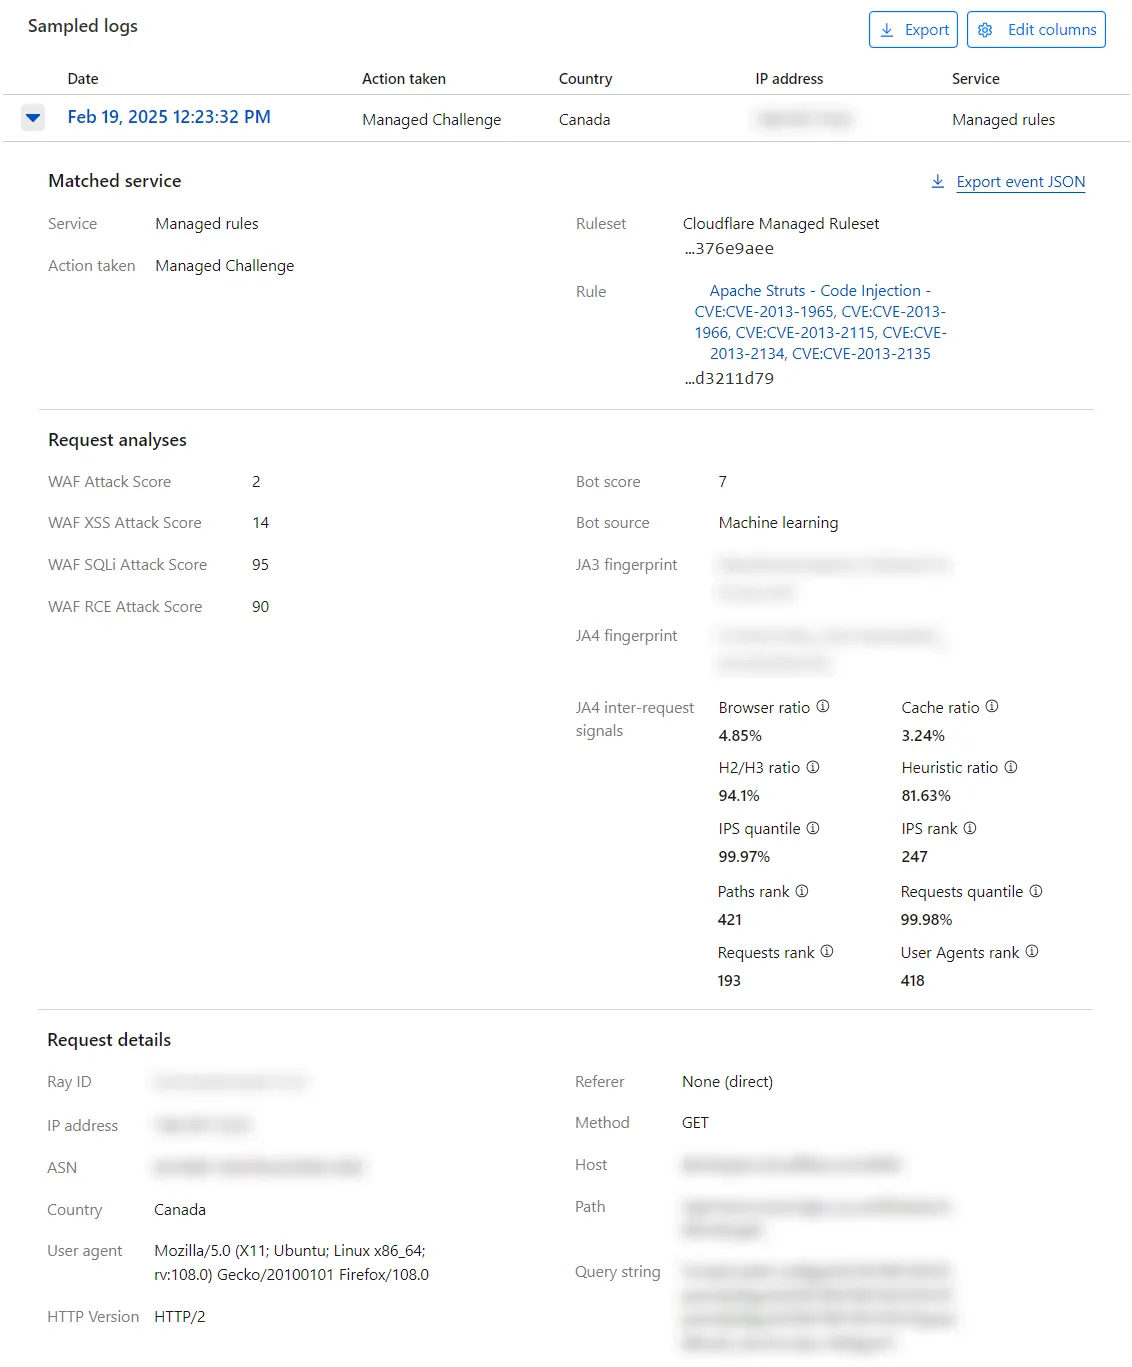
Security events are shown by individual event rather than by request. For example, if a single request triggers three different security features, the security events will show three individual events in Sampled logs.
Expand each event to check its details, and define filters and exclusions based on the event's field values. Select the Filter or Exclude button when hovering a field to add the field value to the filters or exclusions list of the displayed analytics. To download the event data in JSON format, select Export event JSON.
To configure the columns displayed in Sampled logs, select Edit columns. This gives you flexibility depending on the type of analysis that you need to perform.
For example, if you are diagnosing a bot-related issue, you may want to display the User agent and the Country columns. On the other hand, if you are trying to identify a DDoS attack, you may want to display the IP address, ASN, and Path columns.
For details on most actions that appear in Sampled logs, refer to Actions.
Besides the actions you can select when configuring rules in Cloudflare security products, you may also find events with the following associated actions:
- Connection Close
- Force Connection Close
For details on these actions, refer to HTTP DDoS Attack Protection parameters.
The Managed Challenge action that may appear in Sampled logs is available in the following security features and products: WAF custom rules, rate limiting rules, Bot Fight Mode, IP Access rules, User Agent Blocking rules, and firewall rules (deprecated).
You can export a set of up to 500 raw events from Sampled logs in JSON format. Export event data to combine and analyze Cloudflare data with your own stored in a separate system or database, such as a SIEM system. The data you export will reflect any filters you have applied.
To export the displayed events (up to 500), select Export in Sampled logs.
When you add a filter and specify a report duration (time window) in Security Events, the Cloudflare dashboard URL changes to reflect the parameters you configured. You can share that URL with other users so that they can analyze the same information that you see.
For example, after adding a filter for Action equals Managed Challenge and setting the report duration to Last 3 days, the URL should look like the following:
https://dash.cloudflare.com/{account_id}/example.net/security/analytics/events?action=managed_challenge&time-window=4320
To print or download a snapshot report:
- Old dashboard: Select Print report.
- New security dashboard: Select the three dots > Print report.
Your web browser's printing interface will present you with options for printing or downloading the PDF report.
The generated report will reflect all applied filters.
Security Events currently has these limitations:
-
Security Events may use sampled data to improve performance. Refer to Sampling for more information.
-
The Cloudflare dashboard may show an inaccurate number of events per page. Data queries are highly optimized, but this means that pagination may not always work because the source data may have been sampled. The GraphQL Analytics API does not have this pagination issue.
-
Triggered OWASP rules appear in the Security Events page under Additional logs, but they are not included in exported JSON files.
Security Events may use sampled data. If your search uses sampled data, Security Events might not display all events and filters might not return the expected results. To display more events, select a smaller time frame (a narrower time range reduces the volume of data, which reduces or eliminates sampling).
If you query Security Events data through the GraphQL Analytics API, the underlying dataset is firewallEventsAdaptive. For more information, refer to Datasets (tables).
For more information on querying the firewallEventsAdaptive dataset, refer to Querying Firewall Events with GraphQL.
The retention and query window for the firewallEventsAdaptive dataset differ from the datasets that power Security Analytics.
The following tables show the different limits per Cloudflare plan:
| Data retention (historical time) for... | Free | Pro | Business | Enterprise |
|---|---|---|---|---|
Security Events (firewallEventsAdaptive) | 24 hours | 24 hours | 3 days | 30 days |
Security Analytics (httpRequestsAdaptive) | 7 days | 7 days | 31 days | 90 days |
| Maximum query window for... | Free | Pro | Business | Enterprise |
|---|---|---|---|---|
Security Events (firewallEventsAdaptive) | 24 hours | 24 hours | 3 days | 31 days |
Security Analytics (httpRequestsAdaptive) | 24 hours | 7 days | 31 days | 31 days |