Cloudflare Drop ↗ lets you deploy a static site to Cloudflare without requiring a Cloudflare account to get started.
Upload a folder or zip file of static assets (static HTML, CSS, JavaScript, images, and fonts) and get a temporary live preview that stays live for 1 hour. During that window, you can test the site, share the preview URL, or claim the deployment to keep it.
When you are ready to make the deployment permanent, click Claim to sign in or create a Cloudflare account. You can claim the site into an existing Cloudflare account or create a new account for the deployment.
After claiming the site, you can:
Add a domain: Connect an existing domain or purchase a new one for your site.
Enable observability: Monitor your site's performance and usage.
Enable Markdown for Agents: Allow AI agents to access your site's content in Markdown.
Control access: Make your site private and choose who can view it.
Workflows pricing now includes per-step billing. Requests and CPU time billing have been enabled since the initial public beta and is not changing.
Workflows adds step billing
A step is each unit of work executed by a Workflow, including step operations such as sleeping or waiting for events.
You can query Workflows analytics, including stepCount for a Workflow instance, with the GraphQL Analytics API.
Steps and storage billing to take effect August 10th, 2026
Starting no earlier than August 10th, 2026, Cloudflare will begin billing for step and storage usage on Workers Paid plans.
Storage pricing has been published since Workflows became generally available and is not changing. Storage is measured as persisted Workflow state in GB-months.
Dimension
Workers Free
Workers Paid
Steps
3,000 included per day
500,000 included per month, then $0.80 per additional 100,000 steps
Storage
1 GB-month included
1 GB-month included, then $0.20 per additional GB-month
Developers on the Workers Free plan will not be charged for steps or storage beyond the included amounts.
Cloudflare will not bill step and storage usage before August 10, 2026.
You can review Workflows usage in the Cloudflare dashboard ↗ before this change takes effect. To reduce costs, consider reducing the number of steps per Workflow or improving the memory efficiency of your stored state.
Browser Run now supports a standalone /accessibilityTree endpoint, giving agent and automation workflows direct access to the browser's accessibility tree for a rendered webpage.
An accessibility tree is the browser's structured view of a rendered page: roles, names, states, values, and hierarchy. It is useful for accessibility tooling, but also for AI agents and automation workflows that need page structure without the noise of raw HTML or the cost of screenshots.
For AI agents, this means less inference from pixels and less parsing HTML. You can provide the page structure directly, helping agents identify available elements and determine which actions they can take.
With the new /accessibilityTree endpoint, you can request the accessibility tree directly when you only need the semantic structure of a page. If you need multiple page formats in a single API call, you can use the /snapshot endpoint, which also returns Markdown, HTML, and screenshots.
R2 Data Catalog is a managed Apache Iceberg ↗ catalog built directly into your R2 bucket. Iceberg tracks your data through a tree of metadata files, so every insert, update, and delete must go through a catalog transaction. Manually adding, modifying, or deleting objects outside the catalog can leave pointers referencing files that no longer exist, corrupting the table into an inconsistent state that is difficult to recover from.
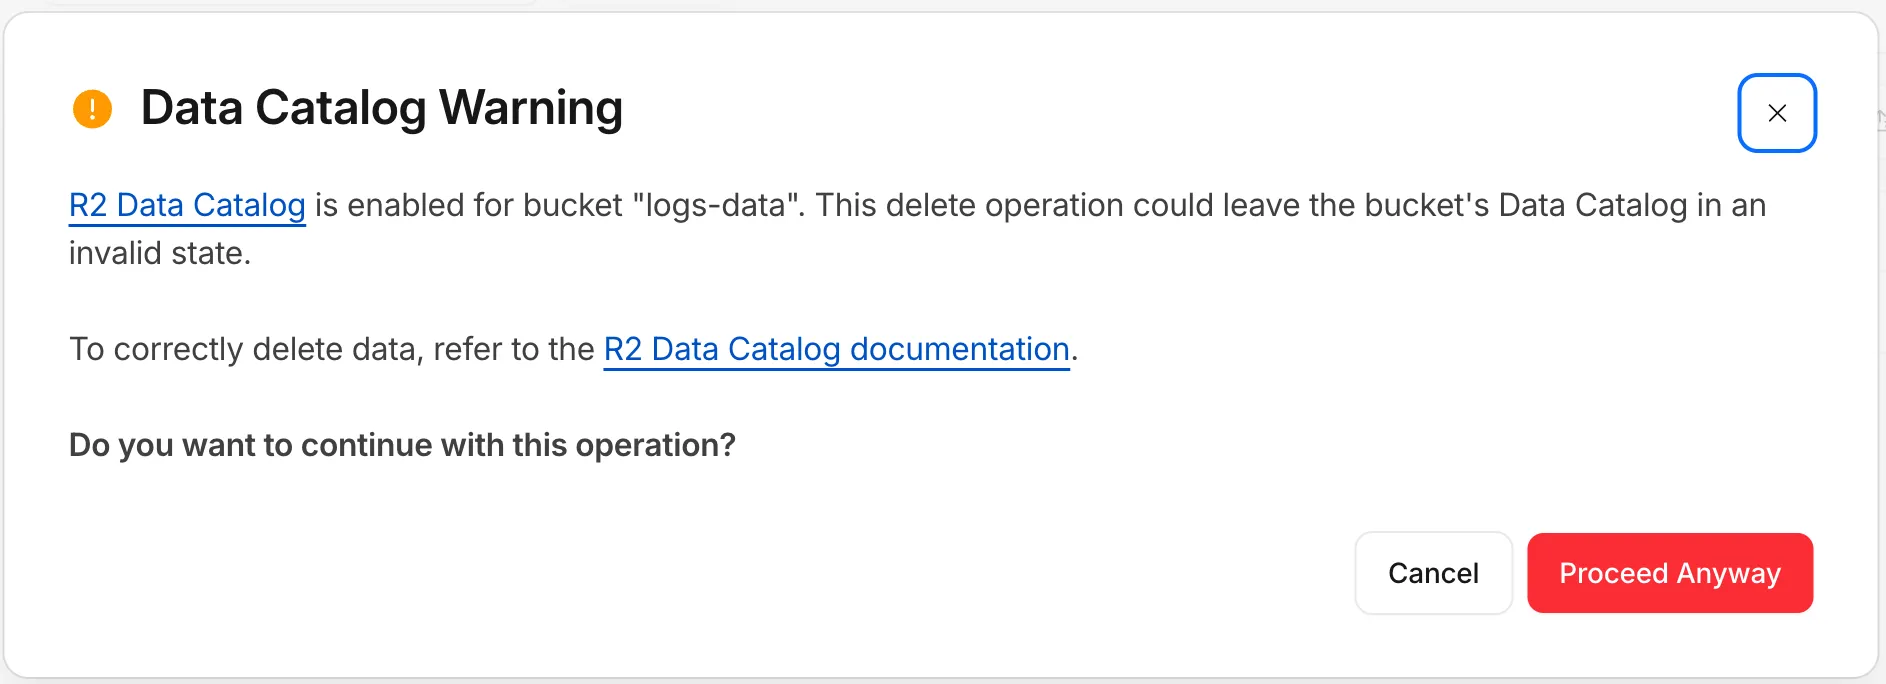
To help prevent this, the R2 dashboard and Wrangler now warn you when you attempt a manual delete operation on a Data Catalog-enabled bucket.
Dashboard
When you try to delete objects from a bucket that has R2 Data Catalog enabled, the dashboard displays a warning explaining that the operation could leave the catalog in an invalid state, with a link to the documentation for deleting data correctly. You can cancel the operation or choose to proceed anyway.
Wrangler
Wrangler now checks whether a bucket is Data Catalog-enabled before running a delete and warns you before continuing:
Data Catalog is enabled for this bucket.
Proceeding may leave the data catalog in an invalid state. Continue?
A new declarative exports field in your Wrangler configuration file replaces the imperative migrations array for managing Durable Object class lifecycle. Instead of writing an ordered list of migration steps with unique tags, you declare each Durable Object class your Worker exports and Cloudflare compares that against what's already deployed to determine what Durable Object state needs to be created, renamed, or deleted.
With legacy migrations, renaming ChatRoom to Room requires retaining both tagged steps:
Each entry is keyed by class name. The state field carries the lifecycle (created by default — a live class — plus tombstone states deleted, renamed, and transferred, and the expecting-transfer receiving state for cross-Worker transfers).
Key improvements over the legacy migrations array:
No migration tags. The current exports map is the source of truth — there is no historical chain of v1, v2, v3 entries to maintain.
Structured deployment output. Wrangler reports when it creates, updates, deletes, renames, or transfers Durable Object classes. It also identifies stale configuration entries that are safe to remove. Deployments with no changes or notices do not print this output.
Zero-downtime rename and transfer patterns are first-class. Tombstones may coexist with the source class still in code, enabling a three-deploy rename and a four-deploy cross-Worker transfer without runtime errors during the rollout window.
Cross-Worker safety. When you delete or rename a class, Cloudflare lists every other Worker in your account whose bindings still reference the namespace, so you can redeploy them before the change goes live.
Existing Workers using the legacy migrations array continue to work unchanged. To move to exports, refer to the migration guide. exports and migrations are mutually exclusive within a single Worker.
We have released version 5 of @cloudflare/workers-types ↗. This release simplifies the package to expose only the latest runtime types.
We still recommend that you generate types for your Worker using wrangler types, but if you want to use the package directly, you can install it with your package manager of choice:
npm i -D @cloudflare/workers-types@latest
yarn add -D @cloudflare/workers-types@latest
pnpm add -D @cloudflare/workers-types@latest
bun add -d @cloudflare/workers-types@latest
The package now exposes two entrypoints:
@cloudflare/workers-types reflects the latest compatibility date, using the latest stable compatibility flags.
The dated entrypoints, such as @cloudflare/workers-types/2022-11-30 and @cloudflare/workers-types/2023-03-01, are removed. With runtime type generation in Wrangler v4, you can generate these with the wrangler types command to create types locked to your Worker's compatibility date.
When you connect a data source to your AI Search instance, AI Search runs sync jobs to keep your index up to date with your content. You can now manage those jobs directly from Wrangler.
For example, you can trigger a sync job from your CI/CD or automated pipelines with the jobs create command so your index refreshes when you push a change:
wrangler ai-search jobs create my-instance
This creates an asynchronous sync job that checks for changes in your data source, and sends new, modified, or deleted files to be indexed.
The following commands are available:
Command
Description
wrangler ai-search jobs create
Trigger a new sync job
wrangler ai-search jobs list
List sync jobs for an instance
wrangler ai-search jobs get
Get details for a job
wrangler ai-search jobs cancel
Cancel a running job
wrangler ai-search jobs logs
View log entries for a job
All commands accept --namespace/-n (defaults to default) and --json for structured output that automation and AI agents can parse directly. The list and logs commands also support --page and --per-page for pagination, and cancel prompts for confirmation unless you pass -y/--force.
Wrangler CLI now supports auth profiles: named logins that you scope to specific Cloudflare accounts and switch between automatically, based on the directory you are working in.
A profile is a named OAuth login bound to a directory. Commands run in that directory, and its subdirectories, use the matching account — so you can move between accounts without re-running wrangler login.
Use profiles to keep a separate login for each client when working at an agency, or to separate staging and production into different accounts. Pair a profile with an account_id in your Wrangler configuration file so a command cannot reach the wrong account.
# Create a profile for each account, choosing which accounts it can reachwrangler auth create client-awrangler auth activate client-a ~/clients/client-awrangler auth create client-bwrangler auth activate client-b ~/clients/client-b
Use the --profile flag to run a single command with a specific profile:
wrangler deploy --profile personal
In CI and other automated environments, CLOUDFLARE_API_TOKEN still takes precedence over all profiles.
For setup, the resolution order, and the full command reference, refer to Authentication profiles.
Containers now support Google Artifact Registry ↗ images. After you configure credentials, you can use a fully qualified Google Artifact Registry image reference in your Wrangler configuration instead of first pushing the image to Cloudflare Registry.
Provide the service account email with --gar-email and pipe the service account JSON key through stdin:
The Images binding is now billed per unique transformation, matching the model already used for URL-based transformations. Repeat requests for the same combination of source image and parameters within the same calendar month are counted only once.
Previously, every call to the binding counted as a separate transformation regardless of whether the image or parameters were unique. With this change, you can call the binding on hot paths without paying for each individual request.
We have greatly improved the throughput of the Vectorize write-ahead log (WAL) ↗. As a result, we have significantly reduced the end-to-end latency for a vector change to become queryable: median latency has dropped from 2 minutes to under 30 seconds, and p99 latency from 5 minutes to under 2 minutes.
This means inserts, upserts, and deletes are reflected in query results faster, improving the freshness of semantic search, recommendation, and retrieval-augmented generation (RAG) workloads. You do not need to change your code or configuration to benefit from this improvement.
You can now monitor how much memory your Workers and Durable Objects consume across invocations with the new Memory Usage chart in the Workers Metrics tab, broken down by P50, P90, P99, and P999 percentiles.
Memory usage measures the V8 isolate memory at the time of each invocation, subject to the 128 MB per-isolate limit — a single isolate can handle many concurrent requests and shares memory across them.
Use the Memory Usage chart to:
Track memory trends — Spot gradual increases that may indicate a memory leak before they cause Exceeded Memory errors.
Correlate with deployments — Deployment markers on the chart help you identify whether a new version introduced a memory regression.
Right-size your Worker — Understand your baseline memory footprint and how much headroom you have before hitting the 128 MB limit.
For Durable Objects, memory usage reflects the in-memory state an object holds (class properties, caches, active WebSocket connections), which persists across invocations until the object is hibernated or evicted. This state is not preserved across eviction, hibernation, or a crash, so persist anything important to storage.
To view memory usage, open the Metrics tab for your Worker ↗ or Durable Object namespace ↗. For Durable Objects, you can filter by DO ID or name to drill down into memory usage for a specific object. You can also query memory usage programmatically via the GraphQL Analytics API using the workersInvocationsAdaptive dataset — the quantiles.memoryUsageBytesP50 through quantiles.memoryUsageBytesP999 fields return percentile values in bytes.
For local memory debugging, you can also profile memory with DevTools to take heap snapshots and identify specific objects causing high memory usage.
Workers fetch() requests now support the cf.vary request option. Use cf.vary to control how Cloudflare caches origin responses with a Vary header for a single subrequest.
The latest release of the Agents SDK ↗ makes it easier to run long work in the background, drive turns through one entry point, and keep chat agents working through deploys, evictions, and reconnects.
This release adds first-class detached (background) sub-agent runs with live progress and durable milestones, a single runTurn turn-admission entry point, and a large round of recovery and reliability fixes that continue converging @cloudflare/think and @cloudflare/ai-chat onto one model.
Background sub-agents with progress and milestones
runAgentTool can now dispatch a sub-agent without blocking the calling turn. A detached run returns a handle immediately and is owned by a durable, eviction-surviving backbone instead of being abandoned when the dispatching turn ends.
Durable, exactly-once-on-the-happy-path completion via a warm fast path plus a self-scheduling reconcile backbone that survives eviction and deploys.
Bounded. An absolute maxBudgetMs ceiling (default 24h) and cancelAgentTool(runId) keep abandoned runs from holding a concurrency slot forever.
detached: { notify: true } lets a finished background run inject a message back into the chat so the model reacts to the result — no hand-wired onFinish needed.
Sub-agents can also report mid-run progress that rides their own turn stream back to the parent's connected clients:
// Inside the child sub-agent:await this.reportProgress({ fraction: 0.6, phase: "deploying", message: "Generating menu page…",});
// Inside the child sub-agent:await this.reportProgress({ fraction: 0.6, phase: "deploying", message: "Generating menu page…",});
Progress surfaces on AgentToolRunState.progress via useAgentToolEvents, so a background-runs tray can render a live bar without drilling in, and the latest snapshot is persisted for inspection after eviction. Naming a milestone promotes a signal to a durable, replayable row, and detached: { onMilestones } can surface a milestone as a synthetic chat message ("narrate" for a cheap status line, or "react" to drive a model turn).
One entry point for turns: runTurn
@cloudflare/think adds a public runTurn(options) facade that unifies turn admission behind a single mode:
stream mode accepts array and function inputs to match wait mode, and all entry points now route through a shared internal admission path that throws a clear error on nested blocking admissions that previously could deadlock.
Recovery and reliability
A large part of this release continues hardening recovery and converging @cloudflare/think and @cloudflare/ai-chat onto one model:
Stream stall watchdog.AIChatAgent can detect and recover from a hung model/transport stream via the opt-in chatStreamStallTimeoutMs watchdog. With chatRecovery enabled the stall routes into the same bounded-recovery machinery a deploy or eviction uses; otherwise it surfaces as a terminal stream error so the spinner clears.
Interrupted tool-call repair.AIChatAgent now repairs a transcript with a dead server-tool call before re-entering inference (parity with @cloudflare/think), so a recovered turn no longer fails with AI_MissingToolResultsError. An overridable repairInterruptedToolPart(part) hook lets apps customize the repaired shape.
Stuck status after reconnect. Fixed AI SDK status getting stuck when a reconnect races a turn that has been accepted but has not started streaming yet, so the UI now renders the in-flight turn instead of settling on ready.
Live "recovering…" on connect.AIChatAgent now replays the recovering status to a client that connects mid-recovery, so useAgentChat's isRecovering reflects in-progress recovery immediately instead of appearing frozen.
Terminal connection failures. The client stops reconnecting on terminal WebSocket close events and exposes them via connectionError / onConnectionError on AgentClient, useAgent, and useAgentChat.
Agent-tool child recovery. A healthy long-running sub-agent run is no longer abandoned as interrupted after a deploy (both @cloudflare/think and AIChatAgent).
Workflows from sub-agent facets. Agent Workflows can now start from sub-agent facets, with callbacks and Workflow RPC routed back to the originating facet.
Plus forward-progress crediting convergence, broadcast-first give-up ordering, an event-driven auto-continuation barrier, and structured row-size compaction in AIChatAgent.
Other improvements
Shared chat React core. A new agents/chat/react entry exposes useAgentChat, transport helpers, and shared wire types, with syncMessagesToServer for server-authoritative transcript storage. @cloudflare/think/react and @cloudflare/ai-chat/react are now thin wrappers over it.
Optional ai peer. The root agents and @cloudflare/codemode runtimes no longer reference AI SDK types, so they bundle without ai / zod installed; AI-specific entry points still require the peer when imported. just-bash likewise moves to an optional peer used only by the skills bash runner.
Code Mode. The default DynamicWorkerExecutor timeout increases from 30s to 60s, executions now dispose the dynamically-loaded Worker and its RPC stub after each run (fixing a flaky isolate-shutdown assertion), connector imports are cleaned up, and the outer MCP tool-call context is passed to openApiMcpServer request callbacks.
Voice. Voice turns now support AI SDK fullStream responses (and warn when textStream is used).
MCP.McpAgent server-to-client requests can now be sent from callbacks that do not inherit the agent's async context, including callbacks reached through Worker Loader RPC.
Experimental: server actions and channels. This release lays groundwork for guarded server actions (action() / getActions() with a durable replay ledger and approvals) and a unified channels surface (configureChannels(), deliverNotice()). Both are experimental and their APIs may change, so we don't recommend depending on them yet.
Upgrade
To update to the latest version:
npm i agents@latest @cloudflare/think@latest @cloudflare/ai-chat@latest @cloudflare/codemode@latest @cloudflare/voice@latest
Durable Objects now supports a usjurisdiction, letting you create Durable Objects that only run and store data within the United States. Use the us jurisdiction when you need to keep a Durable Object's compute and storage inside the United States to meet data residency requirements.
Create a namespace restricted to the us jurisdiction the same way as any other jurisdiction:
Workers may still access Durable Objects constrained to the us jurisdiction from anywhere in the world. The jurisdiction constraint only controls where the Durable Object itself runs and persists data.
The @cloudflare/vitest-pool-workers package now includes evictDurableObject and evictAllDurableObjects test helpers, exported from cloudflare:test.
These helpers let you test how a Durable Object behaves across evictions, simulating the production lifecycle where an idle Durable Object can be evicted from memory.
import { evictDurableObject, evictAllDurableObjects } from "cloudflare:test";import { env } from "cloudflare:workers";const id = env.COUNTER.idFromName("my-counter");const stub = env.COUNTER.get(id);// Evict the Durable Object instance pointed to by a specific stubawait evictDurableObject(stub);// Close WebSockets instead of hibernating themawait evictDurableObject(stub, { webSockets: "close" });// Evict all currently-running Durable Objects in evictable namespacesawait evictAllDurableObjects();
These helpers are available in @cloudflare/vitest-pool-workers@0.16.20 and later.
AI Search now gives you more control over similarity cache freshness. Similarity cache helps reduce latency and inference cost by reusing responses for semantically similar queries.
With these updates, you can choose how long responses are eligible for reuse and clear cached responses when they may be stale.
Cache duration now defaults to 48 hours
Previously, AI Search cached responses for a fixed duration of 30 days. Cached responses now use the instance's cache_ttl setting, and the default is 48 hours.
You can set cache_ttl when creating or updating an instance to choose a cache duration from 10 minutes to 6 days.
Use a shorter TTL when your source content changes frequently and freshness is more important. Use a longer TTL when your content is stable and you want more cache reuse.
For example, set cache_ttl to 518400 to retain cached responses for 6 days:
{ "cache_ttl": 518400}
Purge cached responses
You can also purge all cached responses for an instance on demand. Purging cached responses does not delete indexed content or source files.
It prevents AI Search from reusing previous cached responses, so subsequent similar queries generate fresh answers and repopulate the cache.
curl -X POST "https://api.cloudflare.com/client/v4/accounts/$ACCOUNT_ID/ai-search/instances/$INSTANCE_NAME/purge_cache" \
  -H "Authorization: Bearer $CLOUDFLARE_API_TOKEN"
You can also purge cached responses from the instance settings page in the Cloudflare dashboard.
Refer to similarity cache for the full list of supported cache_ttl values and more details about cache behavior.
Workflows makes it easier to build reliable multi-step applications that can recover when downstream systems fail. Rollback handlers now receive the original step context via a ctx object for the step being rolled back. This includes ctx.step.name, ctx.step.count, ctx.attempt, and the step config with defaults applied.
The step configuration includes the retry and timeout settings used for that step, so you can customize your step recovery logic according to those fields.
await step.do( "create charge", async () => { const charge = await createCharge(); return { chargeId: charge.id }; }, { rollback: async ({ ctx, output, error }) => { // `output` is the value returned by the step being rolled back. const { chargeId } = output as { chargeId: string }; await refundCharge(chargeId, { // `ctx` is the original step context, including step name, count, attempt, and config. reason: `${ctx.step.name}: ${error.message}`, }); }, rollbackConfig: { // `rollbackConfig` controls retries and timeout for the rollback handler. retries: { limit: 3, delay: "30 seconds", backoff: "linear" }, timeout: "5 minutes", }, },);
Regional Services now supports Regionalized IP Bindings, letting you regionalize traffic at the IP layer for prefixes you bring to Cloudflare through Bring Your Own IP (BYOIP).
Where Regional Hostnames regionalize traffic by hostname, Regionalized IP Bindings let you bind a CIDR from one of your prefixes to a region — ideal for address-map deployments and any service you address by IP rather than hostname. Cloudflare then terminates TLS and processes traffic to those addresses only within the data centers in that region.
Regionalized IP Bindings requires the Regional Services and Regional Services for BYOIP entitlements. Contact your account team to enable them.
R2 SQL now supports window functions, SELECT DISTINCT, set operations, and additional aggregates, making it easier to write analytical queries without preprocessing your data elsewhere.
Window functions — ROW_NUMBER, RANK, DENSE_RANK, PERCENT_RANK, CUME_DIST, NTILE, LAG, LEAD, FIRST_VALUE, LAST_VALUE, NTH_VALUE, and aggregates with an OVER (...) clause, including PARTITION BY and explicit frames
QUALIFY — filter rows based on a window function result
DISTINCT — SELECT DISTINCT, DISTINCT ON (...), and the DISTINCT modifier on aggregates such as COUNT(DISTINCT ...)
Set operations — UNION, UNION ALL, INTERSECT, and EXCEPT
Grouping extensions — GROUPING SETS, ROLLUP, and CUBE
Exact aggregates — MEDIAN, PERCENTILE_CONT, ARRAY_AGG, and STRING_AGG
Examples
Rank rows with a window function
SELECT customer_id, region, ROW_NUMBER() OVER (PARTITION BY region ORDER BY total_amount DESC) AS rank_in_regionFROM my_namespace.sales_data
Filter with QUALIFY
SELECT customer_id, region, total_amountFROM my_namespace.sales_dataQUALIFY ROW_NUMBER() OVER (PARTITION BY region ORDER BY total_amount DESC) <= 3
Combine tables with a set operation
SELECT customer_id FROM my_namespace.sales_dataEXCEPTSELECT customer_id FROM my_namespace.archived_sales
The named WINDOW clause is not supported — inline the OVER (...) specification at each call site. For the full syntax reference, refer to the SQL reference. For supported features and performance guidance, refer to Limitations and best practices.
The Routes page in the Cloudflare dashboard now shows the routes across all of your connectors — Cloudflare Mesh and Cloudflare Tunnel routes alongside Cloudflare WAN and Magic Transit static routes — in a single table, instead of a separate routes view per product.
From the unified Routes page you can:
Visualize your network with an interactive map that shows how your destinations flow through to your connectors — including equal-cost multi-path (ECMP) routes where the same prefix is served by several connectors. Select a node to filter the table down to the routes behind it.
See every route in one table, with its destination, type, connector, priority, and source, and filter or sort to find what you need.
Create, edit, and delete routes of any supported type without leaving the page. When adding a Cloudflare WAN or Magic Transit static route, you now pick the next hop by connector name instead of typing its IP.
Your existing routes, APIs, and configurations are unchanged — this is a dashboard experience that brings them together in one place. Learn how to add routes and manage virtual networks.
Durable Objects now supports two new location hints for Asia-Pacific: apac-ne (Northeast Asia-Pacific) and apac-se (Southeast Asia-Pacific). Use apac-ne or apac-se when you want finer-grained placement within Asia-Pacific rather than the broader apac hint.
Use the new hints the same way as any other locationHint:
If your users are spread across all of Asia-Pacific, the existing apac hint remains the right choice. Only reach for apac-ne or apac-se when your traffic is clearly concentrated in one sub-region and you want to minimize round-trip time to that audience. The default behavior and what we generally recommended is not adding a location hint unless absolutely needed, this will create the Durable Object as close to the initializing request as possible to reduce latency.
As with all location hints, these are best-effort suggestions. Cloudflare will place the Durable Object in a nearby data center, not necessarily the exact hinted location.
Durable Objects now remain alive for the duration of active outbound connections created via connect() or an outbound WebSocket. Previously, a Durable Object would be evicted after 70-140 seconds of no incoming traffic, even if the object had an open outbound connection, which is a common pattern when streaming responses from a large language model (LLM) over TCP or an outbound WebSocket.
With this change, each active outbound connection prevents eviction. Once all outbound connections close, the standard 70-140 second inactivity window applies before the Durable Object is evicted.
Before: streaming connections were cut off by eviction
After: active outbound connections keep the Durable Object alive
If you are building agents on Cloudflare, this is especially relevant. An agent that streams tokens from an LLM while calling models, or that performs long-running tasks over an outbound connection, now stays alive for the duration of that connection instead of being evicted mid-stream.
Limits:
Each outbound connection keeps the Durable Object alive for a maximum of 15 minutes. After 15 minutes, the connection stops preventing eviction (the connection itself continues operating), and the standard eviction rules resume.
AI agents can now deploy Workers to Cloudflare without first requiring a user to sign up, open a browser-based OAuth flow, click through the dashboard, or create an API token. When an agent tries to deploy without Cloudflare credentials, Wrangler can tell it to rerun with --temporary, then deploy the Worker to a temporary preview account.
To try this with your agent, update to Wrangler 4.102.0 or later, make sure you are logged out (wrangler logout), and then ask your agent to build something and deploy it to Cloudflare. The agent should follow Wrangler's output and deploy using the --temporary flag.
wrangler deploy --temporary
The temporary deployment stays live for 60 minutes. During that window, the agent can verify the Worker, redeploy changes, and return both the live Worker URL and claim URL. Opening the claim URL lets you sign in to or create a Cloudflare account and make the temporary account permanent.
Temporary preview accounts currently support a limited set of products, including Workers, Workers Static Assets, Workers KV, D1, Durable Objects, Hyperdrive, Queues, and SSL/TLS certificates. For supported products, limits, and claim behavior, refer to Claim deployments (temporary accounts).
exec() is now available for Containers. Use this.ctx.container.exec() to start processes inside a running Container, stream standard input and output, inspect exit codes, and signal each process.
Call exec() from a class extending Container, or from another Durable Object through this.ctx.container. The associated Container must already be running.
This example starts the Container when needed, then reads its Node.js version:
src/index.jsjs
import { Container } from "@cloudflare/containers";export class MyContainer extends Container { async readVersion() { if (!this.ctx.container.running) { await this.start(); } const process = await this.ctx.container.exec(["node", "--version"]); const output = await process.output(); const decoder = new TextDecoder(); return { exitCode: output.exitCode, stdout: decoder.decode(output.stdout), stderr: decoder.decode(output.stderr), }; }}
src/index.tsts
import { Container } from "@cloudflare/containers";export class MyContainer extends Container { async readVersion() { if (!this.ctx.container.running) { await this.start(); } const process = await this.ctx.container.exec(["node", "--version"]); const output = await process.output(); const decoder = new TextDecoder(); return { exitCode: output.exitCode, stdout: decoder.decode(output.stdout), stderr: decoder.decode(output.stderr), }; }}
The command array starts an executable directly, without an implicit shell. Invoke a shell explicitly for pipes, redirects, or variable expansion.
One RPC method can coordinate multiple exec() calls in one caller-to-Durable Object round trip. It can also pass byte-oriented ReadableStream input or return streamed output with flow control.