Changelog
New updates and improvements at Cloudflare.

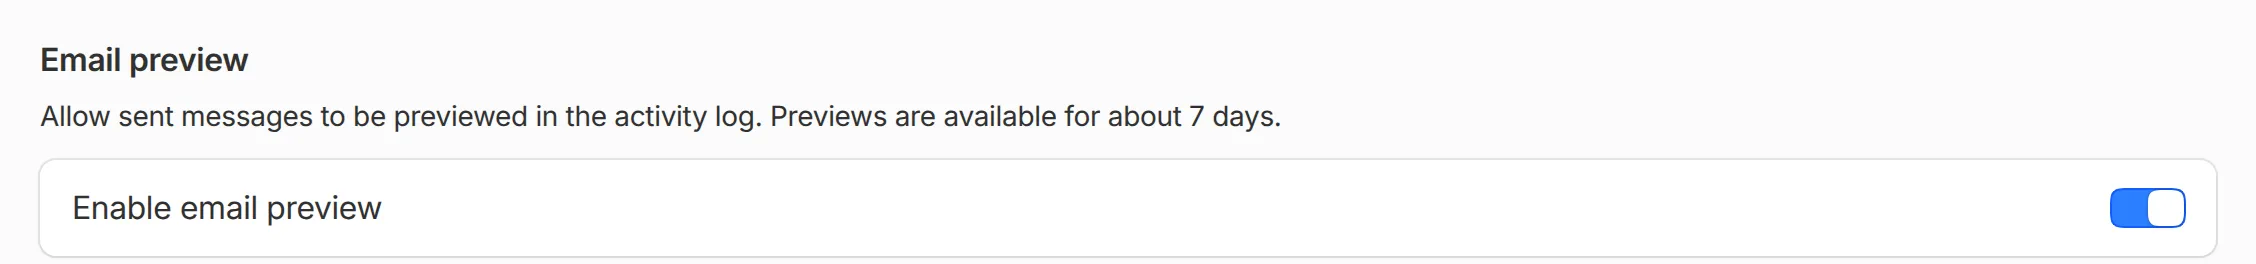
You can now preview the content of sent emails directly from the Email Service Activity log. Expand a sent email and open the new Preview section to inspect the message as it was sent, across tabs for the rendered HTML body, the Text body, the Headers, the Attachments, and the full Raw RFC 5322 ↗ source.

Previously, the Activity log surfaced delivery and authentication metadata but not the message content, making rendering and content issues harder to debug. Message preview closes that gap.
To make messages previewable, turn on Email preview in your sending domain's settings. Previews cover messages sent while the setting is turned on and are retained for about seven days. Sending domains onboarded on or after 2026-07-02 have Email preview turned on automatically.
Refer to Email logs for more information.
Wrangler now includes
wrangler flagship, a command suite for managing Flagship apps and feature flags from your terminal.Create an app and, if you use it from a Worker, add it to your
wrangler.jsonorwrangler.jsoncfile as a binding:Terminal window wrangler flagship apps create "My Worker App" \--binding FLAGS \--update-configThen create flags for the behavior you want to control. Flags can be booleans, strings, numbers, or JSON values:
Terminal window wrangler flagship flags create <APP_ID> new-checkoutwrangler flagship flags create <APP_ID> checkout-flow \--variation control=old-checkout \--variation treatment=new-checkout \--default control \--type stringAfter a flag exists, change its default variation or use enable and disable commands as kill switches. Existing targeting rules continue to apply unless you change or clear them explicitly:
Terminal window wrangler flagship flags update <APP_ID> checkout-flow --default treatmentwrangler flagship flags disable <APP_ID> checkout-flowwrangler flagship flags enable <APP_ID> checkout-flowFor release workflows, use
rollout,split, andrulesto change exposure without redeploying your Worker:Terminal window wrangler flagship flags rollout <APP_ID> new-checkout \--to on \--percentage 25 \--by user_idwrangler flagship flags split <APP_ID> checkout-flow \--weight control=80 \--weight treatment=20 \--by user_idwrangler flagship flags rules update <APP_ID> checkout-flow \--priority 1 \--when "country equals US"These commands can also be used from CI/CD pipelines, scripts, and AI agents to inspect Flagship state, update flag behavior, or roll back changes through Wrangler.
Refer to the
wrangler flagshipcommand reference for the full command guide.
You can now subscribe to Email Sending events through Queues event subscriptions and receive outbound transactional email lifecycle events on a queue. Each subscription is scoped to one sending domain — either the zone apex, such as
example.com, or a verified sending subdomain, such assend.example.com.Six event types are published:
message.delivered,message.deferred,message.bounced,message.failed,message.rejected, andmessage.complained. Use them to track deliverability, react to bounces and complaints, and drive suppression or retry logic. Email Routing events are not published on this source.Each event includes the message details, delivery status, and SMTP response:
{"type": "cf.email.sending.message.delivered","source": {"type": "email.sending","zoneId": "023e105f4ecef8ad9ca31a8372d0c353","domain": "example.com"},"payload": {"messageId": "0101018f7d0c4d9a-msg-deadbeef","recipient": "user@example.net","terminal": true,"delivery": {"status": "delivered","smtpStatusCode": "250"}}}Refer to Event subscriptions to see all event types and example payloads.
The legacy Workers KV API routes under
/accounts/{account_id}/workers/namespaces/*are deprecated as of July 15, 2026, and will stop working on October 15, 2026. Migrate to the documented Workers KV API routes under/accounts/{account_id}/storage/kv/namespaces/*before that date.The legacy and replacement routes are interchangeable. They accept the same request parameters and return the same response payloads. To migrate, update the URL path from
/workers/namespaces/to/storage/kv/namespaces/.Update any integration that calls a route under
/accounts/{account_id}/workers/namespaces/to use the equivalent route under/accounts/{account_id}/storage/kv/namespaces/. The migration is a direct URL path substitution — request parameters and response payloads are identical:GETandPOST /accounts/{account_id}/workers/namespaces→GETandPOST /accounts/{account_id}/storage/kv/namespacesGET,PUT, andDELETE /accounts/{account_id}/workers/namespaces/{namespace_id}→GET,PUT, andDELETE /accounts/{account_id}/storage/kv/namespaces/{namespace_id}GET /accounts/{account_id}/workers/namespaces/{namespace_id}/keys→GET /accounts/{account_id}/storage/kv/namespaces/{namespace_id}/keysGET /accounts/{account_id}/workers/namespaces/{namespace_id}/metadata/{key_name}→GET /accounts/{account_id}/storage/kv/namespaces/{namespace_id}/metadata/{key_name}GET,PUT, andDELETE /accounts/{account_id}/workers/namespaces/{namespace_id}/values/{key_name}→GET,PUT, andDELETE /accounts/{account_id}/storage/kv/namespaces/{namespace_id}/values/{key_name}
For more information about the deprecation timeline, refer to API deprecations.
Cloudflare Web Analytics (Real User Monitoring) has rolled out performance optimizations to significantly improve the stability and loading speed of account-wide dashboards.
For larger accounts (with >100 Web Analytics sites), loading the aggregate account-wide view would often fail, running into timeouts or unexpected interface errors due to the massive scale of parallel query processing. This update optimizes how high-volume multi-site data is queried to reduce errors and provide a snappier dashboard experience.
Accounts with up to 1,000 sites will now be able to load this account-wide aggregate view without experiencing misleading errors.
If you have an account with over 1,000 sites, we cannot currently aggregate over this volume due to processing constraints but you will now be presented with a clear error and instruction to filter to the relevant site(s) you wish to see the data for.
Platforms can now create temporary preview accounts through the Cloudflare REST API. This lets your platform deploy a live Worker before the user signs in to Cloudflare.
With the Temporary Accounts API, coding agents, AI app builders, and other platforms can build a similar flow for generated Workers and supported resources.
Your platform can keep users in its onboarding flow while they generate, deploy, and test an application. Users do not need an existing Cloudflare account, and your platform does not need write access to one.

The API returns a claim URL that lets the user make the temporary account and its resources permanent.
Cloudflare Drop ↗ demonstrates this preview-and-claim pattern for static sites. Someone can upload a site, test and share it for one hour, then sign in or create an account only when they want to keep it.
This API expands the flow first introduced with
wrangler deploy --temporary. Your backend now controls the provisioning and deployment experience directly:- Show Cloudflare's Terms of Service and Privacy Policy in your product, and require the user to accept them.
- Request and solve a proof-of-work challenge.
- Create a temporary preview account.
- Deploy with the returned temporary account ID and API token.
- Show the deployed Worker URL and claim URL to the user.
Terminal window curl "https://api.cloudflare.com/client/v4/provisioning/previews/challenge" \-X POST \-H "Content-Type: application/json" \--data '{}'curl "https://api.cloudflare.com/client/v4/provisioning/previews" \-X POST \-H "Content-Type: application/json" \--data '{"termsOfService": "https://www.cloudflare.com/terms/","privacyPolicy": "https://www.cloudflare.com/privacypolicy/","acceptTermsOfService": "yes","challengeToken": "<CHALLENGE_TOKEN>","solution": {"checkpoints": "<BASE64_CHECKPOINTS>"}}'For the complete API flow, proof-of-work requirements, supported products, and limits, refer to Claim deployments (temporary accounts). For the background and design goals behind this flow, refer to Temporary Cloudflare Accounts for AI agents ↗.
Agents connected to Model Context Protocol (MCP) servers with
addMcpServercan now handle elicitation ↗ requests.Elicitation lets an MCP server request user input while it handles a tool call. Form mode collects structured, non-sensitive data. URL mode asks for consent before opening an out-of-band flow, such as third-party authorization or payment.
sequenceDiagram
    participant User
    participant Agent as Agent (MCP client)
    participant Server as MCP server
    participant Browser

    Server->>Agent: elicitation/create
    Agent->>User: Show server, reason, and input or URL
    User->>Agent: Submit, open, decline, or cancel
    Agent->>Browser: Open URL after consent (URL mode)
    Agent->>Server: accept, decline, or cancel
    Server-->>Agent: Optional URL completion notification
Register a handler for each mode your Agent supports in
onStart():JavaScript import { Agent } from "agents";export class MyAgent extends Agent {onStart() {this.mcp.configureElicitationHandlers({form: (request, serverId) => this.forwardToUser(request, serverId),url: (request, serverId) => this.forwardToUser(request, serverId),});}forwardToUser(request, serverId) {// Show the request in your UI and resolve after the user responds.throw new Error(`Implement elicitation for ${serverId}: ${request.params.message}`,);}}TypeScript import { Agent } from "agents";import type { ElicitRequest, ElicitResult } from "agents/mcp";export class MyAgent extends Agent<Env> {onStart() {this.mcp.configureElicitationHandlers({form: (request, serverId) => this.forwardToUser(request, serverId),url: (request, serverId) => this.forwardToUser(request, serverId),});}private forwardToUser(request: ElicitRequest,serverId: string,): Promise<ElicitResult> {// Show the request in your UI and resolve after the user responds.throw new Error(`Implement elicitation for ${serverId}: ${request.params.message}`,);}}Connections advertise only the modes with configured handlers. An Agent without handlers advertises no elicitation capability, which lets the server use its fallback. The SDK stores the advertised modes with each MCP server registration so they survive Durable Object hibernation. Callback functions remain in memory and reattach when
onStart()runs.For implementation details and a browser forwarding pattern, refer to MCP client elicitation. The
mcp-client↗ andmcp-elicitation↗ examples implement both sides.To update to this release:
npm i agents@latestyarn add agents@latestpnpm add agents@latestbun add agents@latest
R2 Data Catalog now accepts read-only API tokens, so query engines and clients that only read data no longer need a read-write token. Previously, every catalog operation required an Admin Read & Write token, which meant read-only clients were granted more access than they needed.
You can now authenticate your Iceberg engine based on your workload:
- Read-only operations (such as listing namespaces, loading tables, and querying data) work with an Admin Read only token (R2 Data Catalog read and R2 storage read).
- Write operations (such as creating or dropping tables and committing transactions) continue to require an Admin Read & Write token.
This lets you follow the principle of least privilege — for example, using a read-write token for the pipeline that writes to your tables and read-only tokens for engines like R2 SQL, DuckDB, or PyIceberg that query them.
Note that credentials vended by the catalog inherit the R2 storage permissions of the token used to authenticate. To ensure read-only access to your underlying data, scope the R2 storage permission to read-only as well.
For details on choosing and creating the right token, refer to Authenticate your Iceberg engine.
R2 Data Catalog, a managed Apache Iceberg ↗ catalog built into R2, now automatically optimizes manifest files as part of compaction.
Manifest files track the data files that make up an Iceberg table. As a table accumulates many small or fragmented manifests, query engines must read more metadata during query planning, which slows down queries even before any data is scanned.
When compaction runs, R2 Data Catalog now rewrites and clusters manifest files by partition as a best-effort pre-step. This consolidates fragmented manifests, reduces the number of manifests a query engine must open, and lowers metadata I/O overhead. Tables that are already well-clustered are skipped, so the operation only runs when it provides a benefit.
This happens automatically for tables with compaction enabled — no configuration changes are required.
For more information, refer to Table maintenance.
The Markdown Conversion service now supports a new
outputconversion option that controls the format of the converted content.Set
output.formattotextto receive plain text with Markdown syntax removed. The default value ismarkdown, so existing conversions are unchanged.Use the
env.AIbinding:JavaScript await env.AI.toMarkdown({ name: "page.html", blob: new Blob([html]) },{conversionOptions: {output: { format: "text" },},},);TypeScript await env.AI.toMarkdown({ name: "page.html", blob: new Blob([html]) },{conversionOptions: {output: { format: "text" },},},);Or call the REST API:
Terminal window curl https://api.cloudflare.com/client/v4/accounts/{ACCOUNT_ID}/ai/tomarkdown \-H 'Authorization: Bearer {API_TOKEN}' \-F 'files=@index.html' \-F 'conversionOptions={"output": {"format": "text"}}'When you request text output, the
formatfield of each result is set totext. For more details, refer to Conversion Options.
With Workflows, you can configure built-in retry behavior for each step. Previously, you could configure step retries with fixed delay durations, such as seconds, minutes, or hours, and backoff strategies such as
constant,linear, orexponential.Step retries now support dynamic delay functions. Instead of choosing only a base delay and backoff strategy, pass a function to
retries.delayand calculate the next delay from the failed attempt and thrown error.This is useful when retries should depend on the failure. Your Workflow may need to wait longer after a rate-limit error, but retry sooner after a short network failure. The delay function can also accommodate provider guidance if, for example, a downstream API returns a
Retry-Aftervalue in its error messaging.JavaScript await step.do("sync customer",{retries: {limit: 5,delay: ({ ctx, error }) => {if (error.message.includes("rate limit")) {return `${ctx.attempt * 30} seconds`;}return "10 seconds";},},},async () => {await syncCustomer();},);TypeScript await step.do("sync customer",{retries: {limit: 5,delay: ({ ctx, error }) => {if (error.message.includes("rate limit")) {return `${ctx.attempt * 30} seconds`;}return "10 seconds";},},},async () => {await syncCustomer();},);Dynamic delay functions can return a duration string, a number, or a promise that resolves to a duration. Use them to add adaptive retry behavior without writing separate queue or scheduling logic. For more information, refer to Sleeping and retrying.
If your account does not already have a key-value (KV) backed Durable Object namespace, you can no longer create new ones. New Durable Object namespaces must use the SQLite storage backend, which has been recommended for all new Durable Objects since it became generally available ↗ in 2024.
Create a new class with a
new_sqlite_classesmigration:JSONC {"$schema": "./node_modules/wrangler/config-schema.json","migrations": [{"tag": "v1","new_sqlite_classes": ["MyDurableObject"]}]}TOML [[migrations]]tag = "v1"new_sqlite_classes = ["MyDurableObject"]SQLite-backed Durable Objects have feature parity with the key-value backend — including the key-value storage API — and additionally support relational SQL queries and point-in-time recovery to restore an object's storage to any point in the past 30 days.
If you attempt to create a new key-value backed namespace (a
new_classesmigration) on an affected account, the deployment fails with the following error:Creating new key-value backed Durable Object namespaces is no longer supported on this account. Please create a namespace using a `new_sqlite_classes` migration instead.This change only affects accounts that are not already using the key-value storage backend. Accounts with at least one existing key-value backed namespace can still create new ones for now, and the Workers Free plan has only ever supported SQLite-backed Durable Objects. It is part of a broader move toward SQLite as the single storage backend for Durable Objects, ahead of a future migration path for existing key-value backed objects.
For more information, refer to Durable Objects migrations.
On October 5, 2026, two changes take effect across the Zero Trust Networks API and Cloudflare Tunnel API: the CIDR-encoded route endpoints are removed, and tunnel list and get responses no longer include the
connectionsfield. If you manage private network routes or read tunnel connection details through the API,cloudflared, Terraform, or another integration, review the changes in the following sections and migrate before the removal date.The CIDR-encoded route endpoints are deprecated in favor of the standard,
route_id-based endpoints that already exist today. Both sets of endpoints route a private network through Cloudflare Tunnel or Cloudflare Mesh (the API still refers to Mesh nodes aswarp_connector) — only the request shape changes.Deprecated endpoints (removed October 5, 2026):
- Create a tunnel route (CIDR Endpoint):
POST /accounts/{account_id}/teamnet/routes/network/{ip_network_encoded} - Update a tunnel route (CIDR Endpoint):
PATCH /accounts/{account_id}/teamnet/routes/network/{ip_network_encoded} - Delete a tunnel route (CIDR Endpoint):
DELETE /accounts/{account_id}/teamnet/routes/network/{ip_network_encoded}
Replacement endpoints:
- Create a tunnel route:
POST /accounts/{account_id}/teamnet/routes - Update a tunnel route:
PATCH /accounts/{account_id}/teamnet/routes/{route_id} - Delete a tunnel route:
DELETE /accounts/{account_id}/teamnet/routes/{route_id}
Deprecated (CIDR-encoded path) Replacement Route identifier URL-encoded CIDR in the path ( /network/{ip_network_encoded})route_idin the path (networkmoves to the request body on create)Create POST .../teamnet/routes/network/{ip_network_encoded}POST .../teamnet/routeswithnetworkandtunnel_idin the bodyUpdate PATCH .../teamnet/routes/network/{ip_network_encoded}PATCH .../teamnet/routes/{route_id}Delete DELETE .../teamnet/routes/network/{ip_network_encoded}DELETE .../teamnet/routes/{route_id}- Capture each route's
route_idby calling List tunnel routes, or read it from the response the first time you create a route with the replacement endpoint. - Update any scripts, backend services, or CI/CD pipelines that call the CIDR-encoded endpoints directly.
- If you manage routes with the
cloudflared tunnel route ip add | deletecommands, upgradecloudflaredto the latest version ↗. - If you manage routes with Terraform, make sure you are on a current version of the
cloudflare_zero_trust_tunnel_cloudflared_route↗ resource and the Cloudflare Terraform provider ↗.
Terminal window # Before: create a route by URL-encoding the CIDR into the pathcurl https://api.cloudflare.com/client/v4/accounts/$ACCOUNT_ID/teamnet/routes/network/172.16.0.0%2F16 \-H 'Content-Type: application/json' \-H "Authorization: Bearer $CLOUDFLARE_API_TOKEN" \-d '{"tunnel_id": "'$TUNNEL_ID'", "comment": "Example comment for this route."}'# After: create a route with the network in the request bodycurl https://api.cloudflare.com/client/v4/accounts/$ACCOUNT_ID/teamnet/routes \-H 'Content-Type: application/json' \-H "Authorization: Bearer $CLOUDFLARE_API_TOKEN" \-d '{"network": "172.16.0.0/16", "tunnel_id": "'$TUNNEL_ID'", "comment": "Example comment for this route."}'# After: update or delete a route using its route_idcurl -X PATCH https://api.cloudflare.com/client/v4/accounts/$ACCOUNT_ID/teamnet/routes/$ROUTE_ID \-H 'Content-Type: application/json' \-H "Authorization: Bearer $CLOUDFLARE_API_TOKEN" \-d '{"comment": "Updated comment for this route."}'curl -X DELETE https://api.cloudflare.com/client/v4/accounts/$ACCOUNT_ID/teamnet/routes/$ROUTE_ID \-H "Authorization: Bearer $CLOUDFLARE_API_TOKEN"Starting the same day, the
connectionsarray is removed from list and get responses for Cloudflare Tunnel and Cloudflare Mesh nodes (thecfd_tunnelandwarp_connectorAPI resources). Query the dedicated connections endpoint instead of reading the field off the tunnel or node object.This affects:
GET /accounts/{account_id}/cfd_tunnel—connectionsremoved from each item inresultGET /accounts/{account_id}/cfd_tunnel/{tunnel_id}—connectionsremoved fromresultGET /accounts/{account_id}/warp_connector—connectionsremoved from each item inresultGET /accounts/{account_id}/warp_connector/{tunnel_id}—connectionsremoved fromresult
Fetch connection details from the tunnel-specific connections endpoint instead of parsing it off the list or get response. For Cloudflare Tunnel, call
GET /accounts/{account_id}/cfd_tunnel/{tunnel_id}/connections. For Cloudflare Mesh, callGET /accounts/{account_id}/warp_connector/{tunnel_id}/connections.Terminal window # Before: read connections off the tunnel objectcurl https://api.cloudflare.com/client/v4/accounts/$ACCOUNT_ID/cfd_tunnel/$TUNNEL_ID \-H "Authorization: Bearer $CLOUDFLARE_API_TOKEN"# After: query connections directlycurl https://api.cloudflare.com/client/v4/accounts/$ACCOUNT_ID/cfd_tunnel/$TUNNEL_ID/connections \-H "Authorization: Bearer $CLOUDFLARE_API_TOKEN"Update any dashboards, monitoring scripts, or automation that parses
connectionsfrom the tunnel list or get response.cloudflaredand the Cloudflare Terraform provider do not read this field, so no changes are required on their side for this part of the update.- Smaller, faster responses. Cloudflare Tunnel and Cloudflare Mesh nodes with many connections no longer inflate every list and get call — connection detail is only fetched when you need it.
- A single way to identify a route. Consolidating on
route_idremoves the need to URL-encode CIDR ranges into the path and matches how every other resource in the Zero Trust Networks API is addressed. - Consistency across the API. Both changes align these endpoints with Cloudflare's standard REST conventions for resource identifiers and nested detail endpoints.
To learn more, refer to the Zero Trust Networks API, the Cloudflare Tunnel API, and Routes documentation.
- Create a tunnel route (CIDR Endpoint):
Wrangler now collects npm package dependency information from your project's
package.jsonduringwrangler deployandwrangler versions upload, and includes it in the upload metadata sent to the Cloudflare API. This data, each dependency's name, declared version range, and exact installed version, enables dependency analytics and future supply chain security features such as vulnerability alerting.To opt out, set
dependencies_instrumentation.enabledtofalsein your Wrangler configuration file:JSONC {"dependencies_instrumentation": {"enabled": false}}TOML [dependencies_instrumentation]enabled = falseFor more details, refer to Wrangler configuration.
In AI Search, you can upload files to an instance, or connect a data source such as an R2 bucket, to make your content searchable with natural language. Each file becomes an item identified by an object key (its filename or path). The list items endpoint returns the items in an instance.
That endpoint now accepts a
keyquery parameter, so you can look up a single item by its exact object key without paging through the full list. This complements the existingitem_idfilter for when you know the key but not the ID.Terminal window curl "https://api.cloudflare.com/client/v4/accounts/<ACCOUNT_ID>/ai-search/instances/<INSTANCE_NAME>/items?key=docs/readme.md" \-H "Authorization: Bearer <API_TOKEN>"Keys are unique per data source, so combine
keywithsource(for example,source=builtin) to disambiguate when the same key exists across multiple sources.For more information, refer to managing items.
Workers AI Markdown conversion (
toMarkdown) now supports.gifand.bmpimage files, in addition to the JPEG, PNG, WebP, and SVG formats already supported.GIF and BMP files run through the same image pipeline as other formats. Each image is resized if needed (and for animated GIFs, only the first frame is used), then passed to an object-detection model to identify what it contains. Those detected objects prompt a vision model that writes a natural-language description of the image, which becomes searchable, machine-readable Markdown.
AI Search uses
toMarkdownautomatically to process the files it ingests, so any.gifand.bmpfiles are included the next time your index syncs, with no configuration changes required. This helps when your content mixes formats, for example a support knowledge base full of screenshots or an archive of BMP scans.Learn more about Markdown conversion and the full list of AI Search's supported file types.
You can now query your R2 Data Catalog tables with R2 SQL directly from the Cloudflare dashboard, without installing a CLI or wiring up a client. This makes it easy to explore your Apache Iceberg ↗ data, validate queries, and inspect results in one place.
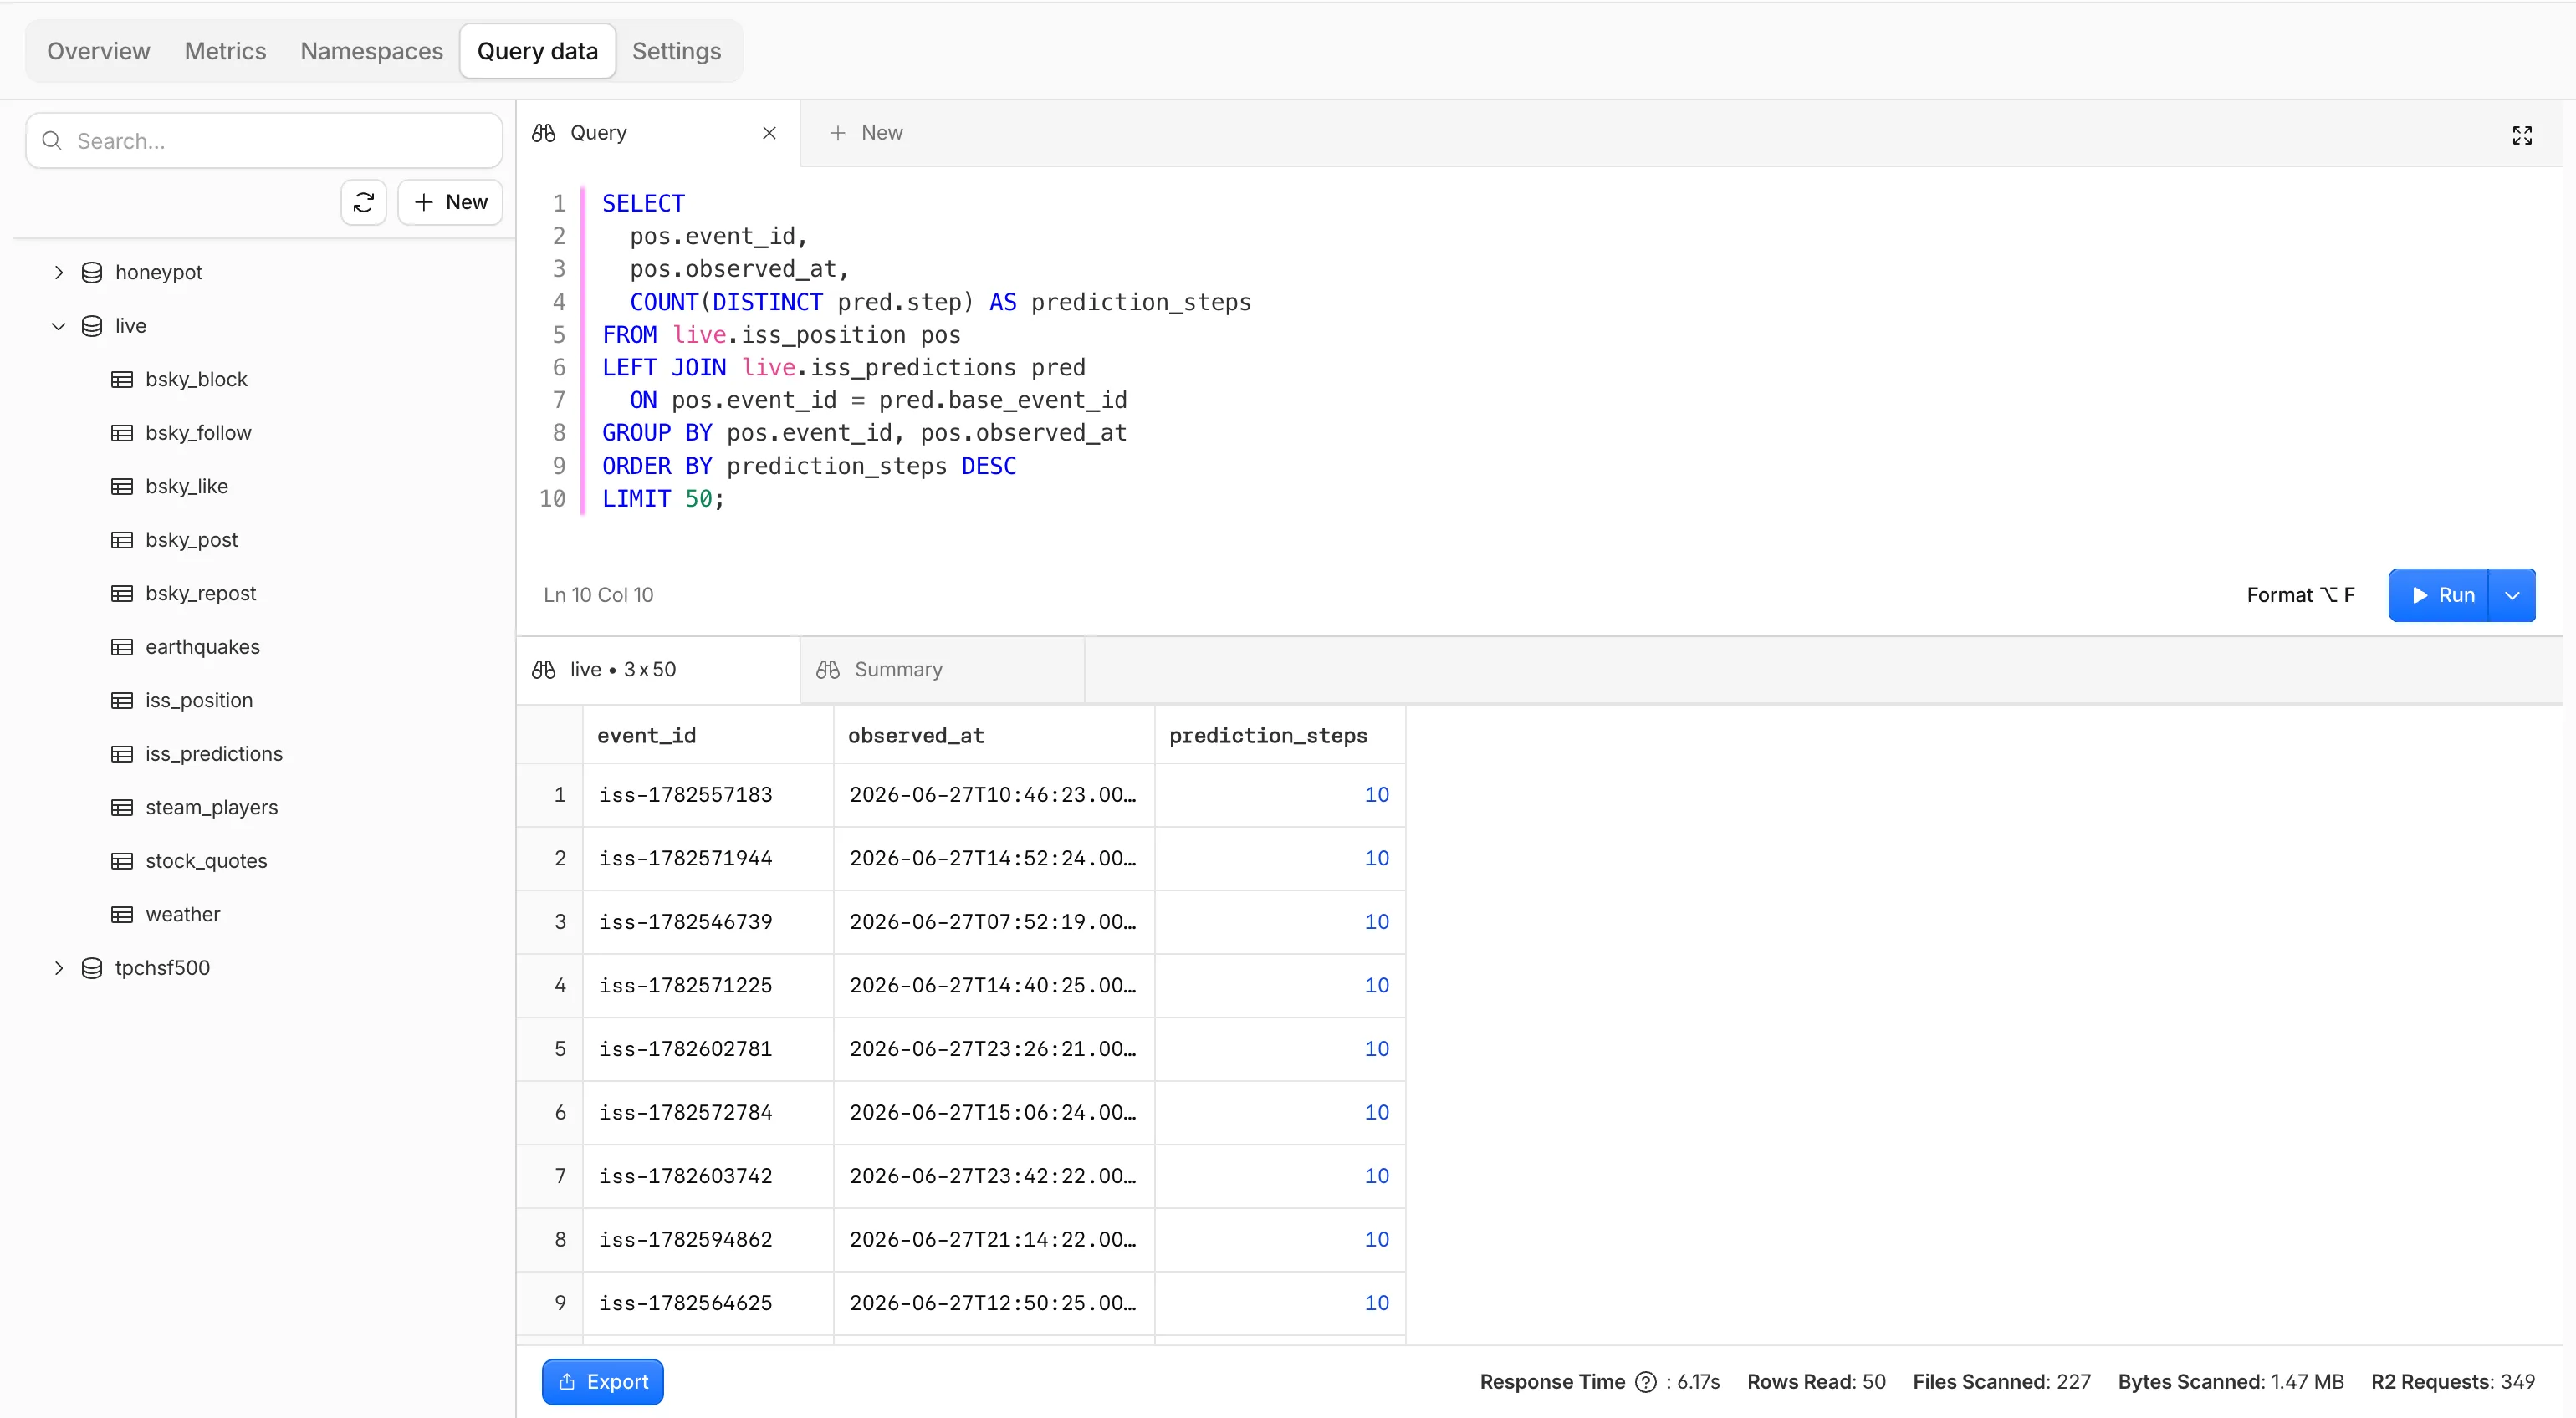
To get started, go to R2 Data Catalog ↗ in the Cloudflare dashboard and select Query data to launch the built-in SQL editor. From there you can:
- Write and run queries interactively — Iterate on R2 SQL directly in the browser with syntax highlighting and autocomplete, instead of re-running commands through Wrangler or the REST API.
- Explore your data — Explore your namespaces and tables alongside the editor so you can discover what's queryable without leaving the page or using other tools.
- Understand results and performance — View result sets with per-query statistics, export them, and get helpful
EXPLAINoutputs to see exactly how a query runs.
Partnering with Moondream ↗ to bring their latest model
@cf/moondream/moondream3.1-9B-A2Bto Workers AI. Moondream 3.1 is a fast vision language model built on a mixture-of-experts architecture with 9B total parameters and 2B active, delivering frontier-level visual reasoning while retaining fast, cost-efficient inference.Moondream 3.1 is designed for real-world vision tasks, with a 32K token context window for handling complex queries and structured outputs.
- Query — ask open-ended questions about an image, with an optional reasoning parameter
- Caption — generate short, normal, or long descriptions of an image
- Point — return coordinates for objects matching a target phrase
- Detect — return bounding boxes for objects matching a target phrase
Vision workloads like live camera feeds, robotics, content moderation, and interactive agents need answers in milliseconds, not seconds. Moondream 3.1's small active footprint (2B active parameters) pairs well with Workers AI's serverless, globally distributed inference: requests run close to your users, and streaming responses start returning tokens almost immediately.
In our testing, first tokens streamed back in roughly 20–30 ms, and results were fast across every task. The example end-to-end times below (client-observed median, including network round trip) are for a simple, single-subject image. Actual latency depends heavily on the image and how much detail you ask for.
Task End-to-end (p50) query~770 ms caption~480 ms point~145 ms detect~160 ms At these speeds you can call the model inline while handling a request rather than pushing the work to a background queue or a separate service. That opens up use cases where a slow response breaks the experience: moderating user-uploaded images before they are stored, locating an object in a video frame to drive a live overlay, extracting fields from a document during a form submission, or letting an agent inspect a screenshot and decide its next step within a single turn.
Use Moondream 3.1 through the Workers AI binding (
env.AI.run()) or the REST API at/ai/run. You can also use AI Gateway with these endpoints.For more information, refer to the Moondream 3.1 model page and pricing.
Cloudflare Drop ↗ lets you deploy a static site to Cloudflare without requiring a Cloudflare account to get started.

Upload a folder or zip file of static assets (static HTML, CSS, JavaScript, images, and fonts) and get a temporary live preview that stays live for 1 hour. During that window, you can test the site, share the preview URL, or claim the deployment to keep it.

When you are ready to make the deployment permanent, click Claim to sign in or create a Cloudflare account. You can claim the site into an existing Cloudflare account or create a new account for the deployment.

After claiming the site, you can:
- Add a domain: Connect an existing domain or purchase a new one for your site.
- Enable observability: Monitor your site's performance and usage.
- Enable Markdown for Agents: Allow AI agents to access your site's content in Markdown.
- Control access: Make your site private and choose who can view it.

Workflows pricing now includes per-step billing. Requests and CPU time billing have been enabled since the initial public beta and is not changing.
A step is each unit of work executed by a Workflow, including step operations such as sleeping or waiting for events.
You can query Workflows analytics, including
stepCountfor a Workflow instance, with the GraphQL Analytics API.Starting no earlier than August 10th, 2026, Cloudflare will begin billing for step and storage usage on Workers Paid plans.
Storage pricing has been published since Workflows became generally available and is not changing. Storage is measured as persisted Workflow state in GB-months.
Dimension Workers Free Workers Paid Steps 3,000 included per day 500,000 included per month, then $0.80 per additional 100,000 steps Storage 1 GB-month included 1 GB-month included, then $0.20 per additional GB-month Developers on the Workers Free plan will not be charged for steps or storage beyond the included amounts.
Cloudflare will not bill step and storage usage before August 10, 2026.
You can review Workflows usage in the Cloudflare dashboard ↗ before this change takes effect. To reduce costs, consider reducing the number of steps per Workflow or improving the memory efficiency of your stored state.
Refer to the Workflows pricing page for full details.
Browser Run now supports a standalone
/accessibilityTreeendpoint, giving agent and automation workflows direct access to the browser's accessibility tree for a rendered webpage.An accessibility tree is the browser's structured view of a rendered page: roles, names, states, values, and hierarchy. It is useful for accessibility tooling, but also for AI agents and automation workflows that need page structure without the noise of raw HTML or the cost of screenshots.
For AI agents, this means less inference from pixels and less parsing HTML. You can provide the page structure directly, helping agents identify available elements and determine which actions they can take.
With the new
/accessibilityTreeendpoint, you can request the accessibility tree directly when you only need the semantic structure of a page. If you need multiple page formats in a single API call, you can use the/snapshotendpoint, which also returns Markdown, HTML, and screenshots.Terminal window curl -X POST 'https://api.cloudflare.com/client/v4/accounts/<accountId>/browser-run/accessibilityTree' \-H 'Authorization: Bearer <apiToken>' \-H 'Content-Type: application/json' \-d '{"url": "https://example.com/"}'{"success": true,"result": {"accessibilityTree": {"role": "RootWebArea","name": "Example Domain","children": [{"role": "heading","name": "Example Domain","level": 1},{"role": "link","name": "Learn more"}]}}}Use
interestingOnlyto return only semantically meaningful nodes, orrootto capture the accessibility tree for a specific subtree.Refer to the
/accessibilityTreedocumentation for usage examples and supported parameters.
R2 Data Catalog is a managed Apache Iceberg ↗ catalog built directly into your R2 bucket. Iceberg tracks your data through a tree of metadata files, so every insert, update, and delete must go through a catalog transaction. Manually adding, modifying, or deleting objects outside the catalog can leave pointers referencing files that no longer exist, corrupting the table into an inconsistent state that is difficult to recover from.
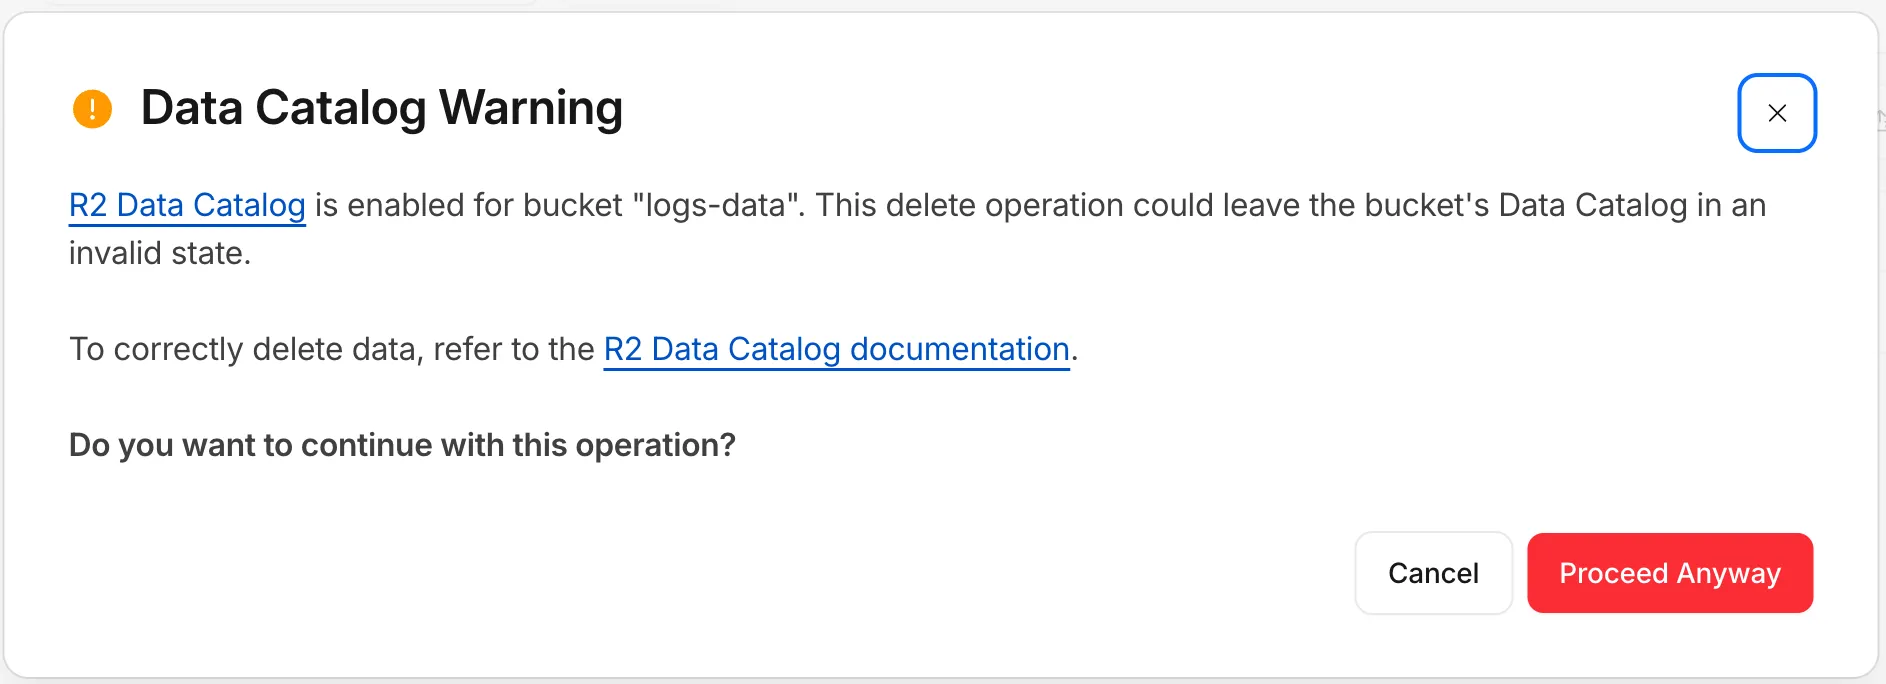
To help prevent this, the R2 dashboard and Wrangler now warn you when you attempt a manual delete operation on a Data Catalog-enabled bucket.
When you try to delete objects from a bucket that has R2 Data Catalog enabled, the dashboard displays a warning explaining that the operation could leave the catalog in an invalid state, with a link to the documentation for deleting data correctly. You can cancel the operation or choose to proceed anyway.
Wrangler now checks whether a bucket is Data Catalog-enabled before running a delete and warns you before continuing:
Data Catalog is enabled for this bucket.Proceeding may leave the data catalog in an invalid state. Continue?To learn how to safely manage and delete data in your tables, refer to the R2 Data Catalog documentation.
A new declarative
exportsfield in your Wrangler configuration file replaces the imperativemigrationsarray for managing Durable Object class lifecycle. Instead of writing an ordered list of migration steps with unique tags, you declare each Durable Object class your Worker exports and Cloudflare compares that against what's already deployed to determine what Durable Object state needs to be created, renamed, or deleted.With legacy migrations, renaming
ChatRoomtoRoomrequires retaining both tagged steps:Before — legacy migrations {"migrations": [{ "tag": "v1", "new_sqlite_classes": ["ChatRoom"] },{"tag": "v2","renamed_classes": [{ "from": "ChatRoom", "to": "Room" }],},],}With
exports, you instead declareRoomas the current class and markChatRoomas renamed:After — declarative exports {"exports": {"ChatRoom": {"type": "durable-object","state": "renamed","renamed_to": "Room",},"Room": { "type": "durable-object", "storage": "sqlite" },},}Each entry is keyed by class name. The
statefield carries the lifecycle (createdby default — a live class — plus tombstone statesdeleted,renamed, andtransferred, and theexpecting-transferreceiving state for cross-Worker transfers).Key improvements over the legacy
migrationsarray:- No migration tags. The current
exportsmap is the source of truth — there is no historical chain ofv1,v2,v3entries to maintain. - Structured deployment output. Wrangler reports when it creates, updates, deletes, renames, or transfers Durable Object classes. It also identifies stale configuration entries that are safe to remove. Deployments with no changes or notices do not print this output.
- Zero-downtime rename and transfer patterns are first-class. Tombstones may coexist with the source class still in code, enabling a three-deploy rename and a four-deploy cross-Worker transfer without runtime errors during the rollout window.
- Cross-Worker safety. When you delete or rename a class, Cloudflare lists every other Worker in your account whose bindings still reference the namespace, so you can redeploy them before the change goes live.
Existing Workers using the legacy
migrationsarray continue to work unchanged. To move toexports, refer to the migration guide.exportsandmigrationsare mutually exclusive within a single Worker.For the full reference, refer to Durable Object class exports.
- No migration tags. The current
We have released version 5 of
@cloudflare/workers-types↗. This release simplifies the package to expose only the latest runtime types.We still recommend that you generate types for your Worker using
wrangler types, but if you want to use the package directly, you can install it with your package manager of choice:npm i -D @cloudflare/workers-types@latestyarn add -D @cloudflare/workers-types@latestpnpm add -D @cloudflare/workers-types@latestbun add -d @cloudflare/workers-types@latestThe package now exposes two entrypoints:
@cloudflare/workers-typesreflects the latest compatibility date, using the latest stable compatibility flags.@cloudflare/workers-types/experimentalreflects APIs behind experimental compatibility flags.
The dated entrypoints, such as
@cloudflare/workers-types/2022-11-30and@cloudflare/workers-types/2023-03-01, are removed. With runtime type generation in Wrangler v4, you can generate these with thewrangler typescommand to create types locked to your Worker's compatibility date.For more information, refer to TypeScript language support.
When you connect a data source to your AI Search instance, AI Search runs sync jobs to keep your index up to date with your content. You can now manage those jobs directly from Wrangler.
For example, you can trigger a sync job from your CI/CD or automated pipelines with the
jobs createcommand so your index refreshes when you push a change:Terminal window wrangler ai-search jobs create my-instanceThis creates an asynchronous sync job that checks for changes in your data source, and sends new, modified, or deleted files to be indexed. The following commands are available:
Command Description wrangler ai-search jobs createTrigger a new sync job wrangler ai-search jobs listList sync jobs for an instance wrangler ai-search jobs getGet details for a job wrangler ai-search jobs cancelCancel a running job wrangler ai-search jobs logsView log entries for a job All commands accept
--namespace/-n(defaults todefault) and--jsonfor structured output that automation and AI agents can parse directly. Thelistandlogscommands also support--pageand--per-pagefor pagination, andcancelprompts for confirmation unless you pass-y/--force.For full usage details, refer to the AI Search Wrangler commands documentation.