Logs
New Logpush datasets and updated fields across multiple Logpush datasets in Cloudflare Logs
Cloudflare has updated Logpush datasets:
- Email Security Post-Delivery Events: A new dataset with fields including
AlertID,CompletedAt,Destination,FinalDisposition,Folder,From,FromName,MessageID,MessageTimestamp,MicrosoftTenantID,Operation,PostfixID,Reasons,Recipient,RequestedAt,RequestedBy,RequestedDisposition,Status,Subject,Success, andTo. - Magic Network Monitoring Flow Logs: A new dataset with fields including
AWSVPCFlowJSON,Bits,DestinationAS,DestinationAddress,DestinationPort,DeviceID,EgressBits,EgressPackets,Ethertype,FlowProtocol,FlowTimestamp,NumFlows,PacketID,Packets,Protocol,RuleIDs,SampleRate,SampleRateType,SamplerAddress,SourceAS,SourceAddress,SourcePort,TcpFlags, andTimestamp.
- Firewall events (added):
AISecurityInjectionScore,AISecurityPIICategories,AISecurityTokenCount, andAISecurityUnsafeTopicCategories. - HTTP requests (added):
AISecurityInjectionScore,AISecurityPIICategories,AISecurityTokenCount,AISecurityUnsafeTopicCategories, andSubrequests.
For the complete field definitions for each dataset, refer to Logpush datasets.
Logpush subrequest merging for HTTP requests
When a Cloudflare Worker intercepts a visitor request, it can dispatch additional outbound fetch calls called subrequests. By default, each subrequest generates its own log entry in Logpush, resulting in multiple log lines per visitor request. With subrequest merging enabled, subrequest data is embedded as a nested array field on the parent log record instead.
- New subrequest_merging field on Logpush jobs — Set "merge_subrequests": true when creating or updating an http_requests Logpush job to enable the feature.
- New Subrequests log field — When subrequest merging is enabled, a Subrequests field (
array\<object\>) is added to each parent request log record. Each element in the array contains the standard http_requests fields for that subrequest.
- Applies to the http_requests (zone-scoped) dataset only.
- A maximum of 50 subrequests are merged per parent request. Subrequests beyond this limit are passed through unmodified as individual log entries.
- Subrequests must complete within 5 minutes of the visitor request. Subrequests that exceed this window are passed through unmodified.
- Subrequests that do not qualify appear as separate log entries — no data is lost.
- Subrequest merging is being gradually rolled out and is not yet available on all zones. Contact your account team for concerns or to ensure it is enabled for your zone.
- For more information, refer to Subrequests.
Cloudflare Pipelines as a Logpush destination
Logpush has traditionally been great at delivering Cloudflare logs to a variety of destinations in JSON format. While JSON is flexible and easily readable, it can be inefficient to store and query at scale.
With this release, you can now send your logs directly to Pipelines to ingest, transform, and store your logs in R2 as Parquet files or Apache Iceberg tables managed by R2 Data Catalog. This makes the data footprint more compact and more efficient at querying your logs instantly with R2 SQL or any other query engine that supports Apache Iceberg or Parquet.
Pipelines SQL runs on each log record in-flight, so you can reshape your data before it is written. For example, you can drop noisy fields, redact sensitive values, or derive new columns:
INSERT INTO http_logs_sinkSELECT ClientIP, EdgeResponseStatus, to_timestamp_micros(EdgeStartTimestamp) AS event_time, upper(ClientRequestMethod) AS method, sha256(ClientIP) AS hashed_ipFROM http_logs_streamWHERE EdgeResponseStatus >= 400;Pipelines SQL supports string functions, regex, hashing, JSON extraction, timestamp conversion, conditional expressions, and more. For the full list, refer to the Pipelines SQL reference.
To configure Pipelines as a Logpush destination, refer to Enable Cloudflare Pipelines.
New TenantID and Firewall for AI fields in Logpush datasets
Cloudflare has added new fields to multiple Logpush datasets:
The following Gateway and Zero Trust datasets now include a TenantID field:
- Gateway DNS: Identifies the tenant ID of the DNS request, if it exists.
- Gateway HTTP: Identifies the tenant ID of the HTTP request, if it exists.
- Gateway Network: Identifies the tenant ID of the network session, if it exists.
- Zero Trust Network Sessions: Identifies the tenant ID of the network session, if it exists.
The following datasets now include Firewall for AI fields:
-
FirewallForAIInjectionScore: The score indicating the likelihood of a prompt injection attack in the request.FirewallForAIPIICategories: List of PII categories detected in the request.FirewallForAITokenCount: The number of tokens in the request.FirewallForAIUnsafeTopicCategories: List of unsafe topic categories detected in the request.
For the complete field definitions for each dataset, refer to Logpush datasets.
Logpush to BigQuery — Cloudflare dashboard support
You can now configure Logpush jobs to Google BigQuery directly from the Cloudflare dashboard, in addition to the existing API-based setup.
Previously, setting up a BigQuery Logpush destination required using the Logpush API. Now you can create and manage BigQuery Logpush jobs from the Logpush page in the Cloudflare dashboard by selecting Google BigQuery as the destination and entering your Google Cloud project ID, dataset ID, table ID, and service account credentials.
For more information, refer to Enable Logpush to Google BigQuery.
New ResponseTimeMs field in Gateway DNS Logpush dataset
Cloudflare has added a new field to the Gateway DNS Logpush dataset:
- ResponseTimeMs: Total response time of the DNS request in milliseconds.
For the complete field definitions, refer to Gateway DNS dataset.
BigQuery as Logpush destination
Cloudflare Logpush now supports BigQuery as a native destination.
Logs from Cloudflare can be sent to Google Cloud BigQuery ↗ via Logpush. The destination can be configured through the Logpush UI in the Cloudflare dashboard or by using the Logpush API.
For more information, refer to the Destination Configuration documentation.
Logpush — More granular timestamps
Logpush now supports higher-precision timestamp formats for log output. You can configure jobs to output timestamps at millisecond or nanosecond precision. This is available in both the Logpush UI in the Cloudflare dashboard and the Logpush API.
To use the new formats, set timestamp_format in your Logpush job's output_options:
rfc3339ms—2024-02-17T23:52:01.123Zrfc3339ns—2024-02-17T23:52:01.123456789Z
Default timestamp formats apply unless explicitly set. The dashboard defaults to rfc3339 and the API defaults to unixnano.
For more information, refer to the Log output options documentation.
New MCP Portal Logs dataset and new fields across multiple Logpush datasets in Cloudflare Logs
Cloudflare has added new fields across multiple Logpush datasets:
- MCP Portal Logs: A new dataset with fields including
ClientCountry,ClientIP,ColoCode,Datetime,Error,Method,PortalAUD,PortalID,PromptGetName,ResourceReadURI,ServerAUD,ServerID,ServerResponseDurationMs,ServerURL,SessionID,Success,ToolCallName,UserEmail, andUserID.
- DEX Application Tests:
HTTPRedirectEndMs,HTTPRedirectStartMs,HTTPResponseBody, andHTTPResponseHeaders. - DEX Device State Events:
ExperimentalExtra. - Firewall Events:
FraudUserID. - Gateway HTTP:
AppControlInfoandApplicationStatuses. - Gateway DNS:
InternalDNSDurationMs. - HTTP Requests:
FraudEmailRisk,FraudUserID, andPayPerCrawlStatus. - Network Analytics Logs:
DNSQueryName,DNSQueryType, andPFPCustomTag. - WARP Toggle Changes:
UserEmail. - WARP Config Changes:
UserEmail. - Zero Trust Network Session Logs:
SNI.
For the complete field definitions for each dataset, refer to Logpush datasets.
SentinelOne as Logpush destination
Cloudflare Logpush now supports SentinelOne as a native destination.
Logs from Cloudflare can be sent to SentinelOne AI SIEM ↗ via Logpush. The destination can be configured through the Logpush UI in the Cloudflare dashboard or by using the Logpush API.
For more information, refer to the Destination Configuration documentation.
Logpush Health Dashboards
We’re excited to introduce Logpush Health Dashboards, giving customers real-time visibility into the status, reliability, and performance of their Logpush jobs. Health dashboards make it easier to detect delivery issues, monitor job stability, and track performance across destinations. The dashboards are divided into two sections:
-
Upload Health: See how much data was successfully uploaded, where drops occurred, and how your jobs are performing overall. This includes data completeness, success rate, and upload volume.
-
Upload Reliability – Diagnose issues impacting stability, retries, or latency, and monitor key metrics such as retry counts, upload duration, and destination availability.
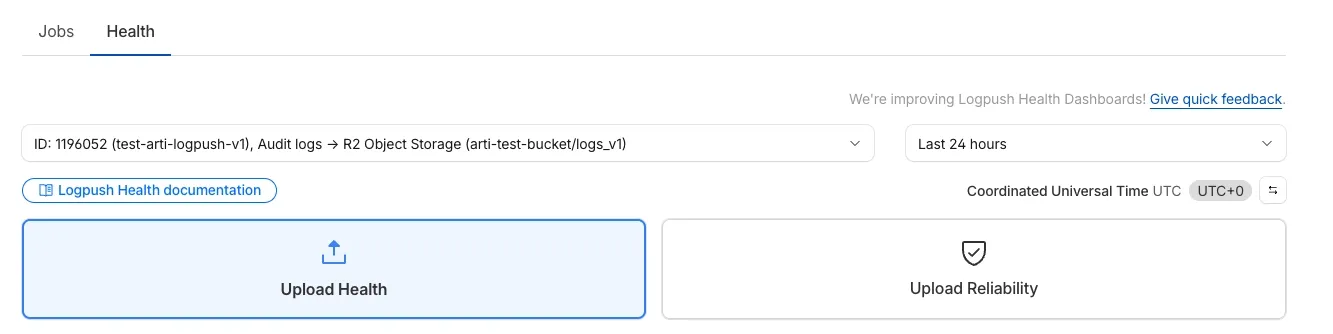
Health Dashboards can be accessed from the Logpush page in the Cloudflare dashboard at the account or zone level, under the Health tab. For more details, refer to our Logpush Health Dashboards documentation, which includes a comprehensive troubleshooting guide to help interpret and resolve common issues.
Logpush Permission Update for Zero Trust Datasets
Permissions for managing Logpush jobs related to Zero Trust datasets (Access, Gateway, and DEX) have been updated to improve data security and enforce appropriate access controls.
To view, create, update, or delete Logpush jobs for Zero Trust datasets, users must now have both of the following permissions:
- Logs Edit
- Zero Trust: PII Read
Azure Sentinel Connector
Logpush now supports integration with Microsoft Sentinel ↗.The new Azure Sentinel Connector built on Microsoft’s Codeless Connector Framework (CCF), is now available. This solution replaces the previous Azure Functions-based connector, offering significant improvements in security, data control, and ease of use for customers. Logpush customers can send logs to Azure Blob Storage and configure this new Sentinel Connector to ingest those logs directly into Microsoft Sentinel.
This upgrade significantly streamlines log ingestion, improves security, and provides greater control:
- Simplified Implementation: Easier for engineering teams to set up and maintain.
- Cost Control: New support for Data Collection Rules (DCRs) allows you to filter and transform logs at ingestion time, offering potential cost savings.
- Enhanced Security: CCF provides a higher level of security compared to the older Azure Functions connector.
- Data Lake Integration: Includes native integration with Data Lake.
Find the new solution here ↗ and refer to the Cloudflare's developer documentation ↗for more information on the connector, including setup steps, supported logs and Microsoft's resources.
Dedicated Egress IP for Logpush
Cloudflare Logpush can now deliver logs from using fixed, dedicated egress IPs. By routing Logpush traffic through a Cloudflare zone enabled with Aegis IP, your log destination only needs to allow Aegis IPs making setup more secure.
Highlights:
- Fixed egress IPs ensure your destination only accepts traffic from known addresses.
- Works with any supported Logpush destination.
- Recommended to use a dedicated zone as a proxy for easier management.
To get started, work with your Cloudflare account team to provision Aegis IPs, then configure your Logpush job to deliver logs through the proxy zone. For full setup instructions, refer to the Logpush documentation.
IBM Cloud Logs as Logpush destination
Cloudflare Logpush now supports IBM Cloud Logs as a native destination.
Logs from Cloudflare can be sent to IBM Cloud Logs ↗ via Logpush. The setup can be done through the Logpush UI in the Cloudflare Dashboard or by using the Logpush API. The integration requires IBM Cloud Logs HTTP Source Address and an IBM API Key. The feature also allows for filtering events and selecting specific log fields.
For more information, refer to Destination Configuration documentation.
Custom fields raw and transformed values support
Custom Fields now support logging both raw and transformed values for request and response headers in the HTTP requests dataset.
These fields are configured per zone and apply to all Logpush jobs in that zone that include request headers, response headers. Each header can be logged in only one format—either raw or transformed—not both.
By default:
- Request headers are logged as raw values
- Response headers are logged as transformed values
These defaults can be overridden to suit your logging needs.
For more information refer to Custom fields documentation
One-click Logpush Setup with R2 Object Storage
We’ve streamlined the Logpush setup process by integrating R2 bucket creation directly into the Logpush workflow!
Now, you no longer need to navigate multiple pages to manually create an R2 bucket or copy credentials. With this update, you can seamlessly configure a Logpush job to R2 in just one click, reducing friction and making setup faster and easier.
This enhancement makes it easier for customers to adopt Logpush and R2.
For more details refer to our Logs documentation.
New fields added to Gateway-related datasets in Cloudflare Logs
Cloudflare has introduced new fields to two Gateway-related datasets in Cloudflare Logs:
-
Gateway HTTP:
ApplicationIDs,ApplicationNames,CategoryIDs,CategoryNames,DestinationIPContinentCode,DestinationIPCountryCode,ProxyEndpoint,SourceIPContinentCode,SourceIPCountryCode,VirtualNetworkID, andVirtualNetworkName. -
Gateway Network:
ApplicationIDs,ApplicationNames,DestinationIPContinentCode,DestinationIPCountryCode,ProxyEndpoint,SourceIPContinentCode,SourceIPCountryCode,TransportProtocol,VirtualNetworkID, andVirtualNetworkName.