Debugging and logging
Access your Functions logs by using the Cloudflare dashboard or the Wrangler CLI.
Logs are a powerful debugging tool that can help you test and monitor the behavior of your Pages Functions once they have been deployed. Logs are available for every deployment of your Pages project.
Logs provide detailed information about events and can give insight into:
- Successful or failed requests to your Functions.
- Uncaught exceptions thrown by your Functions.
- Custom
console.logs declared within your Functions. - Production issues that cannot be easily reproduced.
- Real-time view of incoming requests to your application.
There are two ways to start a logging session:
- Run
wrangler pages deployment tailin your terminal. - Use the Cloudflare dashboard.
Custom logs are console.log() statements that you can add yourself inside your Functions. When streaming logs for deployments that contain these Functions, the statements will appear in both wrangler pages deployment tail and dashboard outputs.
Below is an example of a custom console.log statement inside a Pages Function:
export async function onRequest(context) { console.log( `[LOGGING FROM /hello]: Request came from ${context.request.url}`, );
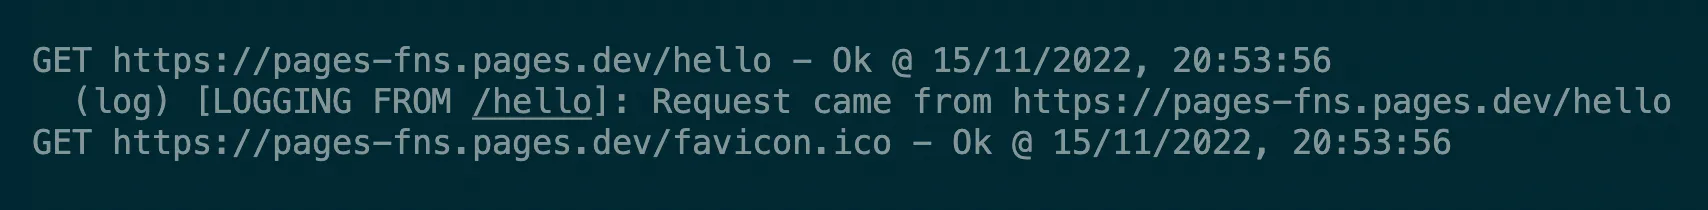
return new Response("Hello, world!");}After you deploy the code above, run wrangler pages deployment tail in your terminal. Then access the route at which your Function lives. Your terminal will display:
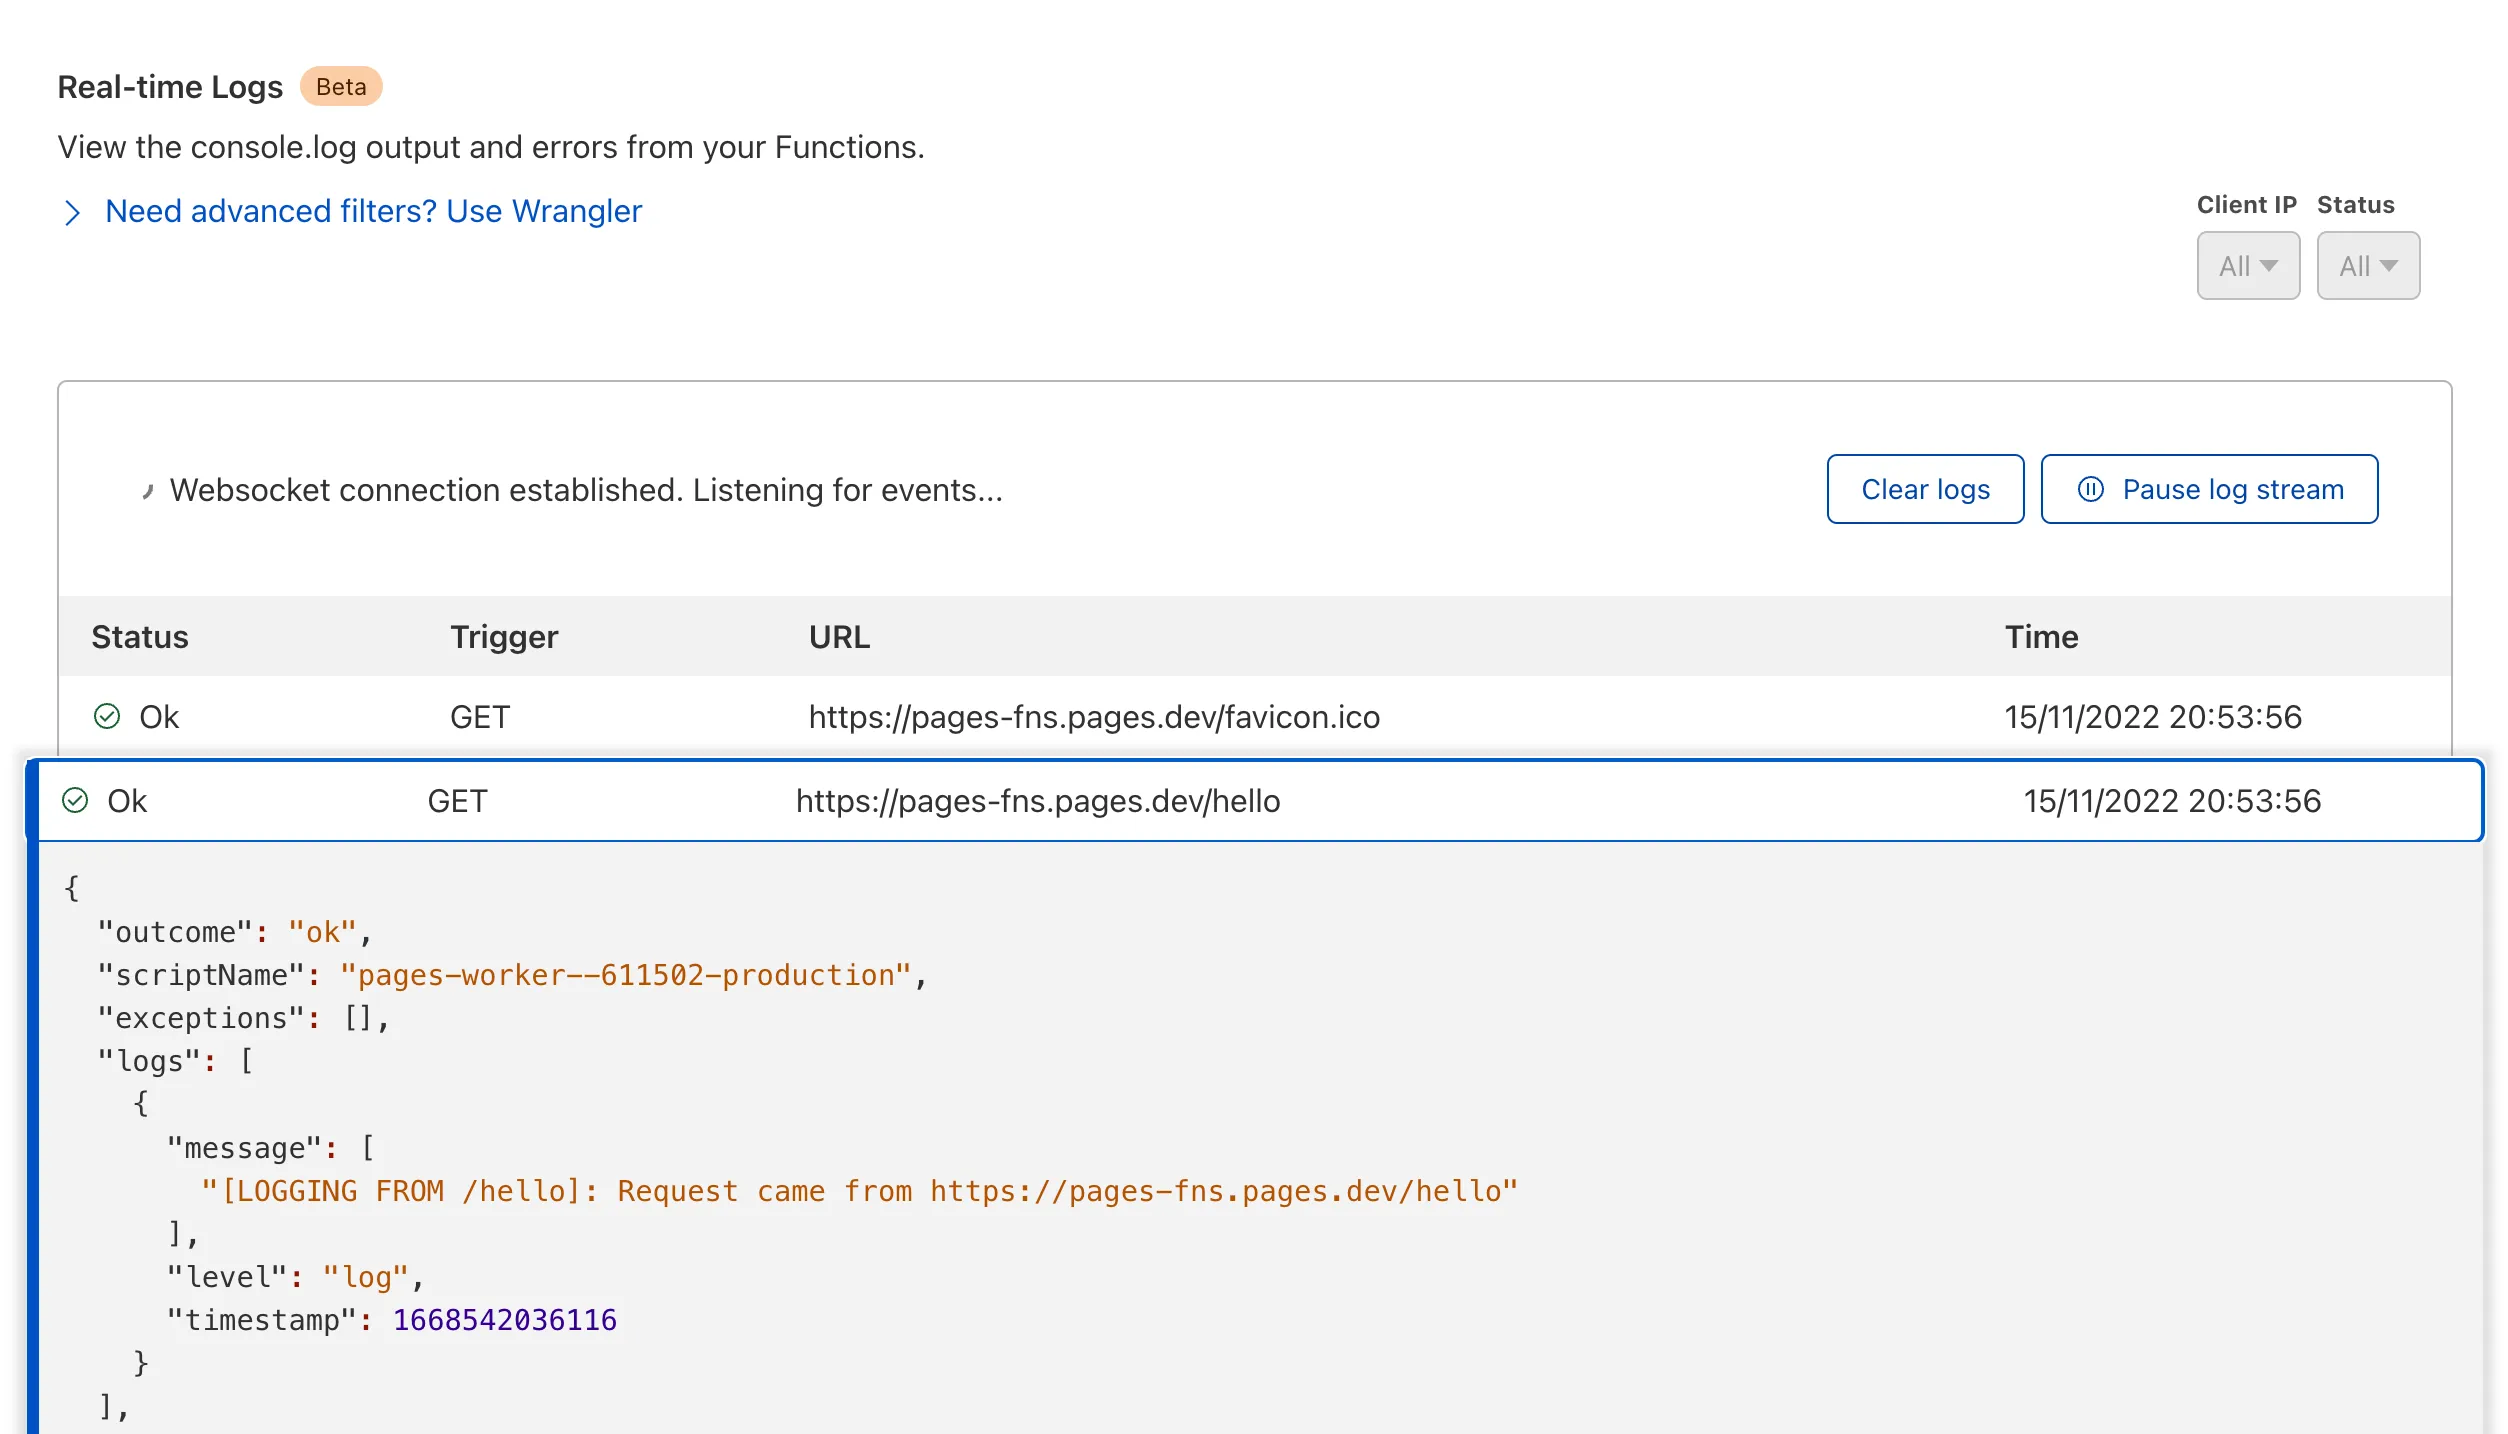
Your dashboard will display:
wrangler pages deployment tail enables developers to livestream logs for a specific project and deployment.
To get started, run wrangler pages deployment tail in your Pages project directory. This will log any incoming requests to your application in your local terminal.
The output of each wrangler pages deployment tail log is a structured JSON object:
{ "outcome": "ok", "scriptName": null, "exceptions": [ { "stack": " at src/routes/index.tsx17:4\n at new Promise (<anonymous>)\n", "name": "Error", "message": "An error has occurred", "timestamp": 1668542036110 } ], "logs": [], "eventTimestamp": 1668542036104, "event": { "request": { "url": "https://pages-fns.pages.dev", "method": "GET", "headers": {}, "cf": {} }, "response": { "status": 200 } }, "id": 0}wrangler pages deployment tail allows you to customize a logging session to better suit your needs. Refer to the wrangler pages deployment tail documentation for available configuration options.
To view logs for your production or preview environments associated with any deployment:
-
In the Cloudflare dashboard, go to the Workers & Pages page.
Go to Workers & Pages -
Select your Pages project, go to the deployment you want to view logs for and select View details > Functions.
Logging is available for all customers (Free, Paid, Enterprise).
The following limits apply to Functions logs:
- Logs are not stored. You can start and stop the stream at any time to view them, but they do not persist.
- Logs will not display if the Function’s requests per second are over 100 for the last five minutes.
- Logs from any Durable Objects your Functions bind to will show up in the Cloudflare dashboard.
- A maximum of 10 clients can view a deployment’s logs at one time. This can be a combination of either dashboard sessions or
wrangler pages deployment tailcalls.
If you're debugging an uncaught exception, you might find that the stack traces ↗ in your logs contain line numbers to generated JavaScript files. Using Pages' support for source maps ↗ you can get stack traces that match with the line numbers and symbols of your original source code.
Refer to Source maps and stack traces for an in-depth explanation.