

OAuth allows third-party applications to access your Cloudflare account on your behalf — like when Wrangler deploys Workers or when monitoring tools read your analytics. You now have granular control over which accounts these applications can access, plus the ability to revoke access anytime.
When authorizing an OAuth application, you can now select specific accounts instead of granting access to all your accounts:
- Account-by-account selection — Choose exactly which accounts the application can access
- "All accounts" option — Still available for trusted tools like Wrangler This gives you precise control who can access your data.
The OAuth consent screen now shows:
- What the application can access — Explicit list of permissions being requested
- Who created the application — Application owner and contact information
- Which accounts you're authorizing — Checkboxes for account selection
Manage authorized OAuth applications from your profile:
- See all connected apps — View every OAuth application with access to your accounts
- Review permissions and scope — Check what each application can do and which accounts it can access
- Revoke instantly — Remove access with one click when you no longer need it To manage your OAuth applications, navigate to Profile > Access Management > Connected Applications ↗.
These updates give you:
- Granular control — Authorize apps per-account instead of all-or-nothing
- Transparency — Know exactly what you're authorizing before you consent
- Security — Limit blast radius by restricting access to only necessary accounts
- Easy cleanup — Revoke access when applications are no longer needed
Read more about these improvements in our blog post: Improving the OAuth consent experience ↗.
You can now configure Logpush jobs to Google BigQuery directly from the Cloudflare dashboard, in addition to the existing API-based setup.
Previously, setting up a BigQuery Logpush destination required using the Logpush API. Now you can create and manage BigQuery Logpush jobs from the Logpush page in the Cloudflare dashboard by selecting Google BigQuery as the destination and entering your Google Cloud project ID, dataset ID, table ID, and service account credentials.
For more information, refer to Enable Logpush to Google BigQuery.
Cloudflare API tokens now include identifiable patterns that enable secret scanning tools to automatically detect them when leaked in code repositories, configuration files, or other public locations.
API tokens generated by Cloudflare now follow a standardized format that secret scanning tools can recognize. When a Cloudflare token is accidentally committed to GitHub, GitLab, or another platform with secret scanning enabled, the tool will flag it and alert you.
Leaked credentials are a common security risk. By making Cloudflare tokens detectable by scanning tools, you can:
- Detect leaks faster — Get notified immediately when a token is exposed.
- Reduce risk window — Exposed tokens are deactivated immediately, before they can be exploited.
- Automate security — Leverage existing secret scanning infrastructure without additional configuration.
When a third-party secret scanning tool detects a leaked Cloudflare API token:
- Cloudflare immediately deactivates the token to prevent unauthorized access.
- The token creator receives an email notification alerting them to the leak.
- The token is marked as "Exposed" in the Cloudflare dashboard.
- You can then roll or delete the token from the token management pages.
- GitHub Secret Scanning — Automatically enabled for public repositories
For more information on token formats and secret scanning, refer to API token formats.
-
Cloudflare has officially launched a redesigned "Get Help" Support Portal to eliminate friction and get you to a resolution faster. Previously, navigating support meant clicking through multiple tiles, categorizing your own technical issues across 50+ conditional fields, and translating your problem into Cloudflare's internal taxonomy.
The new experience replaces that complexity with a personalized front door built around your specific account plan. Whether you are under a DDoS attack or have a simple billing question, the portal now presents a single, clean page that surfaces the direct paths available to you — such as "Ask AI", "Chat with a human", or "Community" — without the manual triage.
- One Page, Clear Choices: No more navigating a grid of overlapping categories. The portal now uses action cards tailored to your plan (Free, Pro, Business, or Enterprise), ensuring you only see the support channels you can actually use.
- A Radically Simpler Support Form: We've reduced the ticket submission process from four+ screens and 50+ fields to a single screen with five critical inputs. You describe the issue in your own words, and our backend handles the categorization.
- AI-Driven Triage: Using Cloudflare Workers AI ↗ and Vectorize ↗, the portal now automatically generates case subjects and predicts product categories.
Behind the scenes, we've moved the complexity from the user to our own developer stack. When you describe an issue, we use semantic embeddings to capture intent rather than just keywords.
By leveraging case-based reasoning, our system compares your request against millions of resolved cases to route your inquiry to the specialist best equipped to help. This ensures that while the front-end experience is simpler for you, the back-end routing is more accurate than ever.
To learn more, refer to the Support documentation or select Get Help directly in the Cloudflare Dashboard ↗.
We're announcing the public beta of Organizations for enterprise customers, a new top-level Cloudflare container that lets Cloudflare customers manage multiple accounts, members, analytics, and shared policies from one centralized location.
What's New
Organizations [BETA]: Organizations are a new top-level container for centrally managing multiple accounts. Each Organization supports up to 500 accounts and 5000 zones, giving larger teams a single place to administer resources at scale.
Self-serve onboarding: Enterprise customers can create an Organization in the dashboard and assign accounts where they are already Super Administrators.
Centralized Account Management: At launch, every Organization member has the Organization Super Admin role. Organization Super Admins can invite other users and manage any child account under the Organization implicitly. Shared policies: Share WAF or Gateway policies across multiple accounts within your Organization to simplify centralized policy management. Implicit access: Members of an Organization automatically receive Super Administrator permissions across child accounts, removing the need for explicit membership on each account. Additional Org-level roles will be available over the course of the year.
Unified analytics: View, filter, and download aggregate HTTP analytics across all Organization child accounts from a single dashboard for centralized visibility into traffic patterns and security events.
Terraform provider support: Manage Organizations with infrastructure as code from day one. Provision organizations, assign accounts, and configure settings programmatically with the Cloudflare Terraform provider ↗.
Shared policies: Share WAF or Gateway policies across multiple accounts within your Organization to simplify centralized policy management.
For more info:
Cloudflare has added a new field to the Gateway DNS Logpush dataset:
- ResponseTimeMs: Total response time of the DNS request in milliseconds.
For the complete field definitions, refer to Gateway DNS dataset.
Cloudflare Logpush now supports BigQuery as a native destination.
Logs from Cloudflare can be sent to Google Cloud BigQuery ↗ via Logpush. The destination can be configured through the Logpush UI in the Cloudflare dashboard or by using the Logpush API.
For more information, refer to the Destination Configuration documentation.
Two new fields are now available in rule expressions that surface Layer 4 transport telemetry from the client connection. Together with the existing
cf.timings.client_tcp_rtt_msecfield, these fields give you a complete picture of connection quality for both TCP and QUIC traffic — enabling transport-aware rules without requiring any client-side changes.Previously, QUIC RTT and delivery rate data was only available via the
Server-Timing: cfL4response header. These new fields make the same data available directly in rule expressions, so you can use them in Transform Rules, WAF Custom Rules, and other phases that support dynamic fields.Field Type Description cf.timings.client_quic_rtt_msecInteger The smoothed QUIC round-trip time (RTT) between Cloudflare and the client in milliseconds. Only populated for QUIC (HTTP/3) connections. Returns 0for TCP connections.cf.edge.l4.delivery_rateInteger The most recent data delivery rate estimate for the client connection, in bytes per second. Returns 0when L4 statistics are not available for the request.Use a request header transform rule to tag requests from high-latency connections, so your origin can serve a lighter page variant:
Rule expression:
cf.timings.client_tcp_rtt_msec > 200 or cf.timings.client_quic_rtt_msec > 200Header modifications:
Operation Header name Value Set X-High-Latencytruecf.edge.l4.delivery_rate > 0 and cf.edge.l4.delivery_rate < 100000For more information, refer to Request Header Transform Rules and the fields reference.
Logpush now supports higher-precision timestamp formats for log output. You can configure jobs to output timestamps at millisecond or nanosecond precision. This is available in both the Logpush UI in the Cloudflare dashboard and the Logpush API.
To use the new formats, set
timestamp_formatin your Logpush job'soutput_options:rfc3339ms—2024-02-17T23:52:01.123Zrfc3339ns—2024-02-17T23:52:01.123456789Z
Default timestamp formats apply unless explicitly set. The dashboard defaults to
rfc3339and the API defaults tounixnano.For more information, refer to the Log output options documentation.
Cloudflare now exposes four new fields in the Transform Rules phase that encode client certificate data in RFC 9440 ↗ format. Previously, forwarding client certificate information to your origin required custom parsing of PEM-encoded fields or non-standard HTTP header formats. These new fields produce output in the standardized
Client-CertandClient-Cert-Chainheader format defined by RFC 9440, so your origin can consume them directly without any additional decoding logic.Each certificate is DER-encoded, Base64-encoded, and wrapped in colons. For example,
:MIIDsT...Vw==:. A chain of intermediates is expressed as a comma-separated list of such values.Field Type Description cf.tls_client_auth.cert_rfc9440String The client leaf certificate in RFC 9440 format. Empty if no client certificate was presented. cf.tls_client_auth.cert_rfc9440_too_largeBoolean trueif the leaf certificate exceeded 10 KB and was omitted. In practice this will almost always befalse.cf.tls_client_auth.cert_chain_rfc9440String The intermediate certificate chain in RFC 9440 format as a comma-separated list. Empty if no intermediate certificates were sent or if the chain exceeded 16 KB. cf.tls_client_auth.cert_chain_rfc9440_too_largeBoolean trueif the intermediate chain exceeded 16 KB and was omitted.The chain encoding follows the same ordering as the TLS handshake: the certificate closest to the leaf appears first, working up toward the trust anchor. The root certificate is not included.
Add a request header transform rule to set the
Client-CertandClient-Cert-Chainheaders on requests forwarded to your origin server. For example, to forward headers for verified, non-revoked certificates:Rule expression:
cf.tls_client_auth.cert_verified and not cf.tls_client_auth.cert_revokedHeader modifications:
Operation Header name Value Set Client-Certcf.tls_client_auth.cert_rfc9440Set Client-Cert-Chaincf.tls_client_auth.cert_chain_rfc9440To get the most out of these fields, upload your client CA certificate to Cloudflare so that Cloudflare validates the client certificate at the edge and populates
cf.tls_client_auth.cert_verifiedandcf.tls_client_auth.cert_revoked.For more information, refer to Mutual TLS authentication, Request Header Transform Rules, and the fields reference.
AI Crawl Control now supports extending the underlying WAF rule with custom modifications. Any changes you make directly in the WAF custom rules editor — such as adding path-based exceptions, extra user agents, or additional expression clauses — are preserved when you update crawler actions in AI Crawl Control.
If the WAF rule expression has been modified in a way AI Crawl Control cannot parse, a warning banner appears on the Crawlers page with a link to view the rule directly in WAF.
For more information, refer to WAF rule management.
In the Cloudflare One dashboard, the overview page for a specific Cloudflare Tunnel now shows all replicas of that tunnel and supports streaming logs from multiple replicas at once.

Previously, you could only stream logs from one replica at a time. With this update:
- Replicas on the tunnel overview — All active replicas for the selected tunnel now appear on that tunnel's overview page under Connectors. Select any replica to stream its logs.
- Multi-connector log streaming — Stream logs from multiple replicas simultaneously, making it easier to correlate events across your infrastructure during debugging or incident response. To try it out, log in to Cloudflare One ↗ and go to Networks > Connectors > Cloudflare Tunnels. Select View logs next to the tunnel you want to monitor.
For more information, refer to Tunnel log streams and Deploy replicas.
Service Key authentication for the Cloudflare API is deprecated. Service Keys will stop working on September 30, 2026.
API Tokens replace Service Keys with fine-grained permissions, expiration, and revocation.
Replace any use of the
X-Auth-User-Service-Keyheader with an API Token scoped to the permissions your integration requires.If you use
cloudflared, update to a version from November 2022 or later. These versions already use API Tokens.If you use origin-ca-issuer ↗, update to a version that supports API Token authentication.
For more information, refer to API deprecations.
You can now manage Cloudflare Tunnels directly from Wrangler, the CLI for the Cloudflare Developer Platform. The new
wrangler tunnelcommands let you create, run, and manage tunnels without leaving your terminal.
Available commands:
wrangler tunnel create— Create a new remotely managed tunnel.wrangler tunnel list— List all tunnels in your account.wrangler tunnel info— Display details about a specific tunnel.wrangler tunnel delete— Delete a tunnel.wrangler tunnel run— Run a tunnel using the cloudflared daemon.wrangler tunnel quick-start— Start a free, temporary tunnel without an account using Quick Tunnels.
Wrangler handles downloading and managing the cloudflared binary automatically. On first use, you will be prompted to download
cloudflaredto a local cache directory.These commands are currently experimental and may change without notice.
To get started, refer to the Wrangler tunnel commands documentation.
Cloudflare dashboard SCIM provisioning now supports Authentik ↗ as an identity provider, joining Okta and Microsoft Entra ID as explicitly supported providers.
Customers can now sync users and group information from Authentik to Cloudflare, apply Permission Policies to those groups, and manage the lifecycle of users & groups directly from your Authentik Identity Provider.
For more information:
Cloudflare dashboard SCIM provisioning operations are now captured in Audit Logs v2, giving you visibility into user and group changes made by your identity provider.
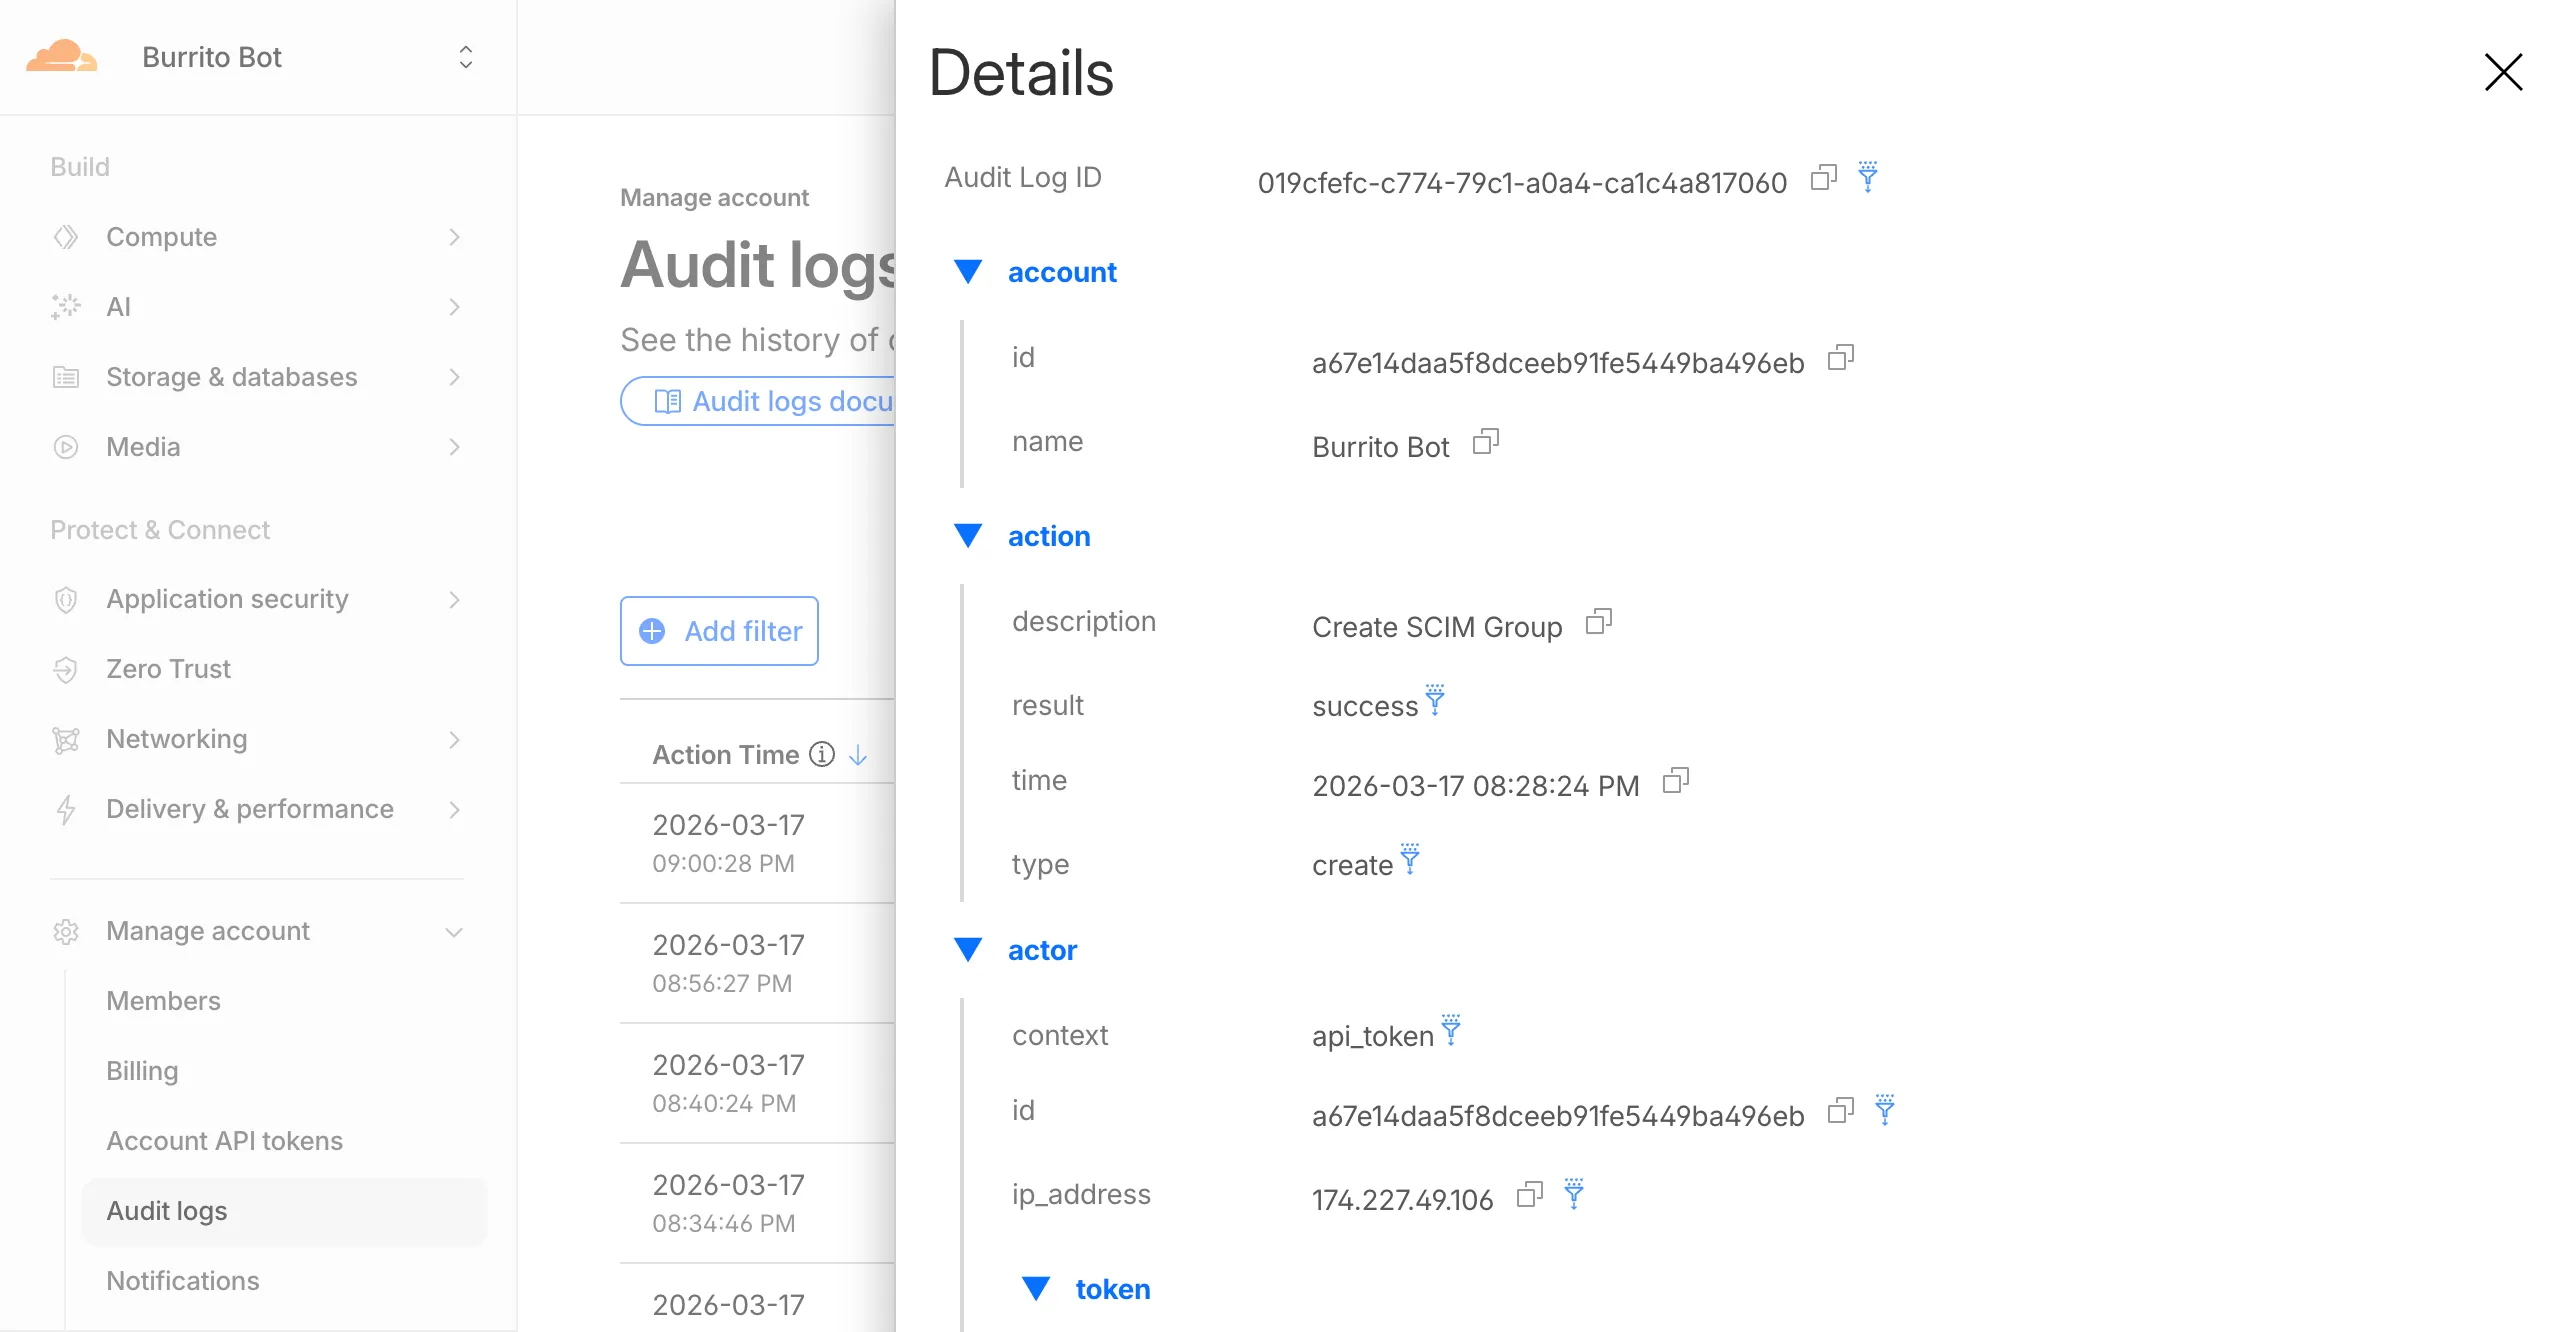
Logged actions:
Action Type Description Create SCIM User User provisioned from IdP Replace SCIM User User fully replaced (PUT) Update SCIM User User attributes modified (PATCH) Delete SCIM User Member deprovisioned Create SCIM Group Group provisioned from IdP Update SCIM Group Group membership or attributes modified Delete SCIM Group Group deprovisioned For more details, refer to the Audit Logs v2 documentation.
The
cf.timings.worker_msecfield is now available in the Ruleset Engine. This field reports the wall-clock time that a Cloudflare Worker spent handling a request, measured in milliseconds.You can use this field to identify slow Worker executions, detect performance regressions, or build rules that respond differently based on Worker processing time, such as logging requests that exceed a latency threshold.
Field Type Description cf.timings.worker_msecInteger The time spent executing a Cloudflare Worker in milliseconds. Returns 0if no Worker was invoked.Example filter expression:
cf.timings.worker_msec > 500For more information, refer to the Fields reference.
Cloudflare-generated 1xxx error responses now include a standard
Retry-AfterHTTP header when the error is retryable. Agents and HTTP clients can read the recommended wait time from response headers alone — no body parsing required.Seven retryable error codes now emit
Retry-After:Error code Retry-After (seconds) Error name 1004 120 DNS resolution error 1005 120 Banned zone 1015 30 Rate limited 1033 120 Argo Tunnel error 1038 60 HTTP headers limit exceeded 1200 60 Cache connection limit 1205 5 Too many redirects The header value matches the existing
retry_afterbody field in JSON and Markdown responses.If a WAF rate limiting rule has already set a dynamic
Retry-Aftervalue on the response, that value takes precedence.Available for all zones on all plans.
Check for the header on any retryable error:
Terminal window curl -s --compressed -D - -o /dev/null -H "Accept: application/json" -A "TestAgent/1.0" -H "Accept-Encoding: gzip, deflate" "<YOUR_DOMAIN>/cdn-cgi/error/1015" | grep -i retry-afterReferences:
Cloudflare-generated 1xxx errors now return structured JSON when clients send
Accept: application/jsonorAccept: application/problem+json. JSON responses follow RFC 9457 (Problem Details for HTTP APIs) ↗, so any HTTP client that understands Problem Details can parse the base members without Cloudflare-specific code.The Markdown frontmatter field
http_statushas been renamed tostatus. Agents consuming Markdown frontmatter should update parsers accordingly.JSON format. Clients sending
Accept: application/jsonorAccept: application/problem+jsonnow receive a structured JSON object with the same operational fields as Markdown frontmatter, plus RFC 9457 standard members.RFC 9457 standard members (JSON only):
type— URI pointing to Cloudflare documentation for the specific error codestatus— HTTP status code (matching the response status)title— short, human-readable summarydetail— human-readable explanation specific to this occurrenceinstance— Ray ID identifying this specific error occurrence
Field renames:
http_status->status(JSON and Markdown)what_happened->detail(JSON only — Markdown prose sections are unchanged)
Content-Type mirroring. Clients sending
Accept: application/problem+jsonreceiveContent-Type: application/problem+json; charset=utf-8back;Accept: application/jsonreceivesapplication/json; charset=utf-8. Same body in both cases.Request header sent Response format Accept: application/jsonJSON ( application/jsoncontent type)Accept: application/problem+jsonJSON ( application/problem+jsoncontent type)Accept: application/json, text/markdown;q=0.9JSON Accept: text/markdownMarkdown Accept: text/markdown, application/jsonMarkdown (equal q, first-listed wins)Accept: */*HTML (default) Available now for Cloudflare-generated 1xxx errors.
Terminal window curl -s --compressed -H "Accept: application/json" -A "TestAgent/1.0" -H "Accept-Encoding: gzip, deflate" "<YOUR_DOMAIN>/cdn-cgi/error/1015" | jq .Terminal window curl -s --compressed -H "Accept: application/problem+json" -A "TestAgent/1.0" -H "Accept-Encoding: gzip, deflate" "<YOUR_DOMAIN>/cdn-cgi/error/1015" | jq .References:
Cloudflare Log Explorer now allows you to customize exactly which data fields are ingested and stored when enabling or managing log datasets.
Previously, ingesting logs often meant taking an "all or nothing" approach to data fields. With Ingest Field Selection, you can now choose from a list of available and recommended fields for each dataset. This allows you to reduce noise, focus on the metrics that matter most to your security and performance analysis, and manage your data footprint more effectively.
- Granular control: Select only the specific fields you need when enabling a new dataset.
- Dynamic updates: Update fields for existing, already enabled logstreams at any time.
- Historical consistency: Even if you disable a field later, you can still query and receive results for that field for the period it was captured.
- Data integrity: Core fields, such as
Timestamp, are automatically retained to ensure your logs remain searchable and chronologically accurate.
When configuring a dataset via the dashboard or API, you can define a specific set of fields. The
Timestampfield remains mandatory to ensure data indexability.{"dataset": "firewall_events","enabled": true,"fields": ["Timestamp","ClientRequestHost","ClientIP","Action","EdgeResponseStatus","OriginResponseStatus"]}For more information, refer to the Log Explorer documentation.
Audit Logs v2 is now generally available to all Cloudflare customers.

Audit Logs v2 provides a unified and standardized system for tracking and recording all user and system actions across Cloudflare products. Built on Cloudflare's API Shield / OpenAPI gateway, logs are generated automatically without requiring manual instrumentation from individual product teams, ensuring consistency across ~95% of Cloudflare products.
What's available at GA:
- Standardized logging — Audit logs follow a consistent format across all Cloudflare products, making it easier to search, filter, and investigate activity.
- Expanded product coverage — ~95% of Cloudflare products covered, up from ~75% in v1.
- Granular filtering — Filter by actor, action type, action result, resource, raw HTTP method, zone, and more. Over 20 filter parameters available via the API.
- Enhanced context — Each log entry includes authentication method, interface (API or dashboard), Cloudflare Ray ID, and actor token details.
- 18-month retention — Logs are retained for 18 months. Full history is accessible via the API or Logpush.
Access:
- Dashboard: Go to Manage Account > Audit Logs. Audit Logs v2 is shown by default.
- API:
GET https://api.cloudflare.com/client/v4/accounts/{account_id}/logs/audit - Logpush: Available via the
audit_logs_v2account-scoped dataset.
Important notes:
- Approximately 30 days of logs from the Beta period (back to ~February 8, 2026) are available at GA. These Beta logs will expire on ~April 9, 2026. Logs generated after GA will be retained for the full 18 months. Older logs remain available in Audit Logs v1.
- The UI query window is limited to 90 days for performance reasons. Use the API or Logpush for access to the full 18-month history.
GETrequests (view actions) and4xxerror responses are not logged at GA.GETlogging will be selectively re-enabled for sensitive read operations in a future release.- Audit Logs v1 continues to run in parallel. A deprecation timeline will be communicated separately.
- Before and after values — the ability to see what a value changed from and to — is a highly requested feature and is on our roadmap for a post-GA release. In the meantime, we recommend using Audit Logs v1 for before and after values. Audit Logs v1 will continue to run in parallel until this feature is available in v2.
For more details, refer to the Audit Logs v2 documentation.
Cloudflare has added new fields across multiple Logpush datasets:
- MCP Portal Logs: A new dataset with fields including
ClientCountry,ClientIP,ColoCode,Datetime,Error,Method,PortalAUD,PortalID,PromptGetName,ResourceReadURI,ServerAUD,ServerID,ServerResponseDurationMs,ServerURL,SessionID,Success,ToolCallName,UserEmail, andUserID.
- DEX Application Tests:
HTTPRedirectEndMs,HTTPRedirectStartMs,HTTPResponseBody, andHTTPResponseHeaders. - DEX Device State Events:
ExperimentalExtra. - Firewall Events:
FraudUserID. - Gateway HTTP:
AppControlInfoandApplicationStatuses. - Gateway DNS:
InternalDNSDurationMs. - HTTP Requests:
FraudEmailRisk,FraudUserID, andPayPerCrawlStatus. - Network Analytics Logs:
DNSQueryName,DNSQueryType, andPFPCustomTag. - WARP Toggle Changes:
UserEmail. - WARP Config Changes:
UserEmail. - Zero Trust Network Session Logs:
SNI.
For the complete field definitions for each dataset, refer to Logpush datasets.
- MCP Portal Logs: A new dataset with fields including
Cloudflare now returns structured Markdown responses for Cloudflare-generated 1xxx errors when clients send
Accept: text/markdown.Each response includes YAML frontmatter plus guidance sections (
What happened/What you should do) so agents can make deterministic retry and escalation decisions without parsing HTML.In measured 1,015 comparisons, Markdown reduced payload size and token footprint by over 98% versus HTML.
Included frontmatter fields:
error_code,error_name,error_category,http_statusray_id,timestamp,zonecloudflare_error,retryable,retry_after(when applicable),owner_action_required
Default behavior is unchanged: clients that do not explicitly request Markdown continue to receive HTML error pages.
Cloudflare uses standard HTTP content negotiation on the
Acceptheader.Accept: text/markdown-> MarkdownAccept: text/markdown, text/html;q=0.9-> MarkdownAccept: text/*-> MarkdownAccept: */*-> HTML (default browser behavior)
When multiple values are present, Cloudflare selects the highest-priority supported media type using
qvalues. If Markdown is not explicitly preferred, HTML is returned.Available now for Cloudflare-generated 1xxx errors.
Terminal window curl -H "Accept: text/markdown" https://<your-domain>/cdn-cgi/error/1015Reference: Cloudflare 1xxx error documentation
Cloudflare Tunnel is now available in the main Cloudflare Dashboard at Networking > Tunnels ↗, bringing first-class Tunnel management to developers using Tunnel for securing origin servers.

This new experience provides everything you need to manage Tunnels for public applications, including:
- Full Tunnel lifecycle management: Create, configure, delete, and monitor all your Tunnels in one place.
- Native integrations: View Tunnels by name when configuring DNS records and Workers VPC — no more copy-pasting UUIDs.
- Real-time visibility: Monitor replicas and Tunnel health status directly in the dashboard.
- Routing map: Manage all ingress routes for your Tunnel, including public applications, private hostnames, private CIDRs, and Workers VPC services, from a single interactive interface.
Core Dashboard: Navigate to Networking > Tunnels ↗ to manage Tunnels for:
- Securing origin servers and public applications with CDN, WAF, Load Balancing, and DDoS protection
- Connecting Workers to private services via Workers VPC
Cloudflare One Dashboard: Navigate to Zero Trust > Networks > Connectors ↗ to manage Tunnels for:
- Securing your public applications with Zero Trust access policies
- Connecting users to private applications
- Building a private mesh network
Both dashboards provide complete Tunnel management capabilities — choose based on your primary workflow.
New to Tunnel? Learn how to get started with Cloudflare Tunnel or explore advanced use cases like securing SSH servers or running Tunnels in Kubernetes.
The Server-Timing header now includes a new
cfWorkermetric that measures time spent executing Cloudflare Workers, including any subrequests performed by the Worker. This helps developers accurately identify whether high Time to First Byte (TTFB) is caused by Worker processing or slow upstream dependencies.Previously, Worker execution time was included in the
edgemetric, making it harder to identify true edge performance. The newcfWorkermetric provides this visibility:Metric Description edgeTotal time spent on the Cloudflare edge, including Worker execution originTime spent fetching from the origin server cfWorkerTime spent in Worker execution, including subrequests but excluding origin fetch time Server-Timing: cdn-cache; desc=DYNAMIC, edge; dur=20, origin; dur=100, cfWorker; dur=7In this example, the edge took 20ms, the origin took 100ms, and the Worker added just 7ms of processing time.
The
cfWorkermetric is enabled by default if you have Real User Monitoring (RUM) enabled. Otherwise, you can enable it using Rules.This metric is particularly useful for:
- Performance debugging: Quickly determine if latency is caused by Worker code, external API calls within Workers, or slow origins.
- Optimization targeting: Identify which component of your request path needs optimization.
- Real User Monitoring (RUM): Access detailed timing breakdowns directly from response headers for client-side analytics.
For more information about Server-Timing headers, refer to the W3C Server Timing specification ↗.