
Cloudflare has updated Logpush datasets:
- DEX Device State Events (added):
DeviceRegistrationProfileID. - Gateway HTTP (added):
AddedHeaders,DeletedHeaders, andSetHeaders. - HTTP requests (added):
MatchedRules.
For the complete field definitions for each dataset, refer to Logpush datasets.
- DEX Device State Events (added):
Starting with
cloudflaredversion 2026.5.2 ↗, Cloudflare Tunnel automates the entire connectivity pre-checks workflow directly inside the binary. Previously, customers had to installdigandnetcatand run those commands by hand to verify their environment. Nowcloudflareddoes it natively at startup — and surfaces actionable remediation when something is blocked.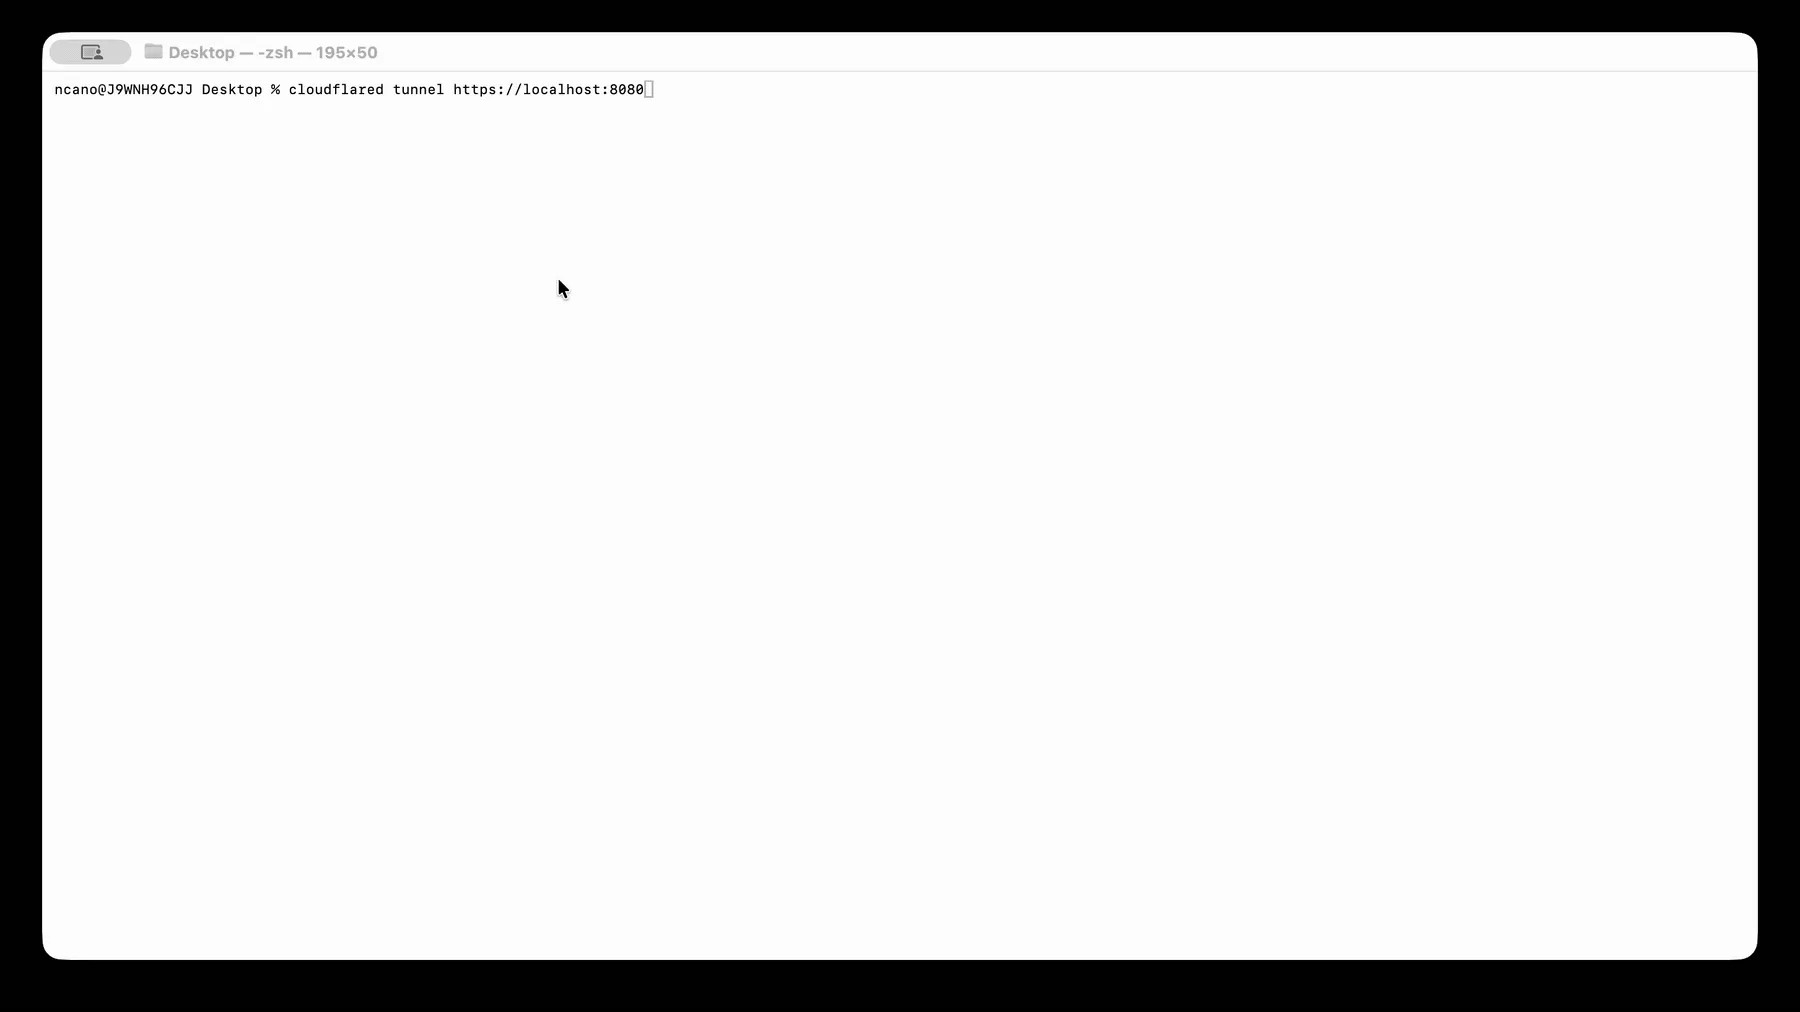
On every
cloudflared tunnel run(andcloudflared tunnel diag), the binary now natively checks:- DNS resolution —
region1.v2.argotunnel.comandregion2.v2.argotunnel.comresolve to valid Cloudflare IPs. - Transport connectivity — outbound
UDP (QUIC)andTCP (HTTP/2)on port7844. - Management API — outbound
TCP/443toapi.cloudflare.comfor software updates.
Results are printed in a scannable CLI table with three states:
- ✅ Pass — the check succeeded.
- ⚠️ Warn — a non-blocking issue, for example the Management API is unreachable so automatic updates will not work, but the tunnel will still come up.
- ❌ Fail — a blocking issue, with a specific remediation hint (for example,
Allow outbound UDP on port 7844).
If DNS is unresolvable, or both UDP and TCP fail on port 7844,
cloudflaredexits early with the failure rather than looping on opaquefailed to dialerrors.Pre-checks now run automatically on every start, which also catches regressions like overnight firewall policy changes — no need to remember to rerun the troubleshooting guide.
To get the new behavior, upgrade
cloudflaredto version2026.5.2or later. For more details, refer to the Connectivity pre-checks documentation.- DNS resolution —
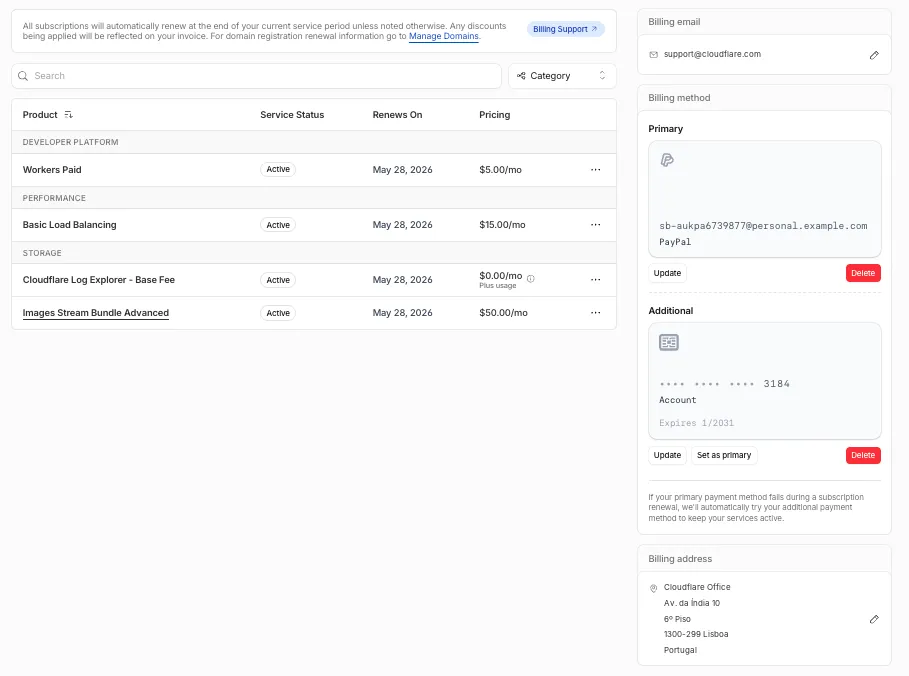
The Billing Profile now has a modern UI and a single space that unifies billing information, payment method management and an enhanced subscriptions view under a single Subscriptions tab.
The Subscriptions tab brings billing information, payment method management, and your subscriptions together in one place. The payment management and Pay overdue balances flows now use the latest checkout as product purchase flows, so you can pay with Apple Pay, Google Pay, Link, and Instant Bank Payments via Link alongside cards and PayPal.
New cards complete 3D Secure authentication when the issuer requires it — for example, the EU under PSD2 and India under RBI.
For details, refer to the Billing Home documentation.
You can now scope Cloudflare permissions to individual Cloudflare Tunnel instances and Cloudflare Mesh nodes. Administrators can delegate access to specific Tunnels or Mesh nodes without granting account-wide control over private networking.
When you add a member or create a permission policy, the resource picker now lists Cloudflare Tunnel instances and Cloudflare Mesh nodes as scopable resource types. You can:
- Grant a read-only role on a single Cloudflare Tunnel instance to a support operator for log streaming and diagnostics — without exposing other Tunnels or destructive actions.
- Grant a write role on a specific Cloudflare Mesh node to an application team — without giving them access to the rest of your private network.
- Scope a single policy to one or many Tunnels and Mesh nodes at once.
Granular permissions are a parallel layer to existing account-level roles — they do not replace them.
- Existing account-level roles continue to work. A member with
Cloudflare AccessorCloudflare Zero Trustretains write access to every Tunnel and Mesh node in the account. This ensures backward compatibility for existing automation and tokens. - Granular permissions are additive. For any API request on a specific Tunnel or Mesh node, access is granted if the principal has either the account-level role or a granular permission for that resource.
- Resource enumeration is authorization-aware. Listing endpoints (
GET /accounts/{id}/cfd_tunnel,GET /accounts/{id}/warp_connector) return only the resources the principal has at least read access to.
- Configure granular permissions for Cloudflare Tunnel.
- Configure granular permissions for Cloudflare Tunnel and Cloudflare Mesh in Cloudflare One.
- Review the resource-scoped roles on the Cloudflare role reference.
Cloudflare has updated Logpush datasets:
- Email Security Post-Delivery Events: A new dataset with fields including
AlertID,CompletedAt,Destination,FinalDisposition,Folder,From,FromName,MessageID,MessageTimestamp,MicrosoftTenantID,Operation,PostfixID,Reasons,Recipient,RequestedAt,RequestedBy,RequestedDisposition,Status,Subject,Success, andTo. - Magic Network Monitoring Flow Logs: A new dataset with fields including
AWSVPCFlowJSON,Bits,DestinationAS,DestinationAddress,DestinationPort,DeviceID,EgressBits,EgressPackets,Ethertype,FlowProtocol,FlowTimestamp,NumFlows,PacketID,Packets,Protocol,RuleIDs,SampleRate,SampleRateType,SamplerAddress,SourceAS,SourceAddress,SourcePort,TcpFlags, andTimestamp.
- Firewall events (added):
AISecurityInjectionScore,AISecurityPIICategories,AISecurityTokenCount, andAISecurityUnsafeTopicCategories. - HTTP requests (added):
AISecurityInjectionScore,AISecurityPIICategories,AISecurityTokenCount,AISecurityUnsafeTopicCategories, andSubrequests.
For the complete field definitions for each dataset, refer to Logpush datasets.
- Email Security Post-Delivery Events: A new dataset with fields including
You can now navigate, switch context, and take common actions in the Cloudflare dashboard without leaving your keyboard. Press
?anywhere to see the full list. Keyboard shortcuts can be disabled by visiting your profile settings ↗.Shortcut Action g hGo to Home g aGo to account overview g zGo to zone overview g pGo to your profile g wGo to Workers & Pages g oGo to Zero Trust g bGo to billing g 1–g 5Go to a recent or pinned item (by position in sidebar) t →Move to the next tab t ←Move to the previous tab p →Move to the next page of a table p ←Move to the previous page of a table Shortcut Action /Open quick search ?Show keyboard shortcuts s aSwitch account s zSwitch zone s .Star or unstar the current zone p .Pin or unpin the current page t sToggle the sidebar open or closed t mExpand or collapse all sidebar menus t aToggle Ask AI sidebar d .Toggle dark mode c uCopy the current URL c dCopy a deep link URL
Full Changelog: v6.10.0...v7.0.0 ↗
This is a major version release that includes breaking changes to three packages:
ai_search,email_security, andworkers. These changes reflect upstream API specification updates that improve type correctness and consistency.Please ensure you read through the list of changes below before moving to this version - this will help you understand any down or upstream issues it may cause to your environments.
See the v7.0.0 Migration Guide ↗ for before/after code examples and actions needed for each change.
The
SearchForAgentsnested type has been removed from all instance metadata structs. This field is no longer part of the API specification.Removed Types:
InstanceNewResponseMetadataSearchForAgentsInstanceUpdateResponseMetadataSearchForAgentsInstanceListResponseMetadataSearchForAgentsInstanceDeleteResponseMetadataSearchForAgentsInstanceReadResponseMetadataSearchForAgentsInstanceNewParamsMetadataSearchForAgentsInstanceUpdateParamsMetadataSearchForAgentsNamespaceInstanceNewResponseMetadataSearchForAgentsNamespaceInstanceUpdateResponseMetadataSearchForAgentsNamespaceInstanceListResponseMetadataSearchForAgentsNamespaceInstanceDeleteResponseMetadataSearchForAgentsNamespaceInstanceReadResponseMetadataSearchForAgentsNamespaceInstanceNewParamsMetadataSearchForAgentsNamespaceInstanceUpdateParamsMetadataSearchForAgents
Multiple Email Security settings sub-resources have changed their path parameter types from
int64tostring:AllowPolicies(policyID int64->policyID string)BlockSenders(patternID int64->patternID string)Domains(domainID int64->domainID string)ImpersonationRegistry(displayNameID int64->impersonationRegistryID string)TrustedDomains(trustedDomainID int64->trustedDomainID string)
The
Investigate.Get,Investigate.Move.New, andInvestigate.Reclassify.Newmethods now useinvestigateIDinstead ofpostfixIDas the path parameter name.The
SettingDomainService.BulkDeletemethod and its associated types have been removed:SettingDomainBulkDeleteResponseSettingDomainBulkDeleteParams
SettingTrustedDomainService.Newnow returns*SettingTrustedDomainNewResponseinstead of*SettingTrustedDomainNewResponseUnion.InvestigateMoveService.Newnow returns*pagination.SinglePage[InvestigateMoveNewResponse]instead of*[]InvestigateMoveNewResponse.The observability telemetry filter parameter types have been restructured to support nested filter groups. New discriminated union types replace the previous flat filter arrays:
ObservabilityTelemetryKeysParams.Filtersnow acceptsFiltersObjectFilterUnion(was[]interface\{\})ObservabilityTelemetryQueryParams.Parameters.Filtersnow acceptsFiltersObjectFilterUnionObservabilityTelemetryValuesParams.Filtersnow acceptsFiltersObjectFilterUnion
New types include
FiltersObjectFiltersObject(for group filters withFilterCombination) andFiltersWorkersObservabilityFilterLeaf(for leaf filters with typedOperation,Type, andValuefields).NEW SERVICE: Query organization audit logs with cursor-based pagination.
List()- Retrieve audit logs
client.BrowserRendering.Devtools.Browser.Targets.Close()- Close a specific browser target (tab, page) by ID
client.Queues.GetMetrics()- Retrieve queue metrics for a specific queue
- Added
WaitForCompletionparameter toNamespaceInstanceItemNewOrUpdateParamsandNamespaceInstanceItemSyncParamsfor synchronous indexing confirmation
- Magic Transit:
ConnectorService.Listparameter name corrected fromquerytoparams(non-functional, affects generated documentation only)
None in this release.
Full Changelog: v4.3.1...v5.0.0 ↗
This is a major release of the Cloudflare Python SDK. It drops support for Python 3.8, adds 11 new API services, introduces optional aiohttp backend support for improved async concurrency, and includes hundreds of type and method updates across the entire API surface.
Please review the breaking changes below before upgrading. A migration guide is available at v5.0.0 Migration Guide ↗.
- Python 3.8 is no longer supported. The minimum required version is now Python 3.9.
typing-extensionsminimum version bumped from>=4.10to>=4.14.
The following resources have breaking changes. See the v5.0.0 Migration Guide ↗ for detailed migration instructions.
abusereportsacm.totaltlsapigateway.configurationscloudforceone.threateventsd1.databaseintel.indicatorfeedslogpush.edgeorigintlsclientauth.hostnamesqueues.consumersradar.bgprulesets.rulesschemavalidation.schemassnippetszerotrust.dlpzerotrust.networks
The async client now supports an optional
aiohttpHTTP backend for improved concurrency performance. Install withpip install cloudflare[aiohttp]and useDefaultAioHttpClient()as thehttp_clientparameter.Python 3.13 and 3.14 are now tested and supported.
The following top-level resources are new in this release:
Resource Client Path Description AI Search aisearchAI-powered search capabilities Connectivity connectivityConnectivity testing and diagnostics Email Sending email_sendingEmail send and send_raw endpoints Fraud fraudFraud detection and prevention Google Tag Gateway google_tag_gatewayGoogle Tag Gateway management Organizations organizationsOrganization audit logs and management R2 Data Catalog r2_data_catalogR2 Data Catalog operations Realtime Kit realtime_kitRealtime communication (Calls/TURN) Resource Tagging resource_taggingResource tagging and labeling Token Validation token_validationToken validation configuration and rules Vulnerability Scanner vulnerability_scannerVulnerability scanning, credential sets, and target environments - api_gateway: Labels endpoints
- billing: Billable usage PayGo endpoint
- brand_protection: v2 endpoints
- browser_rendering: DevTools methods
- cache: Origin cloud regions resource
- custom_origin_trust_store: Custom origin trust store
- dns:
dns_records/usageendpoints - email_security: Phishguard reports endpoint
- iam: User groups and user group members resources
- radar: Botnet Threat Feed and Post-Quantum endpoints
- workers: Observability Destinations resources
- zero_trust: Access Users, DEX rules, Device IP Profile, Device Subnet, WARP Connector connections and failover, WARP Subnet, Gateway PAC files
- zones: Zone environments endpoints
- Fixed
polymorphic_serializationparameter inmodel_dumpoverrides - Added
BaseModelbase to responseSchemaFieldStruct/SchemaFieldListstubs in Pipelines - Added missing
model_rebuild/update_forward_refsforSharedEntryCustomEntryclasses in DLP - Made
RunQueryParametersNeedleValueaBaseModelwitharbitrary_types_allowedin Workers - Removed duplicate
notification_urlfield in webhook response types for Stream - Resolved pre-existing codegen type errors
- Fixed
type: ignore[call-arg]placement for mypy compatibility in Radar
Resources with
@deprecatedannotations on some methods include:accounts,addressing,ai-gateway,aisearch,api-gateway,billing,cloudforce-one,dns,email-routing,email-security,filters,firewall,images,intel,kv,logpush,origin-tls-client-auth,pages,pipelines,radar,rate-limits,registrar,rulesets,ssl,user,workers,workers-for-platforms,zero-trust,zones
Full Changelog: v6.0.0-beta.2...v6.0.0 ↗
This is a major version release of the Cloudflare TypeScript SDK. It includes 11 entirely new top-level API resources, new sub-resources and methods across 50+ existing resources, SDK infrastructure improvements, and breaking changes to the generated API surface from the v5.x line.
Please ensure you read through the list of changes below before moving to this version - this will help you understand any down or upstream issues it may cause to your environments.
- Retry-After handling changed: The SDK now respects any server-specified
Retry-Aftervalue for rate-limited requests. Previously, values over 60 seconds were ignored and a default backoff was used instead. - Empty response handling: Responses with
content-length: 0now returnundefinedinstead of attempting to parse the body. - Environment variable reading: Empty string env vars (for example,
CLOUDFLARE_API_TOKEN="") are now treated as unset. - Path query parameter merging: URL search params embedded in endpoint paths are now extracted and merged into the query object.
17 HTTP endpoints were removed from the SDK, affecting
abuse-reports,cloudforce-one,dlp/profiles/predefined,email-security/investigate,email-security/settings, andintel/ip-list.client.ai.toMarkdown.transform(file, \{ ...params \})->client.ai.toMarkdown.transform(\{ ...params \})--filemoved from positional arg into params bodyclient.radar.ai.toMarkdown.create(body, \{ ...params \})->client.radar.ai.toMarkdown.create(\{ ...params \})--bodymoved from positional arg into paramsclient.abuseReports.create(reportType, \{ ...params \})->client.abuseReports.create(reportParam, \{ ...params \})-- positional arg renamedclient.iam.userGroups.members.create(userGroupId, [ ...body ])->client.iam.userGroups.members.create(userGroupId, [ ...members ])-- body array param renamed
client.originTLSClientAuth.hostnames.certificates->client.originTLSClientAuth.zoneCertificatesclient.radar.netflows->client.radar.netFlows(casing change)
- 133 methods now return
nullinstead of a typed response object. This primarily affects delete operations acrossaccounts,cache,d1,filters,firewall,hyperdrive,iam,kv,logpush,logs,r2,stream,workers,zero-trust,zones, and others. - 17 methods changed pagination type (for example,
KeysCursorPaginationAfter->KeysCursorLimitPagination). - 29 methods changed to a different named type (for example,
CloudflaredCreateResponse->CloudflareTunnel).
24 shared types removed from root namespace (
ASN,AuditLog,Member,Permission,Role,Subscription,Token, etc.). 19 response types consolidated or renamed.19 resources were restructured from single files to directories. Public API client paths are unchanged, but deep imports may break.
11 entirely new resources added to the client:
Resource Client Path Methods Description AI Search client.aiSearch46 Instances, namespaces, tokens, and items Connectivity client.connectivity5 Directory service APIs Email Sending client.emailSending7 Send and send_raw endpoints Fraud client.fraud2 Fraud detection API Google Tag Gateway client.googleTagGateway2 Google Tag Gateway management Organizations client.organizations8 Organization profiles and audit logs R2 Data Catalog client.r2DataCatalog11 R2 Data Catalog routes Realtime Kit client.realtimeKit54 Realtime Kit APIs Resource Tagging client.resourceTagging9 Resource tagging routes Token Validation client.tokenValidation13 Token validation rules Vulnerability Scanner client.vulnerabilityScanner21 Vulnerability scanning - browser-rendering:
crawl,devtools- Crawl endpoints and DevTools methods - cache:
origin-cloud-regions- Origin cloud regions resource - dns:
usage- DNS records usage endpoints - d1:
time-travel- Time travel get_bookmark and restore - email-security:
phishguard- Phishguard reports endpoint - pipelines:
sinks,streams- Pipelines restructure - radar:
agent-readiness,geolocations,post-quantum- New analytics endpoints - workers:
observability- Observability destinations - zones:
environments- Zone environments endpoints - api-gateway:
labels- Labels endpoints - brand-protection:
v2- V2 endpoints - alerting:
silences- Alert silencing API - billing:
usage- Billable usage PayGo endpoint - iam:
sso- SSO Connectors resource - queues:
getMetricsmethod - Queues metrics endpoint - registrar:
registration-status,update-status- Registrar API convergence - zero-trust: DLP settings, DEX rules, Access Users, WARP Connector, WARP Subnets, Gateway PAC files, Gateway tenants
- Resolved type errors from codegen overwriting manual fixes
- Fixed
post()usage for to-markdown endpoints to resolve async type error - Added least-privilege permissions to all workflow jobs
- Reverted erroneous removal of rulesets resource methods and types
- Resolved prettier formatting errors in codegen output
The following resources now include
@deprecatedannotations on some methods:accounts,addressing,ai-gateway,aisearch,api-gateway,billing,cloudforce-one,custom-nameservers,dns,email-routing,email-security,filters,firewall,images,intel,keyless-certificates,kv,logpush,origin-tls-client-auth,page-shield,pages,pipelines,radar,rate-limits,registrar,rulesets,ssl,user,workers,workers-for-platforms,zero-trust,zones- Retry-After handling changed: The SDK now respects any server-specified
You can now pay for Cloudflare services directly from your bank account using Instant Bank Payments via Link.
Link ↗ now supports bank account payments in addition to cards. If you have a bank account saved in Link, it appears as a payment option at checkout. If not, you can connect one during the checkout flow.
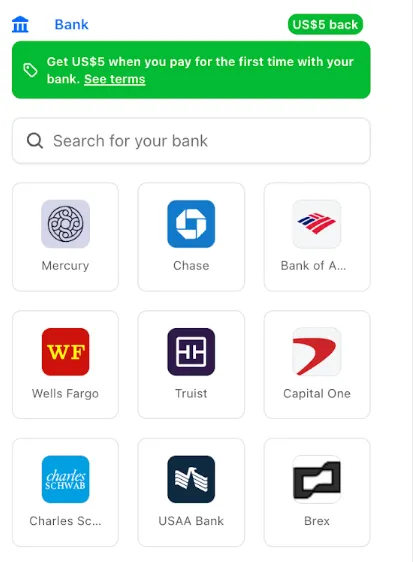
- During checkout, select your bank account from your saved Link payment methods.
- Confirm the payment.
After your first Link authentication, your bank account is available for future purchases without re-entering details.
Instant Bank Payments via Link is available to US-based self-serve accounts across all Cloudflare products. Your existing cards remain available at checkout.
Bank-based Link payments appear in your billing history with the payment method shown as
linkand last four digits as0000. For details, refer to the Instant Bank Payments via Link documentation.
-
The Support button in the dashboard global navigation header now takes you directly to the Cloudflare Support Portal ↗, eliminating the previous dropdown menu.
This change ensures that when you need help, you spend less time navigating the UI and more time getting the answers you need.
- Previous behavior: Selecting ? Support opened a dropdown menu with various links (Help Center, Cloudflare Community, etc.).
- New behavior: Selecting Support immediately redirects your current tab to the Support Portal.
To learn more about the resources available to you, refer to the Cloudflare Support documentation ↗.
Cloudflare-generated 5xx error responses now return structured JSON and Markdown when agents request them, matching the format already available for 1xxx errors. Responses follow RFC 9457 (Problem Details for HTTP APIs) ↗ and include a
Retry-AfterHTTP header on retryable codes.5xx coverage. Ten Cloudflare-generated error codes (500, 502, 504, 520-526) now serve structured responses. These are errors Cloudflare itself generates when it cannot reach or understand the origin server. Origin-generated 5xx responses that Cloudflare passes through are not affected.
Fault attribution. The
error_categoryfield tells agents where the fault lies:origin(502, 504, 520-524) — the origin server is responsible. Transient; retry with the backoff inretry_after.cloudflare(500) — Cloudflare's fault, not the website or the request. Short retry.ssl(525, 526) — the origin's TLS configuration is broken. Do not retry.
Retry-After header. Retryable codes (500, 502, 504, 520-524) include a
Retry-AfterHTTP header matching theretry_afterbody field. Non-retryable codes (525, 526) do not include the header.Request header sent Response format Accept: application/jsonJSON ( application/jsoncontent type)Accept: application/problem+jsonJSON ( application/problem+jsoncontent type)Accept: application/json, text/markdown;q=0.9JSON Accept: text/markdownMarkdown Accept: text/markdown, application/jsonMarkdown (equal q, first-listed wins)Accept: */*HTML (default) Available now for all zones on all plans.
Get JSON response for error 522:
Terminal window curl -s --compressed -H "Accept: application/json" -A "TestAgent/1.0" -H "Accept-Encoding: gzip, deflate" "<YOUR_DOMAIN>/cdn-cgi/error/522" | jq .Check presence of the
Retry-AfterHTTP header associated with the JSON response for error 521:Terminal window curl -s --compressed -D - -o /dev/null -H "Accept: application/json" -A "TestAgent/1.0" -H "Accept-Encoding: gzip, deflate" "<YOUR_DOMAIN>/cdn-cgi/error/521" | grep -i retry-afterReferences:
Resource Tagging is now in public beta and rolling out to all Cloudflare accounts over the coming days. You can attach custom key-value metadata to your Cloudflare resources and query across your entire account to find what you need.
- Broad resource type support — Tag zones, custom hostnames, Cloudflare Tunnels, Workers, D1 databases, R2 buckets, KV namespaces, Durable Object namespaces, Queues, Stream videos, Images, Access applications, Gateway rules, AI Gateways, and more. Refer to the full list of supported resource types.
- Powerful filtering — Query tagged resources using AND/OR logic, negation, and key-only matching. Combine up to 20 filters per query to build precise resource views.
- Account and zone-level endpoints — Full CRUD operations across both scopes.
- Token-based authentication — Tagging supports Account Owned Tokens that persist independently of individual users, so your automation keeps running through credential rotations and team changes.
- Flexible role support — Super Administrators, Workers Admins, and Tag Admins can all manage tags.
The API is the primary interface for Resource Tagging and the recommended path for all workflows — scripting tag assignments, building CI/CD pipelines, or integrating with your infrastructure-as-code toolchain.
You can also view and manage tagged resources directly in the Cloudflare dashboard. Navigate to Manage Account > Resource Tagging to see all tagged resources across your account, filter by resource name or tag, and add or edit tags inline.
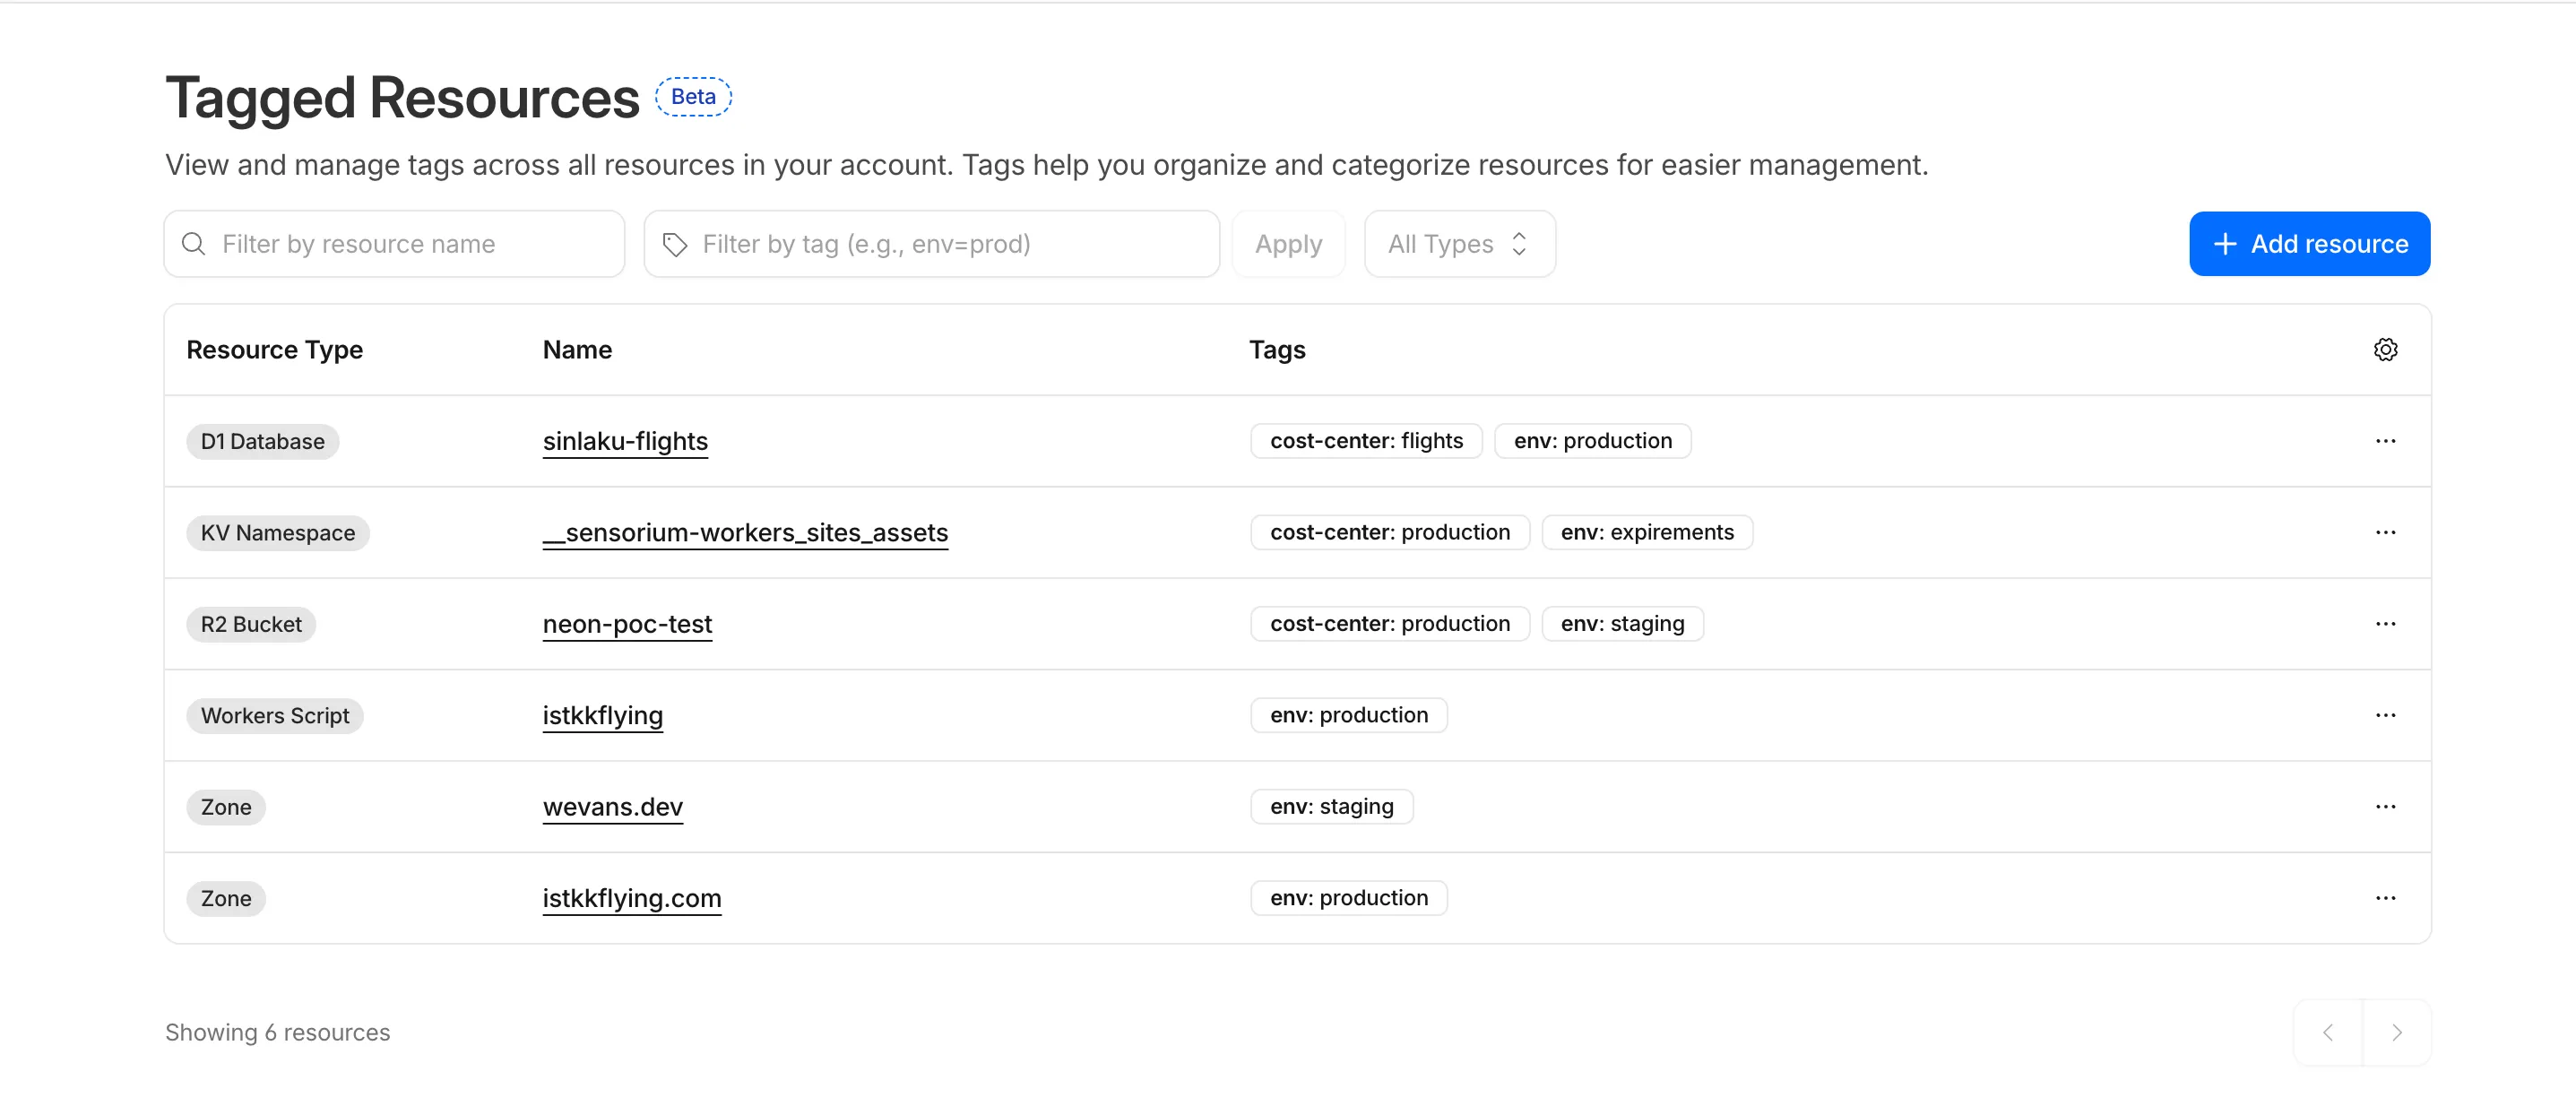
In future releases, expect support for additional resource types across the Cloudflare platform, tag-based access control policies for scoping user permissions to tagged resources, billing and usage attribution by tag for breaking down costs by team, project, or environment, and Terraform provider support for managing tags declaratively.
PUTreplaces all tags on a resource (no partial update). Use the GET, merge, PUT workflow to modify individual tags safely.DELETEremoves all tags from a resource. To remove a single tag, PUT the remaining tags back.- Querying tags for a resource that has never been tagged returns
500instead of404. This is a known beta limitation.
To get started, refer to the Resource Tagging documentation.
Terraform Provider v5.19.0 introduces 14 new resources spanning AI Gateway, Pipelines, R2 Data Catalog, User Groups, Vulnerability Scanner, Workers Observability, and Zero Trust capabilities. This release significantly improves the v4 to v5 migration experience with automatic state upgraders for 26 resources, working seamlessly with the new tf-migrate CLI tool ↗ to automate resource renames, attribute updates, and
movedblock generation. Together, these enhancements reduce manual migration effort and minimize risk when upgrading from v4 to v5.Note:
cmd/migrateis deprecated in favor oftf-migrateand will be removed in a future release (#7062 ↗)- cloudflare_ai_gateway: Manage AI Gateway instances
- cloudflare_certificate_authorities_hostname_associations: Manage mTLS certificate hostname associations
- cloudflare_custom_page_asset: Manage custom page assets
- cloudflare_pipeline: Manage Cloudflare Pipelines
- cloudflare_r2_data_catalog: Manage R2 Data Catalog
- cloudflare_user_group: Manage user groups
- cloudflare_user_group_members: Manage user group memberships
- cloudflare_vulnerability_scanner_credential: Manage vulnerability scanner credentials
- cloudflare_vulnerability_scanner_credential_set: Manage vulnerability scanner credential sets
- cloudflare_vulnerability_scanner_target_environment: Manage vulnerability scanner target environments
- cloudflare_workers_observability_destination: Manage Workers Observability destinations
- cloudflare_zero_trust_device_ip_profile: Manage Zero Trust device IP profiles
- cloudflare_zero_trust_device_subnet: Manage Zero Trust device subnets
- cloudflare_zero_trust_dlp_settings: Manage Zero Trust DLP settings
State upgraders added for seamless migration from v4 to v5 for the following resources:
- account
- account_member
- account_token
- authenticated_origin_pulls
- authenticated_origin_pulls_hostname_certificate
- byo_ip_prefix
- custom_hostname
- custom_ssl
- leaked_credential_check
- leaked_credential_check_rule
- logpush_ownership_challenge
- mtls_certificate
- observatory_scheduled_test
- pages_domain
- regional_tiered_cache
- turnstile_widget
- workers_custom_domain
- zero_trust_device_custom_profile
- zero_trust_device_default_profile
- zero_trust_device_posture_integration
- zero_trust_gateway_certificate
- zero_trust_gateway_settings
- zero_trust_organization
- zero_trust_tunnel_cloudflared_virtual_network
- zone_setting
- ruleset: Add
content_converterandredirects_for_ai_trainingsupport to configuration rules - zero_trust_gateway_logging: Make importable
- account_member: Add UseStateForUnknown to status field to prevent drift
- authenticated_origin_pulls_settings: Fix no prior schema and no-op upgrade
- certificate_pack: Initialize empty lists instead of null in state upgrader to prevent drift
- migrations: Handle ambiguous schema_version state for v4/v5 coexistence
- zero_trust_access_policy: Fix nil pointer panic in state upgrader; set PriorSchema nil for v4 state upgrade
- ai_search_instance: Restore original defaults for cache and cache_threshold; conflict resolution
- apijson: Return empty object from MarshalForPatch when no fields are serializable
- dlp_predefined_profile: Eliminate perpetual entries and enabled_entries drift
- dns_record: Avoid unnecessary drift for ipv4_only and ipv6_only attributes; remove private_routing default value
- drift: Preserve prior state values for optional fields not returned by API
- healthcheck: Use buildHealthcheckPlanChecks helper for correct plan checks per migration source; update assertions
- leaked_credential_check_rule: Handle empty ID from v4 provider state migration
- list_item: Remove context
- logpush_job: Update model for migration
- ruleset: Fix migration; add redirects_for_ai_training to SourceV4ActionParametersModel; fix duplicate model attribute
- worker: Add UseStateForUnknown() plan modifiers and update tests for observability.traces
- workers_custom_domain: Handle HTTP 200 no content header; update assertions
- workers_script: Fix model drift
- zero_trust_access_identity_provider: Fix boolean drifts
- zero_trust_device_managed_networks: Upgrade resource state
- zero_trust_gateway_policy: Make filters Computed+Optional to prevent drift
- zero_trust_gateway_settings: Fix breaking changes; implement sweeper to reset account to clean defaults
- zone_setting: Migration test improvements and fixes
- healthcheck: Update port description to clarify defaults
- Add application-scoped access policy migration guidance
- Update zone_settings_override migration guide for tf-migrate v2 workflow
We're excited to announce tf-migrate, a purpose-built CLI tool that simplifies migrating from Cloudflare Terraform Provider v4 to v5.
Terraform Provider v5 is stable and actively receiving updates. We encourage all users to migrate to v5 to take advantage of ongoing enhancements and new capabilities.
Cloudflare uses tf-migrate to migrate our own infrastructure — the same tool we're providing to the community — ensuring the best possible migration experience.
tf-migrate automates the tedious and error-prone parts of the v4 to v5 migration process:
- Resource type renames – Automatically updates
cloudflare_record→cloudflare_dns_record,cloudflare_access_application→cloudflare_zero_trust_access_application, and 40+ other renamed resources - Attribute transformations – Updates field names (e.g.,
value→contentfor DNS records) and restructures nested blocks - Moved block generation – Creates Terraform 1.8+
movedblocks to prevent resource replacements and ensure zero-downtime migrations - Cross-file reference updates – Automatically finds and updates all references to renamed resources across your entire configuration
- Dry-run mode – Preview all changes before applying them to ensure safety
Combined with the automatic state upgraders introduced in v5.19+, tf-migrate eliminates the manual work and risk that previously made v5 migrations challenging. Tf-migrate operates directly on the config, and the built-in state upgraders handle the rest.
Tf-migrate currently supports the most common Terraform resources our customers use. We are actively working to expand coverage, with the most commonly used resources prioritized first.
For the complete list of supported resources and their migration status, refer to the v5 Stabilization Tracker ↗. This list is updated regularly as additional resources are stabilized and migration support is added.
Resources not yet supported by tf-migrate will need to be migrated manually using the version 5 upgrade guide ↗. The upgrade guide provides step-by-step instructions for handling resource renames, attribute changes, and state migrations.
- Download tf-migrate ↗
- Version 5 Migration Guide ↗
- Terraform Provider documentation ↗
- v5 Stabilization Tracker ↗
We have been releasing Betas over the past month and a half while testing this tool. See the full changelog of those Betas here: tf-migrate releases ↗.
- Resource type renames – Automatically updates
Audit Logs v2 now supports organization-level audit logs. Org Admins can retrieve audit events for actions performed at the organization level via the Audit Logs v2 API.
To retrieve organization-level audit logs, use the following endpoint:
Terminal window GET https://api.cloudflare.com/client/v4/organizations/{organization_id}/logs/auditThis release covers user-initiated actions performed through organization-level APIs. Audit logs for system-initiated actions, a dashboard UI, and Logpush support for organizations will be added in future releases.
For more information, refer to the Audit Logs documentation.
-
In this release, you'll see a number of breaking changes. This is primarily due to changes in OpenAPI definitions, which our libraries are based off of, and codegen updates that we rely on to read those OpenAPI definitions and produce our SDK libraries.
Please ensure you read through the list of changes below before moving to this version - this will help you understand any down or upstream issues it may cause to your environments.
See the v6.10.0 Migration Guide ↗ for before/after code examples and actions needed for each change.
Several fields have been removed from
AbuseReportNewParamsBodyAbuseReportsRegistrarWhoisReportRegWhoRequest:RegWhoGoodFaithAffirmationRegWhoLawfulProcessingAgreementRegWhoLegalBasisRegWhoRequestTypeRegWhoRequestedDataElements
The
InstanceNewParamsandInstanceUpdateParamstypes have been significantly restructured. Many fields have been moved or removed:InstanceNewParams.TokenID,Type,CreatedFromAISearchWizard,WorkerDomainremovedInstanceUpdateParams— most configuration fields removed (includingIndexMethod,IndexingOptions,MaxNumResults,Metadata,Paused,PublicEndpointParams,Reranking,RerankingModel,RetrievalOptions,RewriteModel,RewriteQuery,ScoreThreshold,SourceParams,Summarization,SummarizationModel,SystemPromptAISearch,SystemPromptIndexSummarization,SystemPromptRewriteQuery,TokenID,CreatedFromAISearchWizard,WorkerDomain)InstanceSearchParams.Messagesfield removed along withInstanceSearchParamsMessageandInstanceSearchParamsMessagesRoletypes
The
InstanceItemServicetype has been removed. The items sub-resource atclient.AISearch.Instances.Itemsno longer exists in the non-namespace path. Useclient.AISearch.Namespaces.Instances.Itemsinstead.The following types have been removed from the
ai_searchpackage:TokenDeleteResponseTokenListParams(and associatedTokenListParamsOrderBy,TokenListParamsOrderByDirection)
The
Investigate.Move.New()method now returns a raw slice instead of a paginated wrapper:New()returns*[]InvestigateMoveNewResponseinstead of*pagination.SinglePage[InvestigateMoveNewResponse]NewAutoPaging()method removed
The
ConfigEditParamstype lost itsMTLSandNamefields. TheHyperdriveMTLSParamtype lostMTLSandHostfields. TheHostfield on origin config changed fromparam.Field[string]to a plainstring.The
UserGroupMemberNewParamsstruct has been restructured and theNew()method now returns a paginated response:UserGroupMemberNewParams.Bodyrenamed toUserGroupMemberNewParams.MembersUserGroupMemberNewParamsBodyrenamed toUserGroupMemberNewParamsMemberUserGroupMemberUpdateParams.Bodyrenamed toUserGroupMemberUpdateParams.MembersUserGroupMemberUpdateParamsBodyrenamed toUserGroupMemberUpdateParamsMemberUserGroups.Members.New()returns*pagination.SinglePage[UserGroupMemberNewResponse]instead of*UserGroupMemberNewResponse
The
UserGroupListParams.Directionfield changed fromparam.Field[string]toparam.Field[UserGroupListParamsDirection](typed enum withasc/descvalues).Several delete methods across Pipelines now return typed responses instead of bare error:
Pipelines.DeleteV1()returns(*PipelineDeleteV1Response, error)instead oferrorPipelines.Sinks.Delete()returns(*SinkDeleteResponse, error)instead oferrorPipelines.Streams.Delete()returns(*StreamDeleteResponse, error)instead oferror
The following response envelope types have been removed:
MessageBulkPushResponseSuccessMessagePushResponseSuccessMessageAckResponsefieldsRetryCountandWarningsremoved
Methods now return direct types instead of
SinglePagewrappers, and several internal types have been removed. AssociatedAutoPagingmethods have also been removed:Stores.New()returns*StoreNewResponseinstead of*pagination.SinglePage[StoreNewResponse]Stores.NewAutoPaging()method removedStores.Secrets.BulkDelete()returns*StoreSecretBulkDeleteResponseinstead of*pagination.SinglePage[StoreSecretBulkDeleteResponse]Stores.Secrets.BulkDeleteAutoPaging()method removed- Removed types:
StoreDeleteResponse,StoreDeleteResponseEnvelopeResultInfo,StoreSecretDeleteResponse,StoreSecretDeleteResponseStatus,StoreSecretBulkDeleteResponse(old shape),StoreSecretBulkDeleteResponseStatus,StoreSecretDeleteResponseEnvelopeResultInfo StoreNewParamsrestructured (oldStoreNewParamsBodyremoved)StoreSecretBulkDeleteParamsrestructured
The
AudioTracks.Get()method now returns a dedicated response type instead of a paginated list. TheGetAutoPaging()method has been removed:Get()returns*AudioTrackGetResponseinstead of*pagination.SinglePage[Audio]GetAutoPaging()method removed
The
Clip.New()method now returns the sharedVideotype. The following types have been entirely removed:Clip,ClipPlayback,ClipStatus,ClipWatermark
ClipNewParams.MaxDurationSeconds,ThumbnailTimestampPct,WatermarkremovedCopyNewParams.ThumbnailTimestampPct,Watermarkremoved
DownloadNewResponseStatustype removedWebhookUpdateResponseandWebhookGetResponsechanged frominterface{}type aliases to full struct types
The following union interface types have been removed:
AccessAIControlMcpPortalListResponseServersUpdatedPromptsUnionAccessAIControlMcpPortalListResponseServersUpdatedToolsUnionAccessAIControlMcpPortalReadResponseServersUpdatedPromptsUnionAccessAIControlMcpPortalReadResponseServersUpdatedToolsUnion
NEW SERVICE: Full vulnerability scanning management
- CredentialSets - CRUD for credential sets (
New,Update,List,Delete,Edit,Get) - Credentials - Manage credentials within sets (
New,Update,List,Delete,Edit,Get) - Scans - Create and manage vulnerability scans (
New,List,Get) - TargetEnvironments - Manage scan target environments (
New,Update,List,Delete,Edit,Get)
NEW SERVICE: Namespace-scoped AI Search management
New(),Update(),List(),Delete(),ChatCompletions(),Read(),Search()- Instances - Namespace-scoped instances (
New,Update,List,Delete,ChatCompletions,Read,Search,Stats) - Jobs - Instance job management (
New,Update,List,Get,Logs) - Items - Instance item management (
List,Delete,Chunks,NewOrUpdate,Download,Get,Logs,Sync,Upload)
NEW SERVICE: DevTools protocol browser control
- Session - List and get devtools sessions
- Browser - Browser lifecycle management (
New,Delete,Connect,Launch,Protocol,Version) - Page - Get page by target ID
- Targets - Manage browser targets (
New,List,Activate,Get)
NEW: Domain check and search endpoints
Check()-POST /accounts/{account_id}/registrar/domain-checkSearch()-GET /accounts/{account_id}/registrar/domain-search
NEW: Registration management (
client.Registrar.Registrations)New(),List(),Edit(),Get()RegistrationStatus.Get()- Get registration workflow statusUpdateStatus.Get()- Get update workflow status
NEW SERVICE: Manage origin cloud region configurations
New(),List(),Delete(),BulkDelete(),BulkEdit(),Edit(),Get(),SupportedRegions()
NEW SERVICE: DLP settings management
Update(),Delete(),Edit(),Get()
AgentReadiness.Summary()- Agent readiness summary by dimensionAI.MarkdownForAgents.Summary()- Markdown-for-agents summaryAI.MarkdownForAgents.Timeseries()- Markdown-for-agents timeseries
UserGroups.Members.Get()- Get details of a specific member in a user groupUserGroups.Members.NewAutoPaging()- Auto-paging variant for adding membersUserGroups.NewParams.Policieschanged from required to optional
ContentBotsProtectionfield added toBotFightModeConfigurationandSubscriptionConfiguration(block/disabled)
None in this release.
Custom Dashboards are now available to all Cloudflare customers. Build personalized views that highlight the metrics most critical to your infrastructure and security posture, moving beyond standard product dashboards.
This update significantly expands the data available for visualization. Build charts based on any of the 100+ datasets available via the Cloudflare GraphQL API, covering everything from WAF events and Workers metrics to Load Balancing and Zero Trust logs.
For Log Explorer customers, you can now turn raw log queries directly into dashboard charts. When you identify a specific pattern or spike while investigating logs, save that query as a visualization to monitor those signals in real-time without leaving the dashboard.
- Unified visibility: Consolidate signals from different Cloudflare products (for example, HTTP Traffic and R2 Storage) into a single view.
- Flexible monitoring: Create charts that focus on specific status codes, ASN regions, or security actions that matter to your business.
- Expanded limits: Log Explorer customers can create up to 100 dashboards (up from 25 for standard customers).
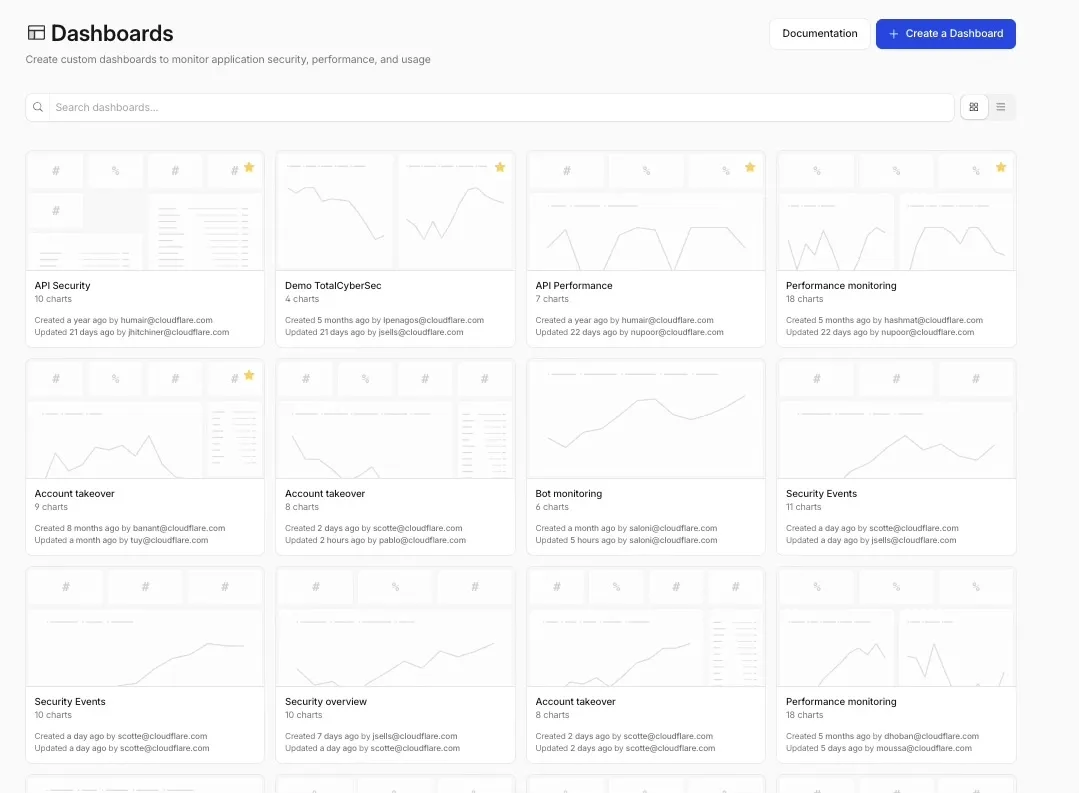
To get started, refer to the Custom Dashboards documentation.
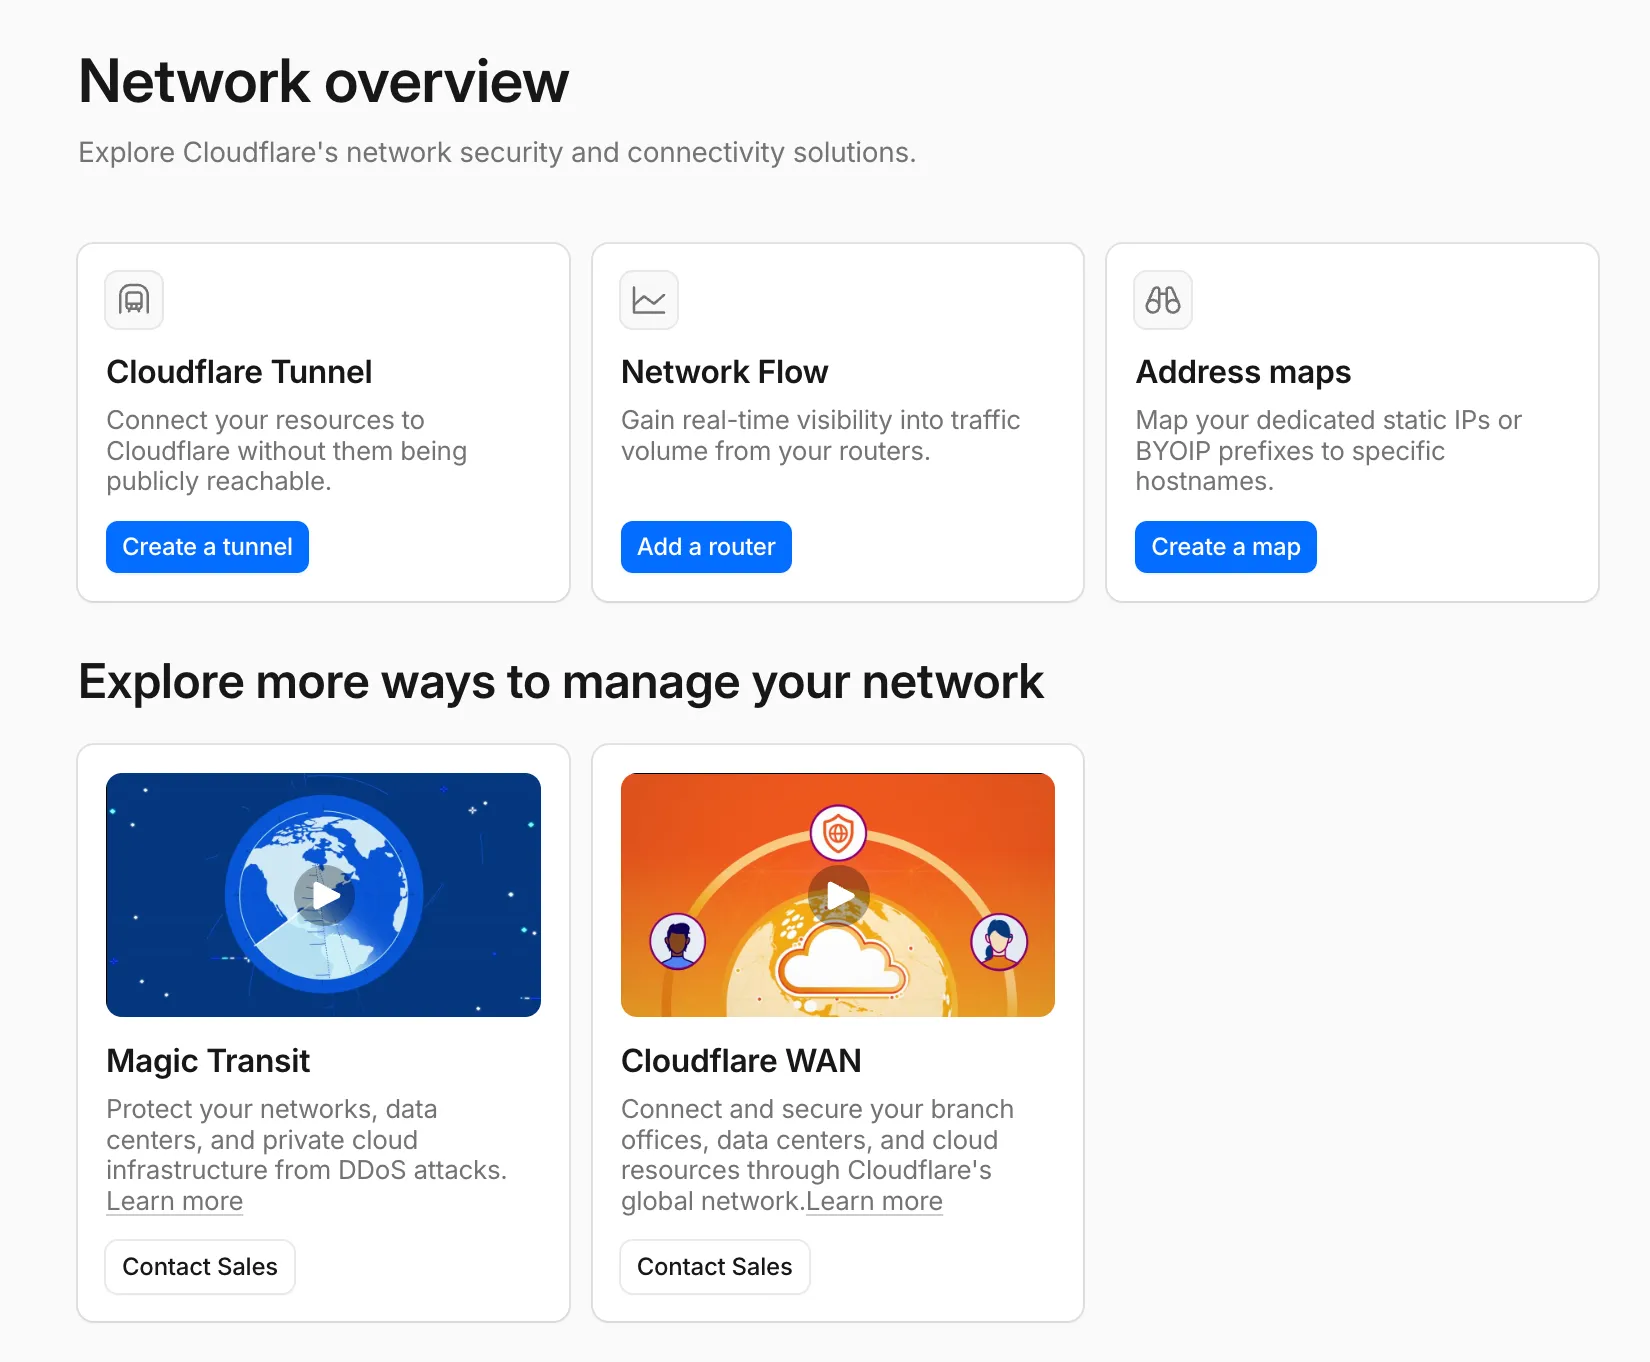
A new Network Overview page in the Cloudflare dashboard gives you a single starting point for network security and connectivity products.
From the Network Overview page, you can:
- Connect resources with Cloudflare Tunnel - Create tunnels to connect your infrastructure to Cloudflare without exposing it to the public Internet.
- Monitor traffic with Network Flow - Get real-time visibility into traffic volume from your routers.
- Configure Address Maps - Map dedicated static IPs or BYOIP prefixes to specific hostnames.
- Explore Magic Transit and Cloudflare WAN - Set up DDoS protection for your networks and connectivity for your branch offices and data centers.
To find it, go to Networking ↗ in the dashboard sidebar.
If you already use Magic Transit, Cloudflare WAN, or other Cloudflare network services products, your existing experience is unchanged.
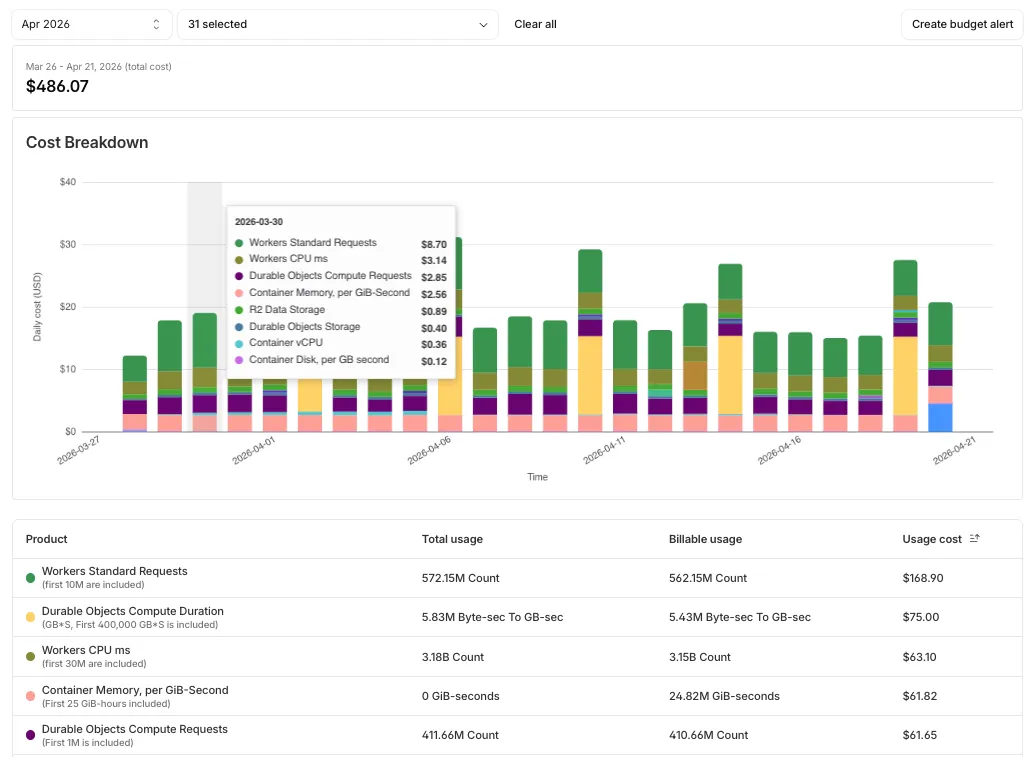
Pay-as-you-go customers can now monitor usage-based costs and configure spend alerts through two new features: the Billable Usage dashboard and Budget alerts.
The Billable Usage dashboard provides daily visibility into usage-based costs across your Cloudflare account. The data comes from the same system that generates your monthly invoice, so the figures match your bill.
The dashboard displays:
- A bar chart showing daily usage charges for your billing period
- A sortable table breaking down usage by product, including total usage, billable usage, and cumulative costs
- Ability to view previous billing periods
Usage data aligns to your billing cycle, not the calendar month. The total usage cost shown at the end of a completed billing period matches the usage overage charges on your corresponding invoice.
To access the dashboard, go to Manage Account > Billing > Billable Usage.
Budget alerts allow you to set dollar-based thresholds for your account-level usage spend. You receive an email notification when your projected monthly spend reaches your configured threshold, giving you proactive visibility into your bill before month-end.
To configure a budget alert:
- Go to Manage Account > Billing > Billable Usage.
- Select Set Budget Alert.
- Enter a budget threshold amount greater than $0.
- Select Create.
Alternatively, configure alerts via Notifications > Add > Budget Alert.
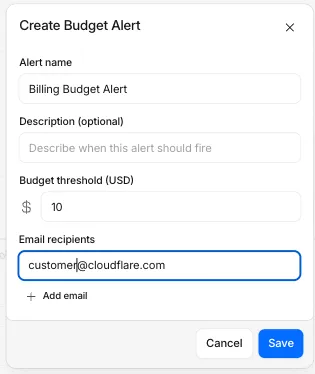
You can create multiple budget alerts at different dollar amounts. The notifications system automatically deduplicates alerts if multiple thresholds trigger at the same time. Budget alerts are calculated daily based on your usage trends and fire once per billing cycle when your projected spend first crosses your threshold.
Both features are available to Pay-as-you-go accounts with usage-based products (Workers, R2, Images, etc.). Enterprise contract accounts are not supported.
For more information, refer to the Usage based billing documentation.
When a Cloudflare Worker intercepts a visitor request, it can dispatch additional outbound fetch calls called subrequests. By default, each subrequest generates its own log entry in Logpush, resulting in multiple log lines per visitor request. With subrequest merging enabled, subrequest data is embedded as a nested array field on the parent log record instead.
- New subrequest_merging field on Logpush jobs — Set "merge_subrequests": true when creating or updating an http_requests Logpush job to enable the feature.
- New Subrequests log field — When subrequest merging is enabled, a Subrequests field (
array\<object\>) is added to each parent request log record. Each element in the array contains the standard http_requests fields for that subrequest.
- Applies to the http_requests (zone-scoped) dataset only.
- A maximum of 50 subrequests are merged per parent request. Subrequests beyond this limit are passed through unmodified as individual log entries.
- Subrequests must complete within 5 minutes of the visitor request. Subrequests that exceed this window are passed through unmodified.
- Subrequests that do not qualify appear as separate log entries — no data is lost.
- Subrequest merging is being gradually rolled out and is not yet available on all zones. Contact your account team for concerns or to ensure it is enabled for your zone.
- For more information, refer to Subrequests.
Logpush has traditionally been great at delivering Cloudflare logs to a variety of destinations in JSON format. While JSON is flexible and easily readable, it can be inefficient to store and query at scale.
With this release, you can now send your logs directly to Pipelines to ingest, transform, and store your logs in R2 as Parquet files or Apache Iceberg tables managed by R2 Data Catalog. This makes the data footprint more compact and more efficient at querying your logs instantly with R2 SQL or any other query engine that supports Apache Iceberg or Parquet.
Pipelines SQL runs on each log record in-flight, so you can reshape your data before it is written. For example, you can drop noisy fields, redact sensitive values, or derive new columns:
INSERT INTO http_logs_sinkSELECTClientIP,EdgeResponseStatus,to_timestamp_micros(EdgeStartTimestamp) AS event_time,upper(ClientRequestMethod) AS method,sha256(ClientIP) AS hashed_ipFROM http_logs_streamWHERE EdgeResponseStatus >= 400;Pipelines SQL supports string functions, regex, hashing, JSON extraction, timestamp conversion, conditional expressions, and more. For the full list, refer to the Pipelines SQL reference.
To configure Pipelines as a Logpush destination, refer to Enable Cloudflare Pipelines.
Cloudflare's network now supports redirecting verified AI training crawlers to canonical URLs when they request deprecated or duplicate pages. When enabled via AI Crawl Control > Quick Actions, AI training crawlers that request a page with a canonical tag pointing elsewhere receive a 301 redirect to the canonical version. Humans, search engine crawlers, and AI Search agents continue to see the original page normally.
This feature leverages your existing
<link rel="canonical">tags. No additional configuration required beyond enabling the toggle. Available on Pro, Business, and Enterprise plans at no additional cost.Refer to the Redirects for AI Training documentation for details.
AI Crawl Control now includes new tools to help you prepare your site for the agentic Internet—a web where AI agents are first-class citizens that discover and interact with content differently than human visitors.
The Metrics tab now includes a Content Format chart showing what content types AI systems request versus what your origin serves. Understanding these patterns helps you optimize content delivery for both human and agent consumption.
The Robots.txt tab has been renamed to Directives and now includes a link to check your site's Agent Readiness ↗ score.
Refer to our blog post on preparing for the agentic Internet ↗ for more on why these capabilities matter.
Cloudflare has added new fields to multiple Logpush datasets:
The following Gateway and Zero Trust datasets now include a
TenantIDfield:- Gateway DNS: Identifies the tenant ID of the DNS request, if it exists.
- Gateway HTTP: Identifies the tenant ID of the HTTP request, if it exists.
- Gateway Network: Identifies the tenant ID of the network session, if it exists.
- Zero Trust Network Sessions: Identifies the tenant ID of the network session, if it exists.
The following datasets now include Firewall for AI fields:
-
FirewallForAIInjectionScore: The score indicating the likelihood of a prompt injection attack in the request.FirewallForAIPIICategories: List of PII categories detected in the request.FirewallForAITokenCount: The number of tokens in the request.FirewallForAIUnsafeTopicCategories: List of unsafe topic categories detected in the request.
For the complete field definitions for each dataset, refer to Logpush datasets.