
Digital Experience Monitoring (DEX) provides visibility into WARP device metrics, connectivity, and network performance across your Cloudflare SASE deployment.
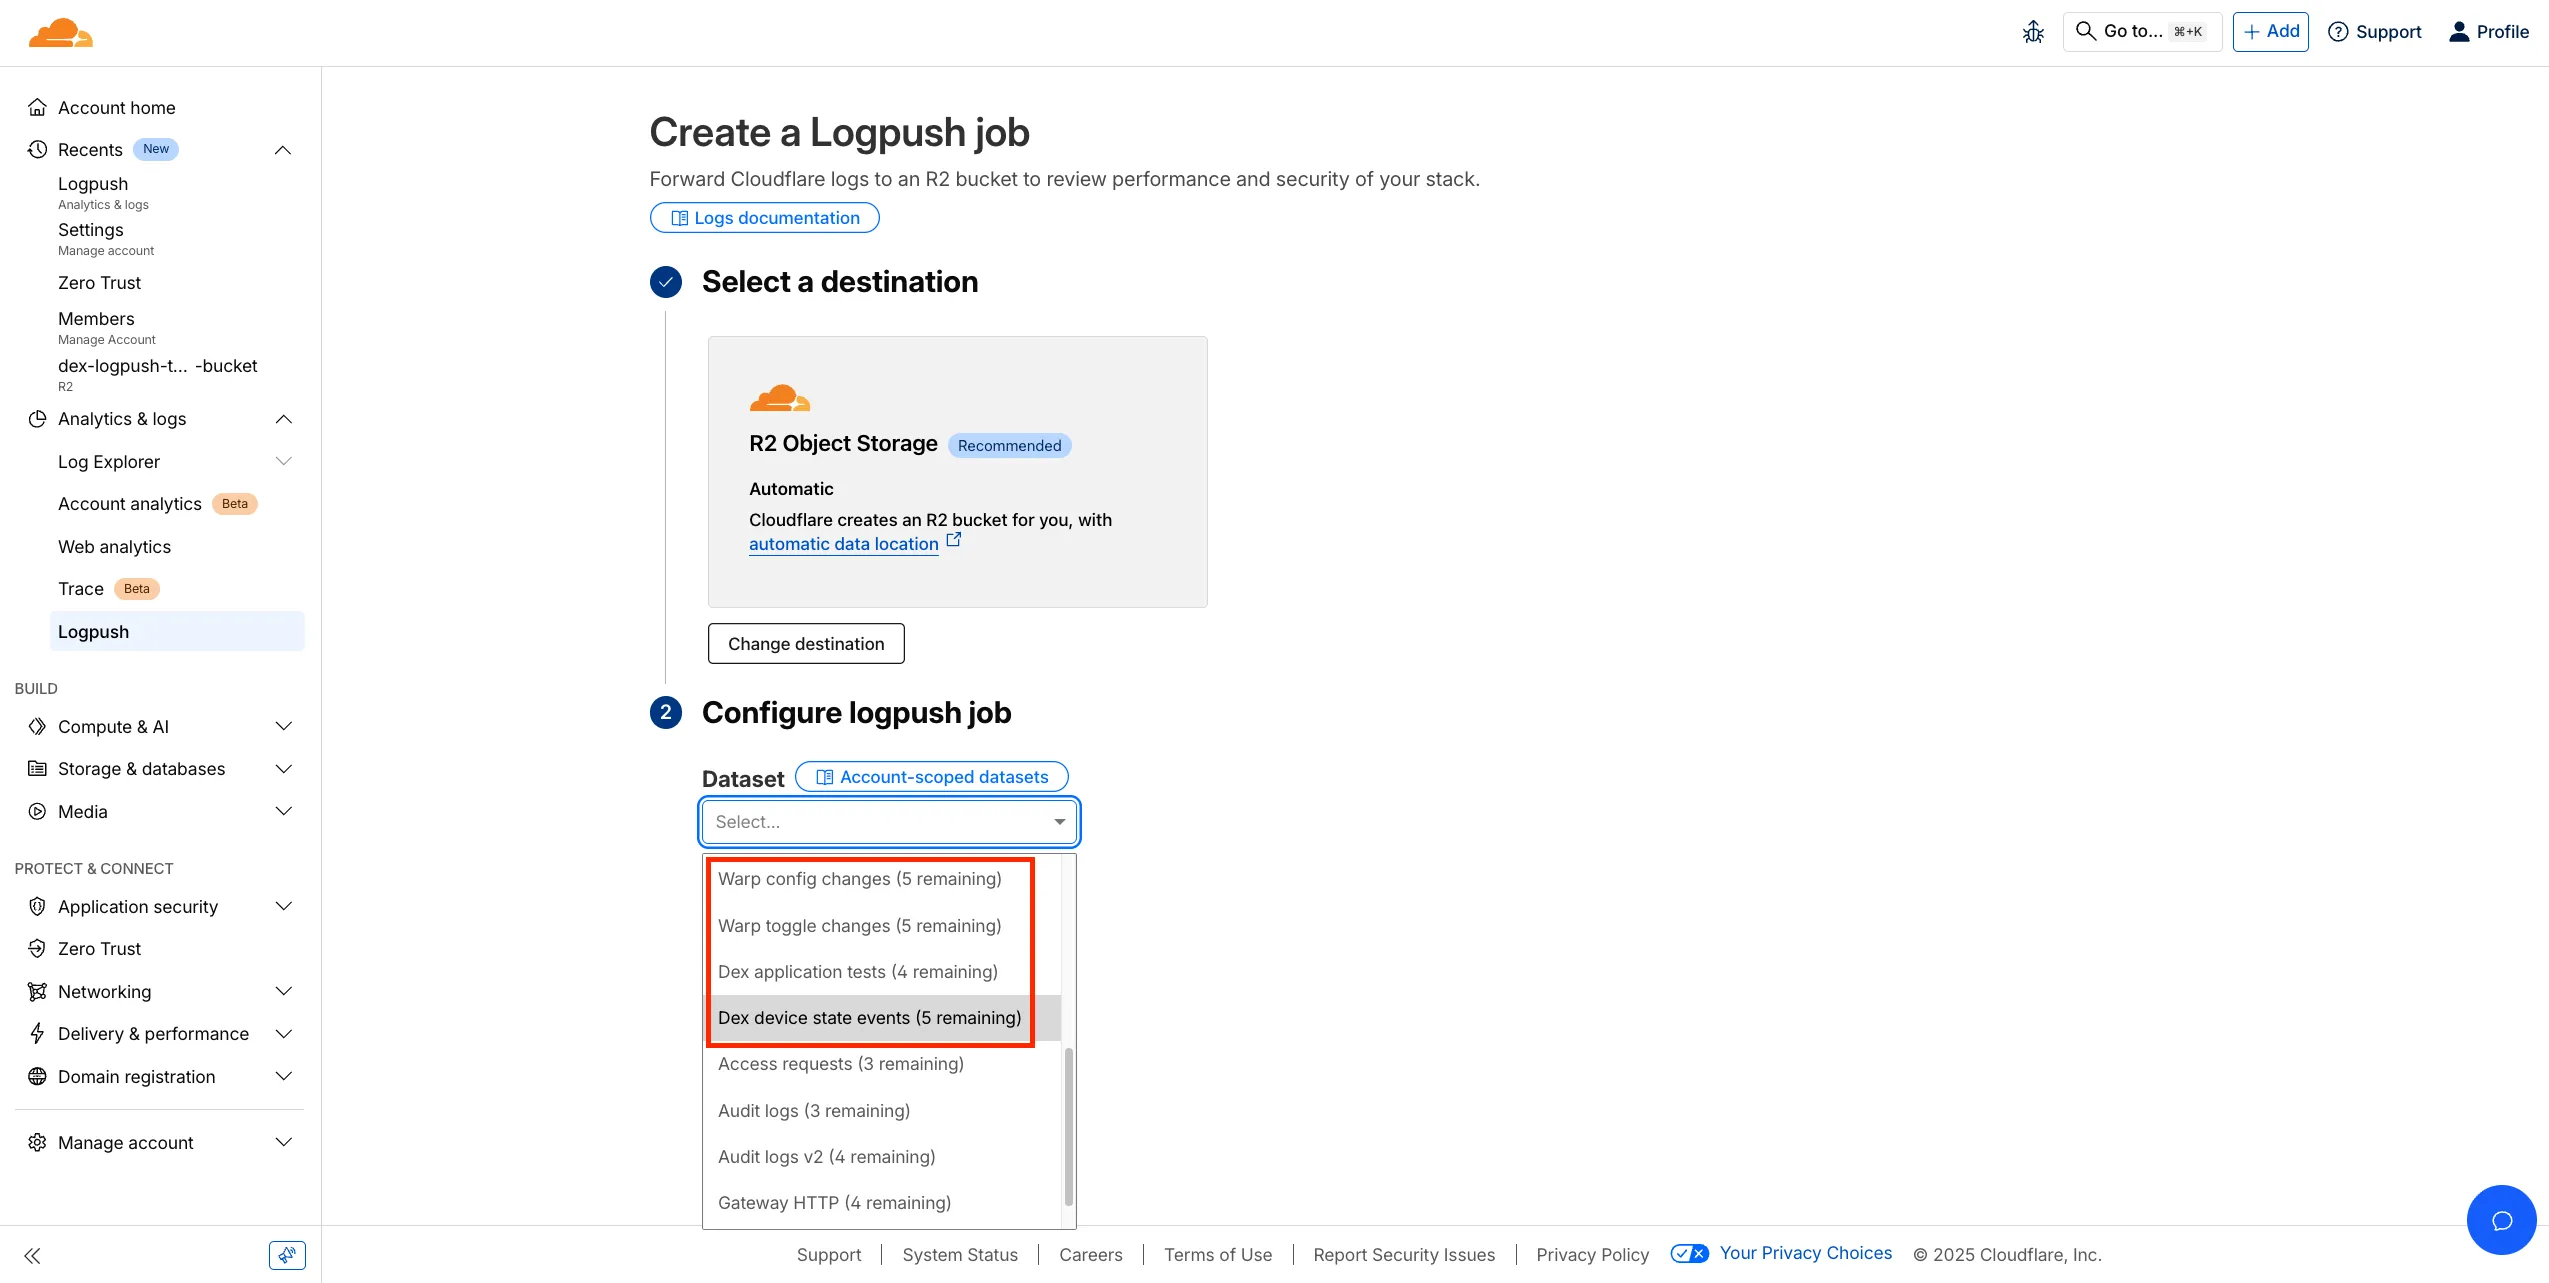
We've released four new WARP and DEX device data sets that can be exported via Cloudflare Logpush. These Logpush data sets can be exported to R2, a cloud bucket, or a SIEM to build a customized logging and analytics experience.
To create a new DEX or WARP Logpush job, customers can go to the account level of the Cloudflare dashboard > Analytics & Logs > Logpush to get started.
You can now perform more powerful queries directly in Workers Analytics Engine ↗ with a major expansion of our SQL function library.
Workers Analytics Engine allows you to ingest and store high-cardinality data at scale (such as custom analytics) and query your data through a simple SQL API.
Today, we've expanded Workers Analytics Engine's SQL capabilities with several new functions:
countIf()- count the number of rows which satisfy a provided conditionsumIf()- calculate a sum from rows which satisfy a provided conditionavgIf()- calculate an average from rows which satisfy a provided condition
New date and time functions: ↗
toYear()toMonth()toDayOfMonth()toDayOfWeek()toHour()toMinute()toSecond()toStartOfYear()toStartOfMonth()toStartOfWeek()toStartOfDay()toStartOfHour()toStartOfFifteenMinutes()toStartOfTenMinutes()toStartOfFiveMinutes()toStartOfMinute()today()toYYYYMM()
Whether you're building usage-based billing systems, customer analytics dashboards, or other custom analytics, these functions let you get the most out of your data. Get started with Workers Analytics Engine and explore all available functions in our SQL reference documentation.
A new GA release for the Windows WARP client is now available on the stable releases downloads page.
This release contains minor fixes, improvements, and new features including Path Maximum Transmission Unit Discovery (PMTUD). When PMTUD is enabled, the client will dynamically adjust packet sizing to optimize connection performance. There is also a new connection status message in the GUI to inform users that the local network connection may be unstable. This will make it easier to diagnose connectivity issues.
Changes and improvements
- Fixed an inconsistency with Global WARP override settings in multi-user environments when switching between users.
- The GUI now displays the health of the tunnel and DNS connections by showing a connection status message when the network may be unstable. This will make it easier to diagnose connectivity issues.
- Fixed an issue where deleting a registration was erroneously reported as having failed.
- Path Maximum Transmission Unit Discovery (PMTUD) may now be used to discover the effective MTU of the connection. This allows the WARP client to improve connectivity optimized for each network. PMTUD is disabled by default. To enable it, refer to the PMTUD documentation.
- Improvements for the OS version WARP client check. Windows Updated Build Revision (UBR) numbers can now be checked by the client to ensure devices have required security patches and features installed.
- The WARP client now supports Windows 11 ARM-based machines. For information on known limitations, refer to the Known limitations page.
Known issues
For Windows 11 24H2 users, Microsoft has confirmed a regression that may lead to performance issues like mouse lag, audio cracking, or other slowdowns. Cloudflare recommends users experiencing these issues upgrade to a minimum Windows 11 24H2 KB5062553 or higher for resolution.
Devices using WARP client 2025.4.929.0 and up may experience Local Domain Fallback failures if a fallback server has not been configured. To configure a fallback server, refer to Route traffic to fallback server.
Devices with KB5055523 installed may receive a warning about
Win32/ClickFix.ABAbeing present in the installer. To resolve this false positive, update Microsoft Security Intelligence to version 1.429.19.0 or later.DNS resolution may be broken when the following conditions are all true:
- WARP is in Secure Web Gateway without DNS filtering (tunnel-only) mode.
- A custom DNS server address is configured on the primary network adapter.
- The custom DNS server address on the primary network adapter is changed while WARP is connected.
To work around this issue, reconnect the WARP client by toggling off and back on.
A new GA release for the macOS WARP client is now available on the stable releases downloads page.
This release contains minor fixes, improvements, and new features including Path Maximum Transmission Unit Discovery (PMTUD). When PMTUD is enabled, the client will dynamically adjust packet sizing to optimize connection performance. There is also a new connection status message in the GUI to inform users that the local network connection may be unstable. This will make it easier to diagnose connectivity issues.
Changes and improvements
- The GUI now displays the health of the tunnel and DNS connections by showing a connection status message when the network may be unstable. This will make it easier to diagnose connectivity issues.
- Fixed an issue where deleting a registration was erroneously reported as having failed.
- Path Maximum Transmission Unit Discovery (PMTUD) may now be used to discover the effective MTU of the connection. This allows the WARP client to improve connectivity optimized for each network. PMTUD is disabled by default. To enable it, refer to the PMTUD documentation.
Known issues
- Devices using WARP client 2025.4.929.0 and up may experience Local Domain Fallback failures if a fallback server has not been configured. To configure a fallback server, refer to Route traffic to fallback server.
A new GA release for the Linux WARP client is now available on the stable releases downloads page.
This release contains minor fixes, improvements, and new features including Path Maximum Transmission Unit Discovery (PMTUD). When PMTUD is enabled, the client will dynamically adjust packet sizing to optimize connection performance. There is also a new connection status message in the GUI to inform users that the local network connection may be unstable. This will make it easier to diagnose connectivity issues.
WARP client version 2025.8.779.0 introduced an updated public key for Linux packages. The public key must be updated if it was installed before September 12, 2025 to ensure the repository remains functional after December 4, 2025. Instructions to make this update are available at pkg.cloudflareclient.com.
Changes and improvements
- The GUI now displays the health of the tunnel and DNS connections by showing a connection status message when the network may be unstable. This will make it easier to diagnose connectivity issues.
- Fixed an issue where deleting a registration was erroneously reported as having failed.
- Path Maximum Transmission Unit Discovery (PMTUD) may now be used to discover the effective MTU of the connection. This allows the WARP client to improve connectivity optimized for each network. PMTUD is disabled by default. To enable it, refer to the PMTUD documentation.
We're excited to announce a quality-of-life improvement for Log Explorer users. You can now resize the custom SQL query window to accommodate longer and more complex queries.
Previously, if you were writing a long custom SQL query, the fixed-size window required excessive scrolling to view the full query. This update allows you to easily drag the bottom edge of the query window to make it taller. This means you can view your entire custom query at once, improving the efficiency and experience of writing and debugging complex queries.
To learn more and get started, refer to the Log Explorer documentation.
We’re excited to introduce Logpush Health Dashboards, giving customers real-time visibility into the status, reliability, and performance of their Logpush jobs. Health dashboards make it easier to detect delivery issues, monitor job stability, and track performance across destinations. The dashboards are divided into two sections:
-
Upload Health: See how much data was successfully uploaded, where drops occurred, and how your jobs are performing overall. This includes data completeness, success rate, and upload volume.
-
Upload Reliability – Diagnose issues impacting stability, retries, or latency, and monitor key metrics such as retry counts, upload duration, and destination availability.
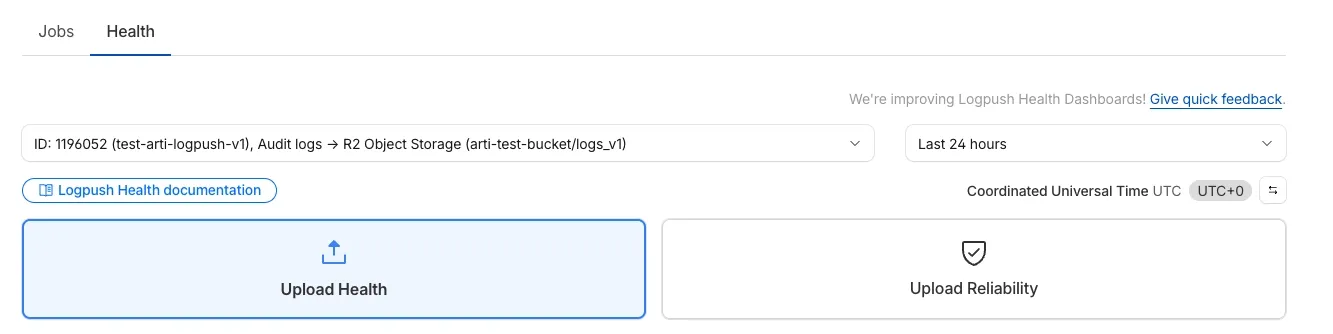
Health Dashboards can be accessed from the Logpush page in the Cloudflare dashboard at the account or zone level, under the Health tab. For more details, refer to our Logpush Health Dashboards documentation, which includes a comprehensive troubleshooting guide to help interpret and resolve common issues.
-
Starting February 2, 2026, the
cloudflared proxy-dnscommand will be removed from all newcloudflaredreleases.This change is being made to enhance security and address a potential vulnerability in an underlying DNS library. This vulnerability is specific to the
proxy-dnscommand and does not affect any othercloudflaredfeatures, such as the core Cloudflare Tunnel service.The
proxy-dnscommand, which runs a client-side DNS-over-HTTPS (DoH) proxy, has been an officially undocumented feature for several years. This functionality is fully and securely supported by our actively developed products.Versions of
cloudflaredreleased before this date will not be affected and will continue to operate. However, note that our official support policy for anycloudflaredrelease is one year from its release date.We strongly advise users of this undocumented feature to migrate to one of the following officially supported solutions before February 2, 2026, to continue benefiting from secure DNS-over-HTTPS.
The preferred method for enabling DNS-over-HTTPS on user devices is the Cloudflare WARP client. The WARP client automatically secures and proxies all DNS traffic from your device, integrating it with your organization's Zero Trust policies and posture checks.
For scenarios where installing a client on every device is not possible (such as servers, routers, or IoT devices), we recommend using the WARP Connector.
Instead of running
cloudflared proxy-dnson a machine, you can install the WARP Connector on a single Linux host within your private network. This connector will act as a gateway, securely routing all DNS and network traffic from your entire subnet to Cloudflare for filtering and logging.
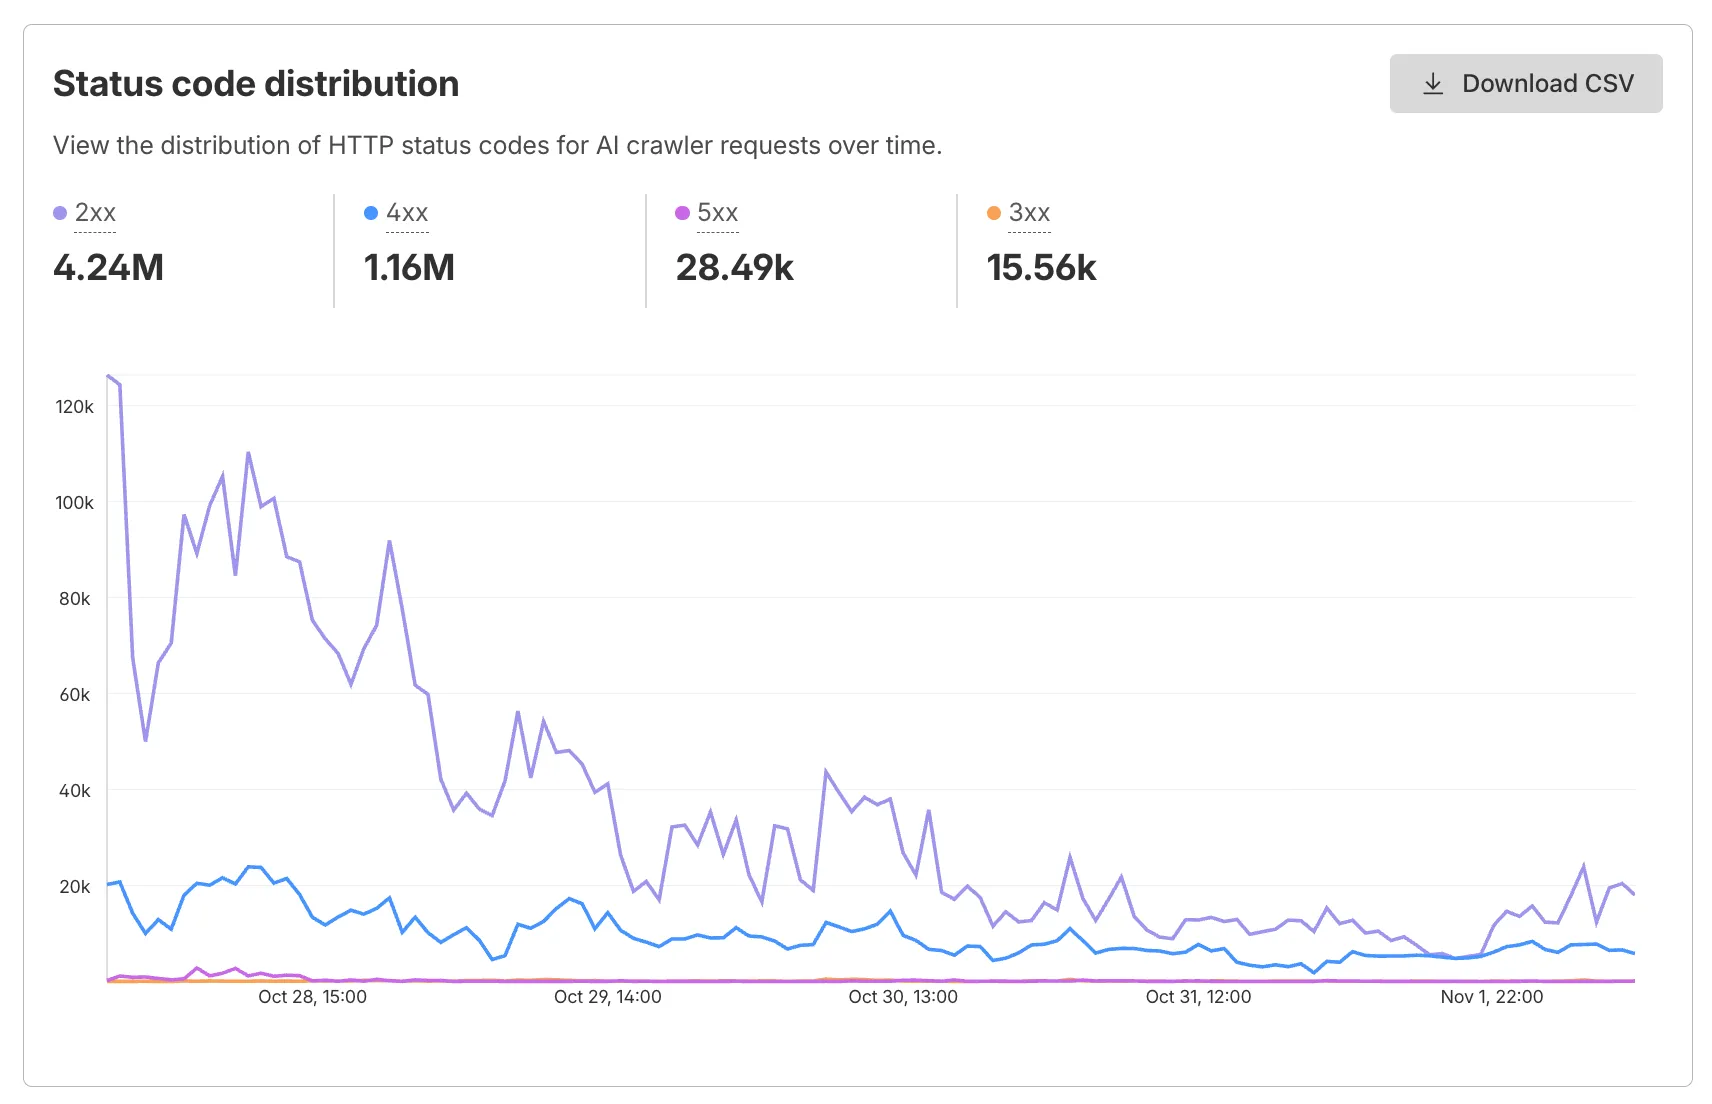
AI Crawl Control now supports per-crawler drilldowns with an extended actions menu and status code analytics. Drill down into Metrics, Cloudflare Radar, and Security Analytics, or export crawler data for use in WAF custom rules, Redirect Rules, and robots.txt files.
The Metrics tab includes a status code distribution chart showing HTTP response codes (2xx, 3xx, 4xx, 5xx) over time. Filter by individual crawler, category, operator, or time range to analyze how specific crawlers interact with your site.
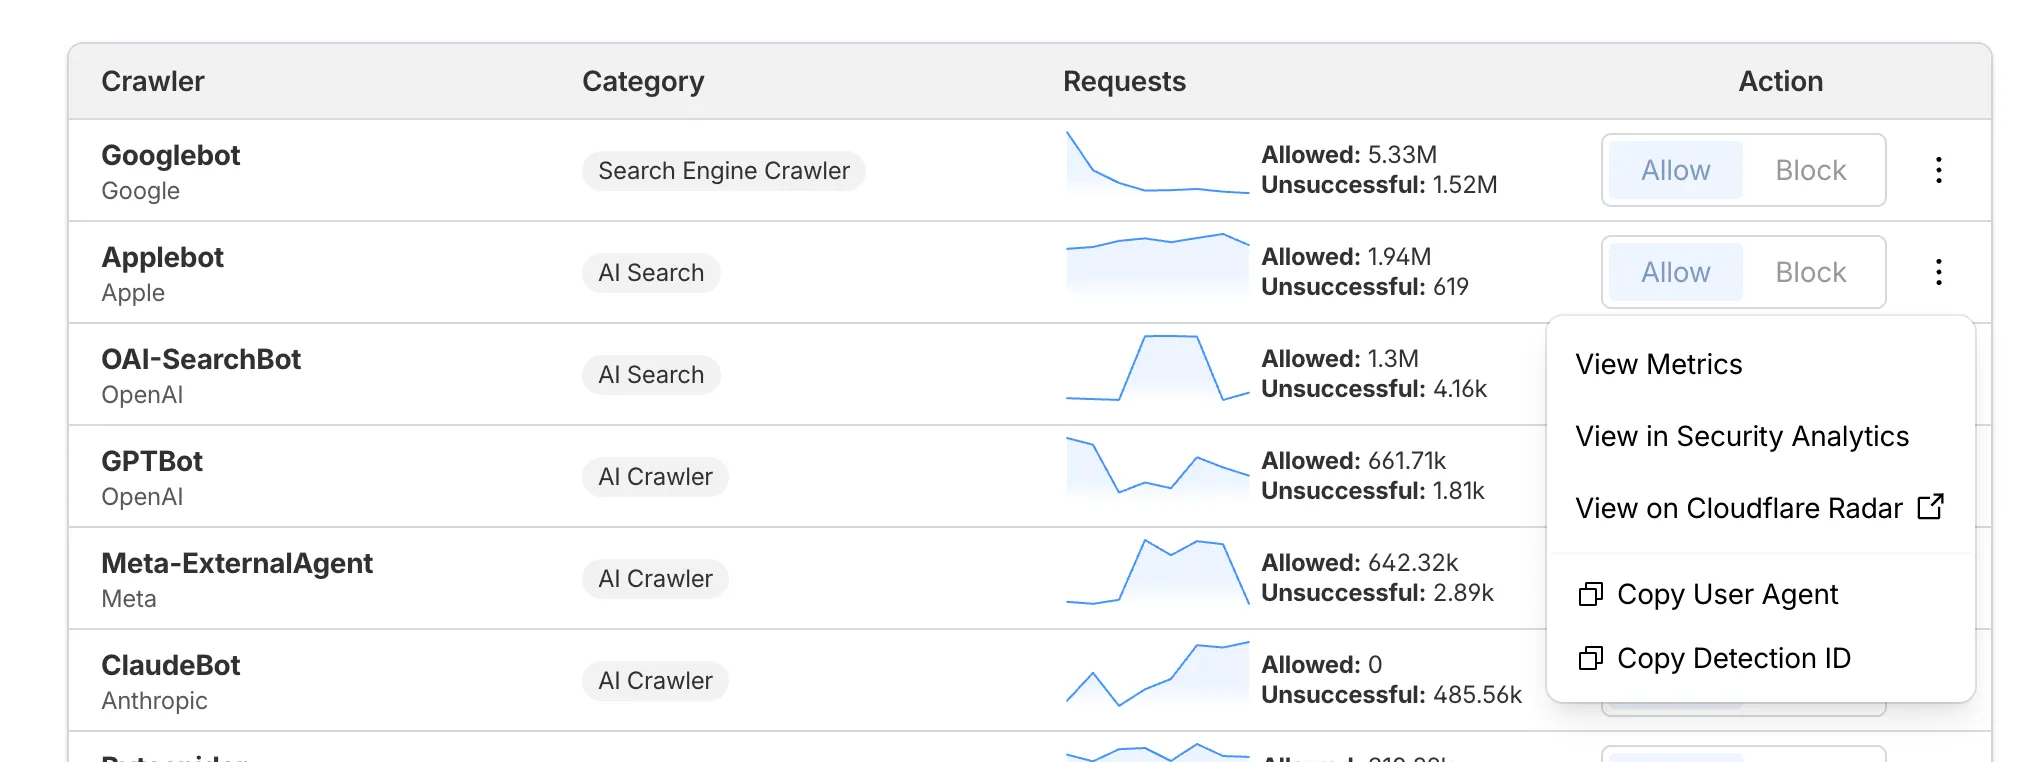
Each crawler row includes a three-dot menu with per-crawler actions:
- View Metrics — Filter the AI Crawl Control Metrics page to the selected crawler.
- View on Cloudflare Radar — Access verified crawler details on Cloudflare Radar.
- Copy User Agent — Copy user agent strings for use in WAF custom rules, Redirect Rules, or robots.txt files.
- View in Security Analytics — Filter Security Analytics by detection IDs (Bot Management customers).
- Copy Detection ID — Copy detection IDs for use in WAF custom rules (Bot Management customers).
- Log in to the Cloudflare dashboard, and select your account and domain.
- Go to AI Crawl Control > Metrics to access the status code distribution chart.
- Go to AI Crawl Control > Crawlers and select the three-dot menu for any crawler to access per-crawler actions.
- Select multiple crawlers to use bulk copy buttons for user agents or detection IDs.
Learn more about AI Crawl Control.
This week’s release introduces new detections for Prototype Pollution across three common vectors: URI, Body, and Header/Form.
Key Findings
- These attacks can affect both API and web applications by altering normal behavior or bypassing security controls.
Impact
Exploitation may allow attackers to change internal logic or cause unexpected behavior in applications using JavaScript or Node.js frameworks. Developers should sanitize input keys and avoid merging untrusted data structures.
Ruleset Rule ID Legacy Rule ID Description Previous Action New Action Comments Cloudflare Managed Ruleset N/A Generic Rules - Prototype Pollution - URI Log Disabled This is a new detection Cloudflare Managed Ruleset N/A Generic Rules - Prototype Pollution - Body Log Disabled This is a new detection Cloudflare Managed Ruleset N/A Generic Rules - Prototype Pollution - Header - Form Log Disabled This is a new detection
Wrangler now supports using the
CLOUDFLARE_ENVenvironment variable to select the active environment for your Worker commands. This provides a more flexible way to manage environments, especially when working with build tools and CI/CD pipelines.Environment selection via environment variable:
- Set
CLOUDFLARE_ENVto specify which environment to use for Wrangler commands - Works with all Wrangler commands that support the
--envflag - The
--envcommand line argument takes precedence over theCLOUDFLARE_ENVenvironment variable
Terminal window # Deploy to the production environment using CLOUDFLARE_ENVCLOUDFLARE_ENV=production wrangler deploy# Upload a version to the staging environmentCLOUDFLARE_ENV=staging wrangler versions upload# The --env flag takes precedence over CLOUDFLARE_ENVCLOUDFLARE_ENV=dev wrangler deploy --env production# This will deploy to production, not devThe
CLOUDFLARE_ENVenvironment variable is particularly useful when working with build tools like Vite. You can set the environment once during the build process, and it will be used for both building and deploying your Worker:Terminal window # Set the environment for both build and deployCLOUDFLARE_ENV=production npm run build & wrangler deployWhen using
@cloudflare/vite-plugin, the build process generates a "redirected deploy config" that is flattened to only contain the active environment. Wrangler will validate that the environment specified matches the environment used during the build to prevent accidentally deploying a Worker built for one environment to a different environment.- Set
You can now see the exact cache key generated for any request directly in Cloudflare Trace. This visibility helps you troubleshoot cache hits and misses, and verify that your Custom Cache Keys — configured via Cache Rules or Page Rules — are working as intended.
Previously, diagnosing caching behavior required inferring the key from configuration settings. Now, you can confirm that your custom logic for headers, query strings, and device types is correctly applied.
Access Trace via the dashboard or API, either manually for ad-hoc debugging or automated as part of your quality-of-service monitoring.
If you have a Cache Rule that segments content based on a specific cookie (for example,
user_region), run a Trace with that cookie present to confirm theuser_regionvalue appears in the resulting cache key.The Trace response includes the cache key in the
cacheobject:{"step_name": "request","type": "cache","matched": true,"public_name": "Cache Parameters","cache": {"key": {"zone_id": "023e105f4ecef8ad9ca31a8372d0c353","scheme": "https","host": "example.com","uri": "/images/hero.jpg"},"key_string": "023e105f4ecef8ad9ca31a8372d0c353::::https://example.com/images/hero.jpg:::::"}}To learn more, refer to the Trace documentation and our guide on Custom Cache Keys.
Enable automatic tracing on your Workers, giving you detailed metadata and timing information for every operation your Worker performs.
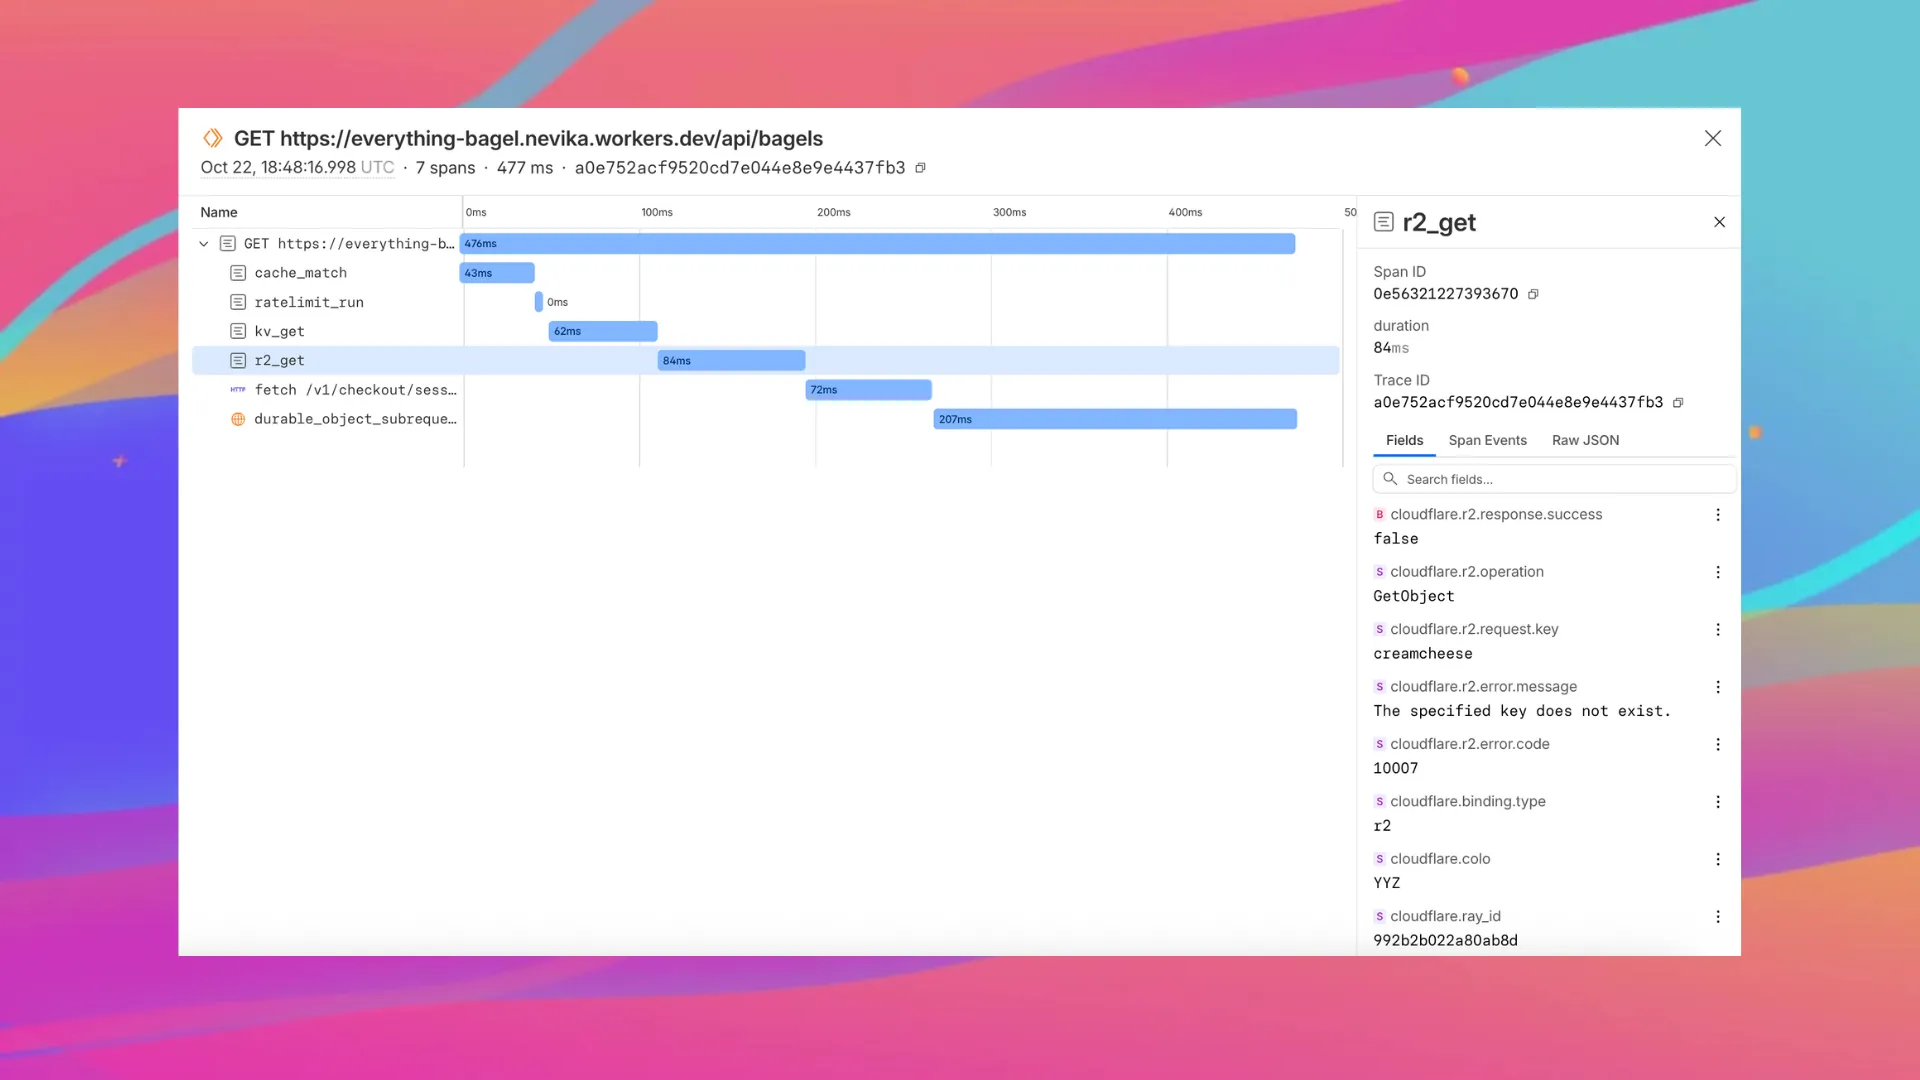
Tracing helps you identify performance bottlenecks, resolve errors, and understand how your Worker interacts with other services on the Workers platform. You can now answer questions like:
- Which calls are slowing down my application?
- Which queries to my database take the longest?
- What happened within a request that resulted in an error?
You can now:
- View traces alongside your logs in the Workers Observability dashboard
- Export traces (and correlated logs) to any OTLP-compatible destination ↗, such as Honeycomb, Sentry or Grafana, by configuring a tracing destination in the Cloudflare dashboard ↗
- Analyze and query across span attributes (operation type, status, duration, errors)
JSONC {"observability": {"tracing": {"enabled": true,},},}
Magic WAN now supports Automatic Return Routing (ARR), allowing customers to configure Magic on-ramps (IPsec/GRE/CNI) to learn the return path for traffic flows without requiring static routes.
Key benefits:
- Route-less mode: Static or dynamic routes are optional when using ARR.
- Overlapping IP space support: Traffic originating from customer sites can use overlapping private IP ranges.
- Symmetric routing: Return traffic is guaranteed to use the same connection as the original on-ramp.
This feature is currently in beta and requires the new Unified Routing mode (beta).
For configuration details, refer to Configure Automatic Return Routing.
Magic WAN Connector now allows you to designate a specific WAN port for breakout traffic, giving you deterministic control over the egress path for latency-sensitive applications.
With this feature, you can:
- Pin breakout traffic for specific applications to a preferred WAN port.
- Ensure critical traffic (such as Zoom or Teams) always uses your fastest or most reliable connection.
- Benefit from automatic failover to standard WAN port priority if the preferred port goes down.
This is useful for organizations with multiple ISP uplinks who need predictable egress behavior for performance-sensitive traffic.
For configuration details, refer to Designate WAN ports for breakout apps.
We have previously added new application categories to better reflect their content and improve HTTP traffic management: refer to Changelog. While the new categories are live now, we want to ensure you have ample time to review and adjust any existing rules you have configured against old categories. The remapping of existing applications into these new categories will be completed by January 30, 2026. This timeline allows you a dedicated period to:
- Review the new category structure.
- Identify any policies you have that target the older categories.
- Adjust your rules to reference the new, more precise categories before the old mappings change. Once the applications have been fully remapped by January 30, 2026, you might observe some changes in the traffic being mitigated or allowed by your existing policies. We encourage you to use the intervening time to prepare for a smooth transition.
Applications being remappedd
Application Name Existing Category New Category Google Photos File Sharing Photography & Graphic Design Flickr File Sharing Photography & Graphic Design ADP Human Resources Business Greenhouse Human Resources Business myCigna Human Resources Health & Fitness UnitedHealthcare Human Resources Health & Fitness ZipRecruiter Human Resources Business Amazon Business Human Resources Business Jobcenter Human Resources Business Jobsuche Human Resources Business Zenjob Human Resources Business DocuSign Legal Business Postident Legal Business Adobe Creative Cloud Productivity Photography & Graphic Design Airtable Productivity Development Autodesk Fusion360 Productivity IT Management Coursera Productivity Education Microsoft Power BI Productivity Business Tableau Productivity Business Duolingo Productivity Education Adobe Reader Productivity Business AnpiReport Productivity Travel ビズリーチ Productivity Business doda (デューダ) Productivity Business 求人ボックス Productivity Business マイナビ2026 Productivity Business Power Apps Productivity Business RECRUIT AGENT Productivity Business シフトボード Productivity Business スタンバイ Productivity Business Doctolib Productivity Health & Fitness Miro Productivity Photography & Graphic Design MyFitnessPal Productivity Health & Fitness Sentry Mobile Productivity Travel Slido Productivity Photography & Graphic Design Arista Networks Productivity IT Management Atlassian Productivity Business CoderPad Productivity Business eAgreements Productivity Business Vmware Productivity IT Management Vmware Vcenter Productivity IT Management AWS Skill Builder Productivity Education Microsoft Office 365 (GCC) Productivity Business Microsoft Exchange Online (GCC) Productivity Business Canva Sales & Marketing Photography & Graphic Design Instacart Shopping Food & Drink Wawa Shopping Food & Drink McDonald's Shopping Food & Drink Vrbo Shopping Travel American Airlines Shopping Travel Booking.com Shopping Travel Ticketmaster Shopping Entertainment & Events Airbnb Shopping Travel DoorDash Shopping Food & Drink Expedia Shopping Travel EasyPark Shopping Travel UEFA Tickets Shopping Entertainment & Events DHL Express Shopping Business UPS Shopping Business For more information on creating HTTP policies, refer to Applications and app types.
You can now set a jurisdiction when creating a D1 database to guarantee where your database runs and stores data. Jurisdictions can help you comply with data localization regulations such as GDPR. Supported jurisdictions include
euandfedramp.A jurisdiction can only be set at database creation time via wrangler, REST API or the UI and cannot be added/updated after the database already exists.
Terminal window npx wrangler@latest d1 create db-with-jurisdiction --jurisdiction eucurl -X POST "https://api.cloudflare.com/client/v4/accounts/<account_id>/d1/database" \-H "Authorization: Bearer $TOKEN" \-H "Content-Type: application/json" \--data '{"name": "db-wth-jurisdiction", "jurisdiction": "eu" }'To learn more, visit D1's data location documentation.
Permissions for managing Logpush jobs related to Zero Trust datasets (Access, Gateway, and DEX) have been updated to improve data security and enforce appropriate access controls.
To view, create, update, or delete Logpush jobs for Zero Trust datasets, users must now have both of the following permissions:
- Logs Edit
- Zero Trust: PII Read
This week’s emergency release introduces a new detection signature that enhances coverage for a critical vulnerability in the React Native Metro Development Server, tracked as CVE-2025-11953.
Key Findings
The Metro Development Server exposes an HTTP endpoint that is vulnerable to OS command injection (CWE-78). An unauthenticated network attacker can send a crafted request to this endpoint and execute arbitrary commands on the host running Metro. The vulnerability affects Metro/cli-server-api builds used by React Native Community CLI in pre-patch development releases.
Impact
Successful exploitation of CVE-2025-11953 may result in remote command execution on developer workstations or CI/build agents, leading to credential and secret exposure, source tampering, and potential lateral movement into internal networks. Administrators and developers are strongly advised to apply the vendor's patches and restrict Metro’s network exposure to reduce this risk.
Ruleset Rule ID Legacy Rule ID Description Previous Action New Action Comments Cloudflare Managed Ruleset N/A React Native Metro - Command Injection - CVE:CVE-2025-11953 N/A Block This is a New Detection
Workers VPC Services is now available, enabling your Workers to securely access resources in your private networks, without having to expose them on the public Internet.
- VPC Services: Create secure connections to internal APIs, databases, and services using familiar Worker binding syntax
- Multi-cloud Support: Connect to resources in private networks in any external cloud (AWS, Azure, GCP, etc.) or on-premise using Cloudflare Tunnels
JavaScript export default {async fetch(request, env, ctx) {// Perform application logic in Workers here// Sample call to an internal API running on ECS in AWS using the bindingconst response = await env.AWS_VPC_ECS_API.fetch("https://internal-host.example.com");// Additional application logic in Workersreturn new Response();},};Set up a Cloudflare Tunnel, create a VPC Service, add service bindings to your Worker, and access private resources securely. Refer to the documentation to get started.
We're excited to announce that Log Explorer users can now cancel queries that are currently running.
This new feature addresses a common pain point: waiting for a long, unintended, or misconfigured query to complete before you can submit a new, correct one. With query cancellation, you can immediately stop the execution of any undesirable query, allowing you to quickly craft and submit a new query, significantly improving your investigative workflow and productivity within Log Explorer.
We're excited to announce a new feature in Log Explorer that significantly enhances how you analyze query results: the Query results distribution chart.
This new chart provides a graphical distribution of your results over the time window of the query. Immediately after running a query, you will see the distribution chart above your result table. This visualization allows Log Explorer users to quickly spot trends, identify anomalies, and understand the temporal concentration of log events that match their criteria. For example, you can visually confirm if a spike in traffic or errors occurred at a specific time, allowing you to focus your investigation efforts more effectively. This feature makes it faster and easier to extract meaningful insights from your vast log data.
The chart will dynamically update to reflect the logs matching your current query.
This week highlights enhancements to detection signatures improving coverage for vulnerabilities in Adobe Commerce and Magento Open Source, linked to CVE-2025-54236.
Key Findings
This vulnerability allows unauthenticated attackers to take over customer accounts through the Commerce REST API and, in certain configurations, may lead to remote code execution. The latest update provides enhanced detection logic for resilient protection against exploitation attempts.
Impact
- Adobe Commerce (CVE-2025-54236): Exploitation may allow attackers to hijack sessions, execute arbitrary commands, steal data, and disrupt storefronts, resulting in confidentiality and integrity risks for merchants. Administrators are strongly encouraged to apply vendor patches without delay.
Ruleset Rule ID Legacy Rule ID Description Previous Action New Action Comments Cloudflare Managed Ruleset 100774C Adobe Commerce - Remote Code Execution - CVE:CVE-2025-54236 Log Block This is an improved detection.
You can now capture Wrangler command output in a structured ND-JSON ↗ format by setting the
WRANGLER_OUTPUT_FILE_PATHorWRANGLER_OUTPUT_FILE_DIRECTORYenvironment variables. This feature is particularly useful for CI/CD pipelines and automation tools that need programmatic access to deployment information such as worker names, version IDs, deployment URLs, and error details. Commands that support this feature includewrangler deploy,wrangler versions upload,wrangler versions deploy, andwrangler pages deploy.
The Brand Protection logo query dashboard now allows you to use the Report to Cloudflare button to submit an Abuse report directly from the Brand Protection logo queries dashboard. While you could previously report new domains that were impersonating your brand before, now you can do the same for websites found to be using your logo wihtout your permission. The abuse reports wiull be prefilled and you will only need to validate a few fields before you can click the submit button, after which our team process your request.
Ready to start? Check out the Brand Protection docs.