Splunk Cloud integration guide
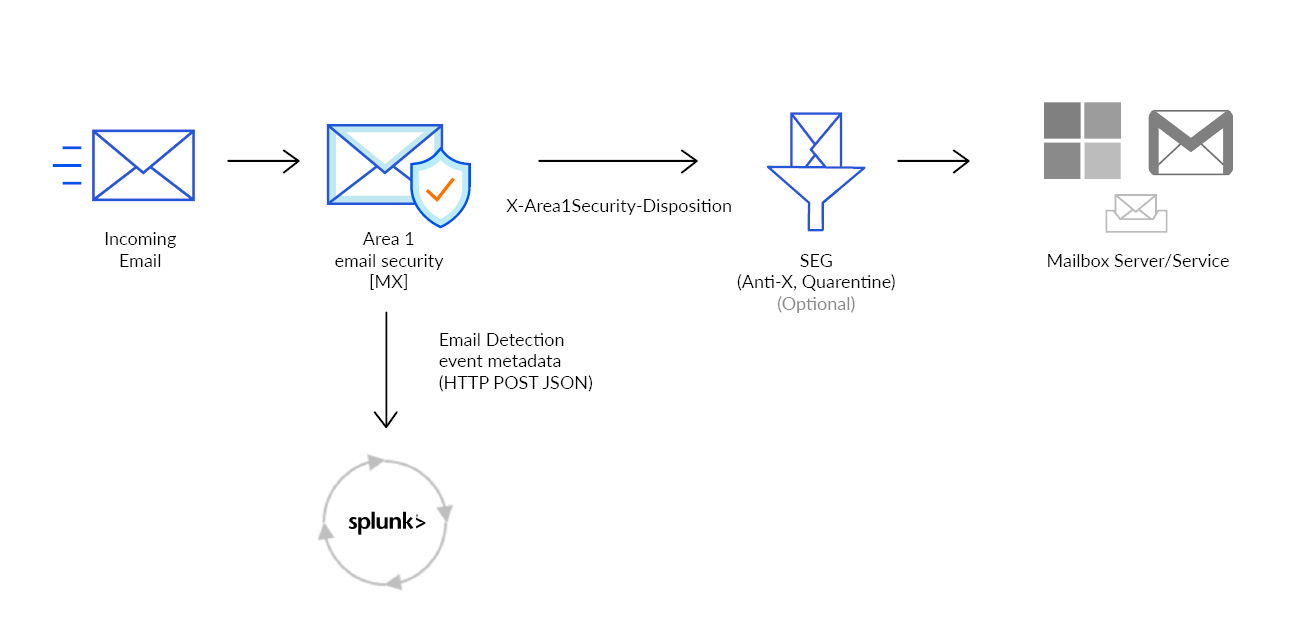
When Cloud Email Security detects a phishing email, the metadata of the detection can be sent directly to Splunk. This document outlines the steps required to integrate with Splunk Cloud.
1. Configure Splunk HTTP Event Collector
Log in to Splunk with an administrator account.
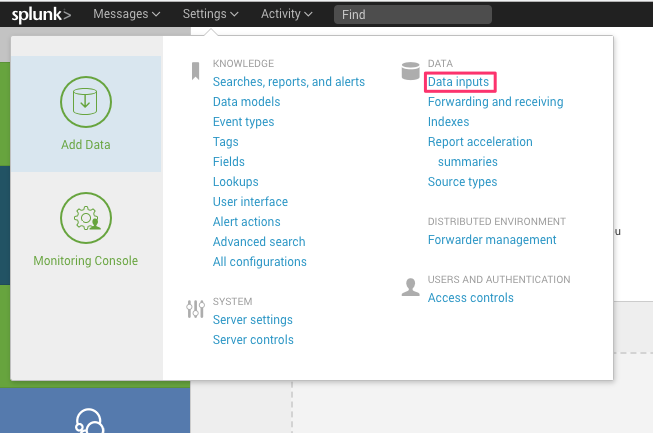
Go to Settings > Data inputs.
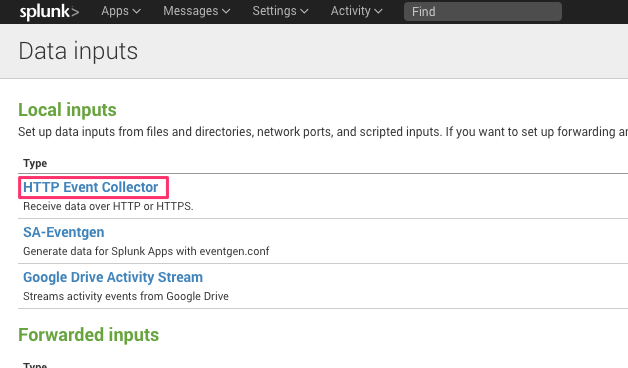
In Local inputs > Type, select HTTP Event Collector to access this configuration and create a new collector.
Select the New Token button to start the configuration.
Provide a descriptive name for the Cloud Email Security (formerly Area 1) token (for example,
Cloud Email Security (formerly Area 1) Email Detections), and leave the Enable indexer acknowledgement unchecked.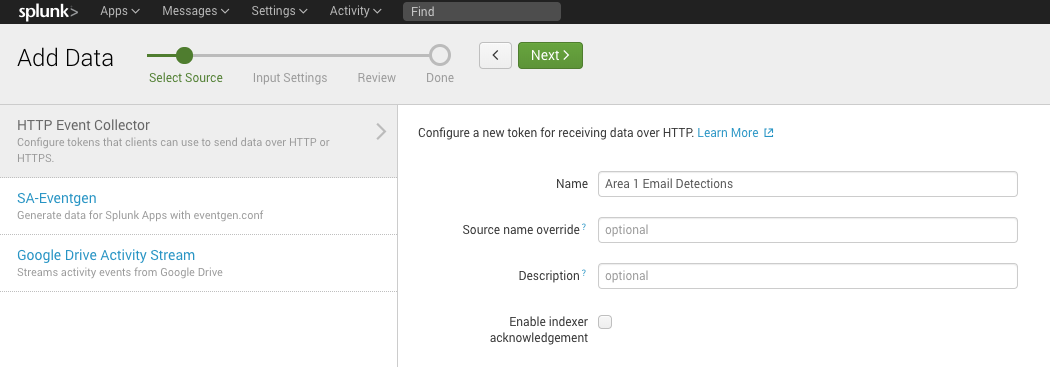
Select Next to continue.
Configure the Input Settings for the HTTP Event Collector based on your environment.
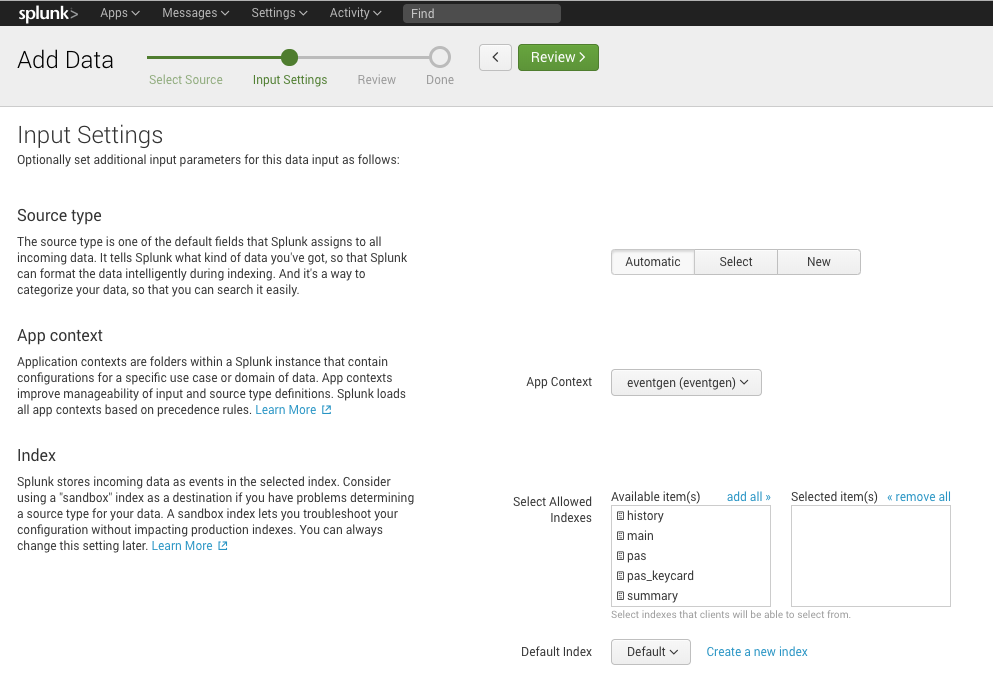
You may also select Create a new index to create new settings for Cloud Email Security events, with a Max Size of Entire Index and Retention (days) that fits your environment.
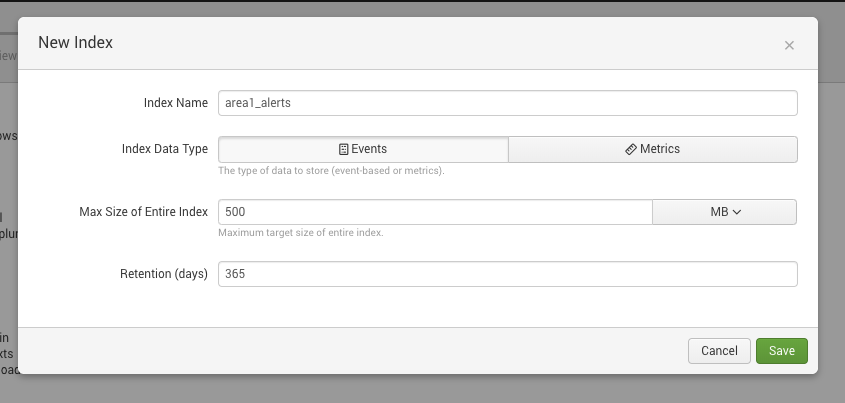
For this example, we created a new
area1_indexindex, and added it to the configuration.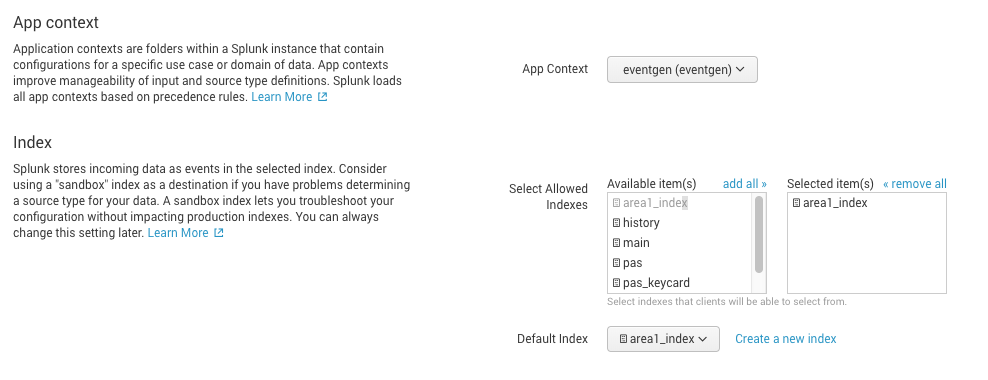
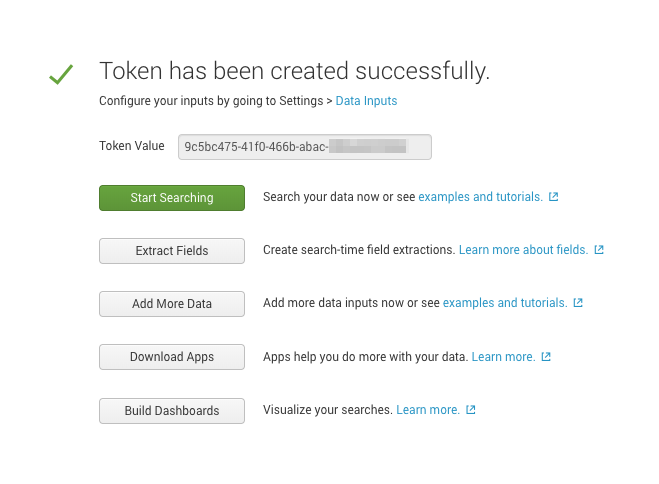
Select Review > Submit to review your settings and create the collector.
Take note of the token value in this next screen. This value is required for the Cloud Email Security configuration in the next step. You can also retrieve the token from the HTTP Event Collector configuration panel, in Settings > Data inputs > HTTP Event Collector.
2. Test your HTTP Event Collector
To test your the HTTP Event Collector, you can manually inject an event into Splunk by using the following cURL command:
curl https://{host}:8088/services/collector/event \
--header "Authorization: Splunk <YOUR_TOKEN>" \
--data '{    "sourcetype": "<YOUR_SOURCE_TYPE>",    "event": "Hello, World!"    }'
Request formats
When creating requests to Splunk, the URL and port number change according to the type of Splunk setup:
- Splunk Cloud Platform free trial:
<protocol>://http-inputs-<host>.splunkcloud.com:8088/<endpoint> - Splunk Cloud Platform:
<protocol>://http-inputs-<host>.splunkcloud.com:443/<endpoint> - Splunk Enterprise:
<protocol>://<host>:8088/<endpoint>
Refer to the Splunk documentation for more information.
If your instance is on-premise, specify the appropriate hostname and ensure that your firewall allows the configured port through to your instance. The connections will be coming from the following egress IP addresses, if you need them for your access control lists (ACLs):
52.11.209.21152.89.255.1152.0.67.10954.173.50.115
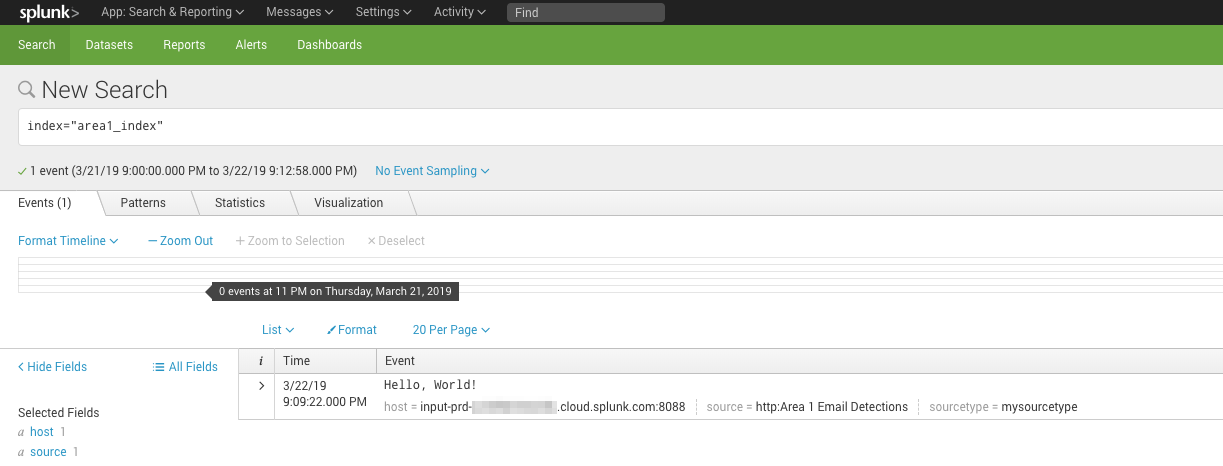
If all the requirements are met, you will receive the following response back to the cURL command:
{"text":"Success","code":0}Additionally, you can search your instance of Splunk for the test event with index or other search criteria (for example, index="area1_index"):
3. Configure Cloud Email Security
The next step is to configure Cloud Email Security to push the Email Detection Event to the Splunk HTTP Event Collector.
- Log in to the Cloud Email Security dashboard.
- Go to Email Configuration > Alert Webhooks, and select New Webhook.
- In the Add Webhooks page, enter the following settings:
- App type: Select SIEM > Splunk, and enter the auth code you took note of the previous step.
- Target: Enter the target URI of your Splunk instance. It will typically have the
https://<host>:8088/services/collectorformat. Refer to Request formats to learn more about how your Splunk subscription affects the URI. - For the dispositions (
MALICIOUS,SUSPICIOUS,SPOOF,SPAM,BULK) choose which (if any) you want to send to the webhook. SendingSPAMandBULKdispositions will generate a high number of events.
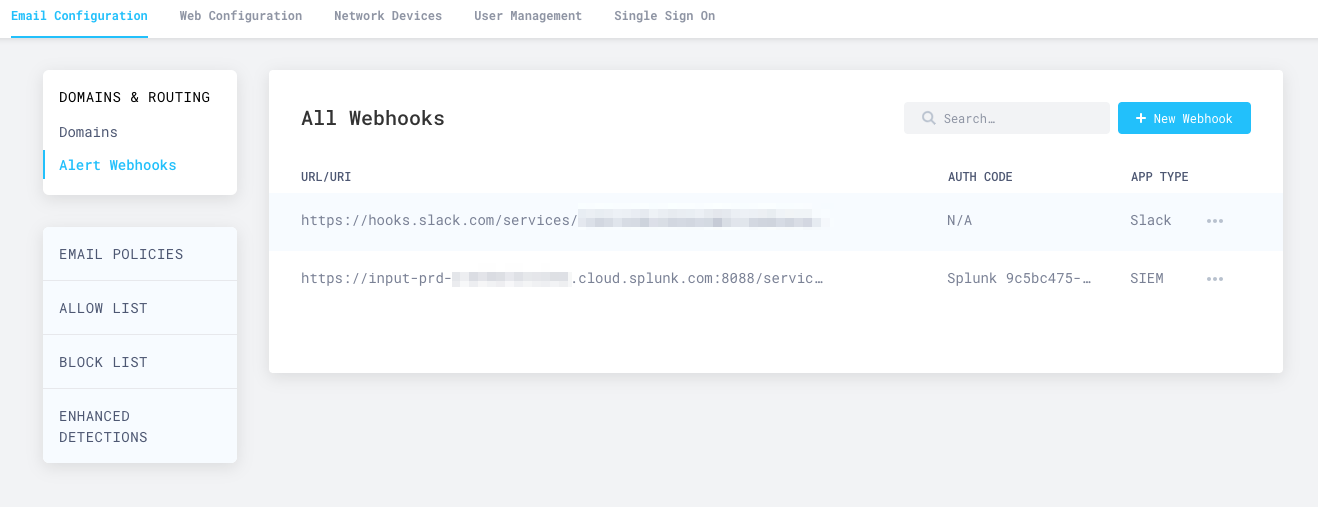
- Select Publish Webhook.
Your Splunk integration will now show up in the All Webhooks panel.
It will take about ten minutes or so for the configuration to fully propagate through the infrastructure of Cloudflare Cloud Email Security, and for events to start to appear in your searches. Once the configuration is propagated, events will start to appear in your instance of Splunk.