
Directly from Log Search results, customers can pivot to other parts of the Cloudflare dashboard to immediately take action as a result of their investigation.
From the
http_requestsorfw_eventsdataset results, right click on an IP Address or JA3 Fingerprint to pivot to the Investigate portal to lookup the reputation of an IP address or JA3 fingerprint.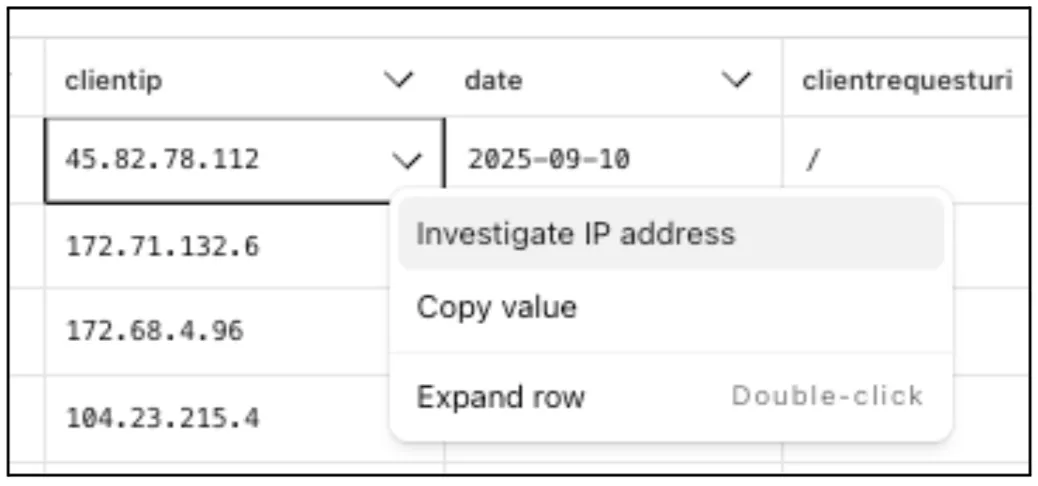
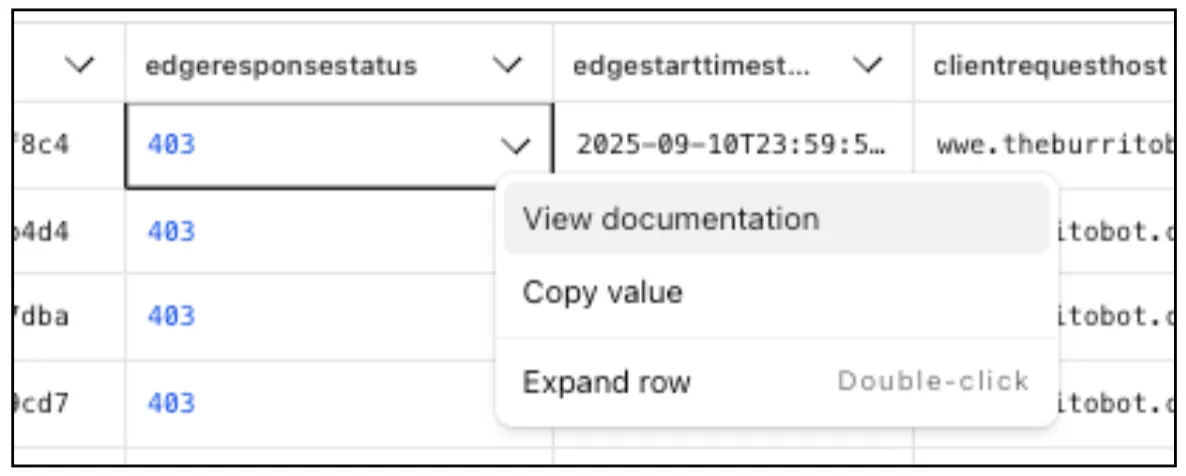
Easily learn about error codes by linking directly to our documentation from the EdgeResponseStatus or OriginResponseStatus fields.
From the
gateway_httpdataset, click on a policyid to link directly to the Zero Trust dashboard to review or make changes to a specific Gateway policy.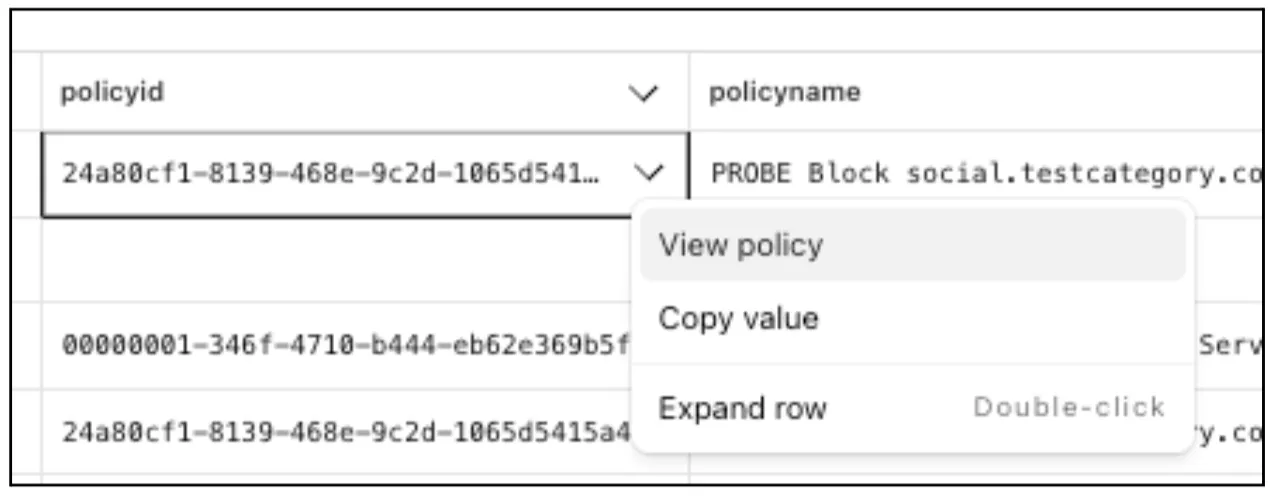
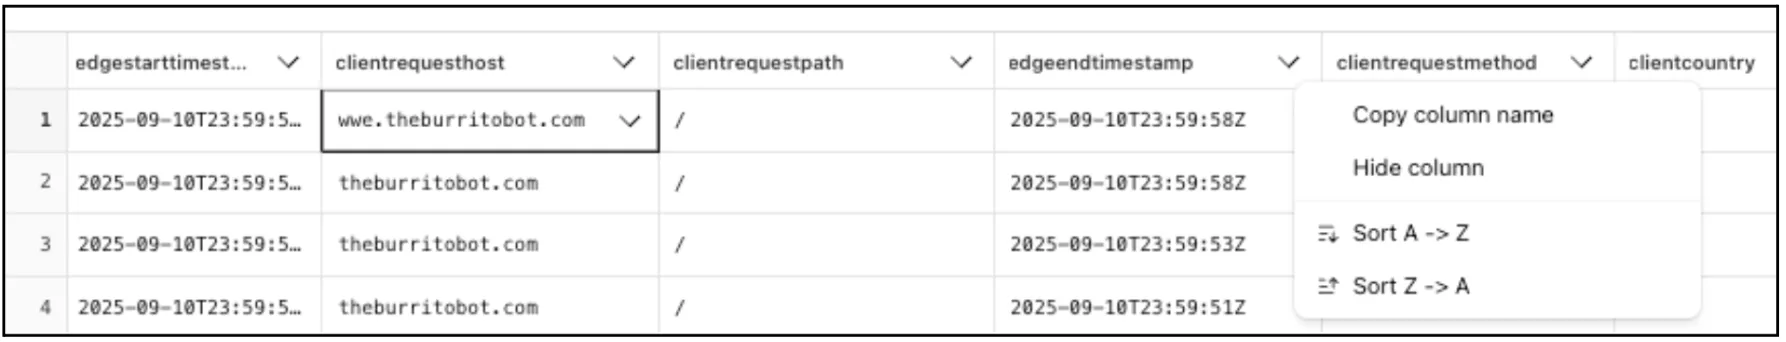
The results table view of Log Search has been updated with additional functionality and a more streamlined user experience. Users can now easily:
- Remove/add columns.
- Resize columns.
- Sort columns.
- Copy values from any field.
Log Explorer now supports logging and filtering on header or cookie fields in the
http_requestsdataset.Create a custom field to log desired header or cookie values into the
http_requestsdataset and Log Explorer will import these as searchable fields. Once configured, use the custom SQL editor in Log Explorer to view or filter on these requests.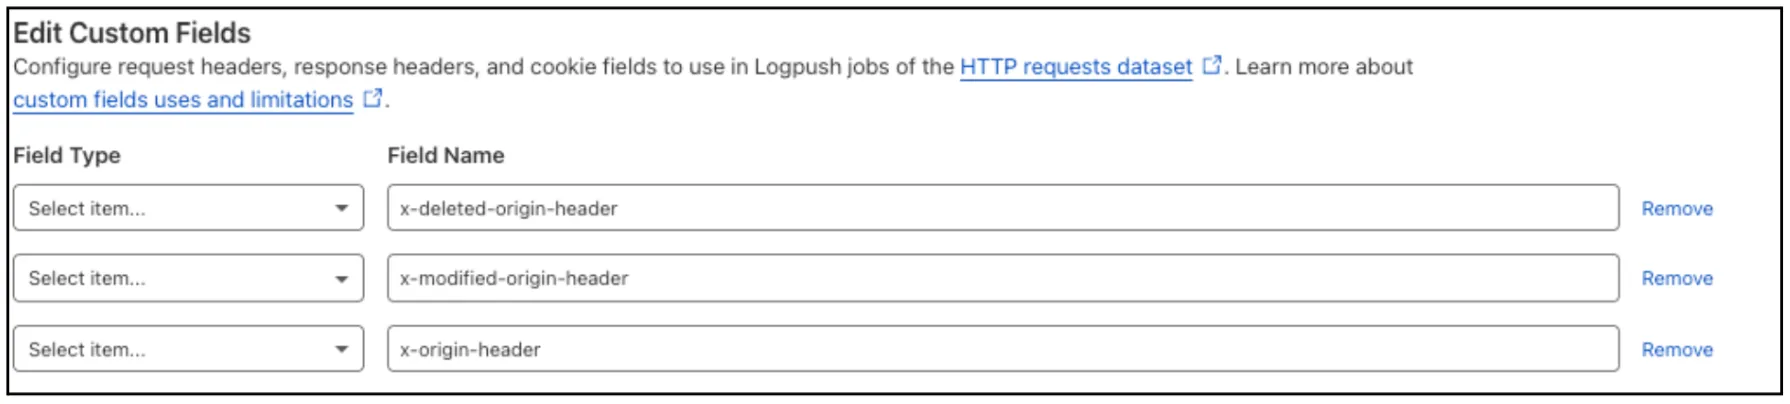
For more details, refer to Headers and cookies.
Digital Experience Monitoring (DEX) provides visibility into device connectivity and performance across your Cloudflare SASE deployment.
We've released an MCP server (Model Context Protocol) ↗ for DEX.
The DEX MCP server is an AI tool that allows customers to ask a question like, "Show me the connectivity and performance metrics for the device used by carly@acme.com", and receive an answer that contains data from the DEX API.
Any Cloudflare One customer using a Free, Pay-as-you-go, or Enterprise account can access the DEX MCP Server. This feature is available to everyone.
Customers can test the new DEX MCP server in less than one minute. To learn more, read the DEX MCP server documentation.
Cloudflare Logpush can now deliver logs from using fixed, dedicated egress IPs. By routing Logpush traffic through a Cloudflare zone enabled with Aegis IP, your log destination only needs to allow Aegis IPs making setup more secure.
Highlights:
- Fixed egress IPs ensure your destination only accepts traffic from known addresses.
- Works with any supported Logpush destination.
- Recommended to use a dedicated zone as a proxy for easier management.
To get started, work with your Cloudflare account team to provision Aegis IPs, then configure your Logpush job to deliver logs through the proxy zone. For full setup instructions, refer to the Logpush documentation.
Customers can now rely on Log Explorer to meet their log retention compliance requirements.
Contract customers can choose to store their logs in Log Explorer for up to two years, at an additional cost of $0.10 per GB per month. Customers interested in this feature can contact their account team to have it added to their contract.
Brand Protection detects domains that may be impersonating your brand — from common misspellings (
cloudfalre.com) to malicious concatenations (cloudflare-okta.com). Saved search queries run continuously and alert you when suspicious domains appear.You can now create and save multiple queries in a single step, streamlining setup and management. Available now via the Brand Protection bulk query creation API.
Cloudflare Logpush now supports IBM Cloud Logs as a native destination.
Logs from Cloudflare can be sent to IBM Cloud Logs ↗ via Logpush. The setup can be done through the Logpush UI in the Cloudflare Dashboard or by using the Logpush API. The integration requires IBM Cloud Logs HTTP Source Address and an IBM API Key. The feature also allows for filtering events and selecting specific log fields.
For more information, refer to Destination Configuration documentation.
Radar now introduces Certificate Transparency (CT) insights, providing visibility into certificate issuance trends based on Certificate Transparency logs currently monitored by Cloudflare.
The following API endpoints are now available:
/ct/timeseries: Retrieves certificate issuance time series./ct/summary/{dimension}: Retrieves certificate distribution by dimension./ct/timeseries_groups/{dimension}: Retrieves time series of certificate distribution by dimension./ct/authorities: Lists certification authorities./ct/authorities/{ca_slug}: Retrieves details about a Certification Authority (CA). CA information is derived from the Common CA Database (CCADB) ↗./ct/logs: Lists CT logs./ct/logs/{log_slug}: Retrieves details about a CT log. CT log information is derived from the Google Chrome log list ↗.
For the
summaryandtimeseries_groupsendpoints, the following dimensions are available (and also usable as filters):ca: Certification Authority (certificate issuer)ca_owner: Certification Authority Ownerduration: Certificate validity duration (between NotBefore and NotAfter dates)entry_type: Entry type (certificate vs. pre-certificate)expiration_status: Expiration status (valid vs. expired)has_ips: Presence of IP addresses in certificate Subject Alternative Names (SANs) ↗has_wildcards: Presence of wildcard DNS names in certificate SANslog: CT log namelog_api: CT log API (RFC6962 ↗ vs. Static ↗)log_operator: CT log operatorpublic_key_algorithm: Public key algorithm of certificate's keysignature_algorithm: Signature algorithm used by CA to sign certificatetld: Top-level domain for DNS names found in certificates SANsvalidation_level: Validation level ↗
Check out the new Certificate Transparency insights in the new Radar page ↗.
The Brand Protection API is now available, allowing users to create new queries and delete existing ones, fetch matches and more!
What you can do:
- create new string or logo query
- delete string or logo queries
- download matches for both logo and string queries
- read matches for both logo and string queries
Ready to start? Check out the Brand Protection API in our documentation.
Log Explorer customers can now monitor their data ingestion volume to keep track of their billing. Monthly usage is displayed at the top of the Log Search and Manage Datasets screens in Log Explorer.
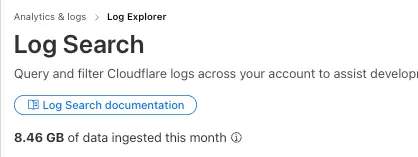
-
Radar now offers expanded insights into web crawlers, giving you greater visibility into aggregated trends in crawl and refer activity.
We have introduced the following endpoints:
/bots/crawlers/summary/{dimension}: Returns an overview of crawler HTTP request distributions across key dimensions./bots/crawlers/timeseries_groups/{dimension}: Provides time-series data on crawler request distributions across the same dimensions.
These endpoints allow analysis across the following dimensions:
user_agent: Parsed data from theUser-Agentheader.referer: Parsed data from theRefererheader.crawl_refer_ratio: Ratio of HTML page crawl requests to HTML page referrals by platform.
In addition to crawler-specific insights, Radar now provides a broader set of bot endpoints:
/bots/: Lists all bots./bots/{bot_slug}: Returns detailed metadata for a specific bot./bots/timeseries: Time-series data for bot activity./bots/summary/{dimension}: Returns an overview of bot HTTP request distributions across key dimensions./bots/timeseries_groups/{dimension}: Provides time-series data on bot request distributions across the same dimensions.
These endpoints support filtering and breakdowns by:
bot: Bot name.bot_operator: The organization or entity operating the bot.bot_category: Classification of bot type.
The previously available
verified_botsendpoints have now been deprecated in favor of this set of bot insights APIs. While current data still focuses on verified bots, we plan to expand support for unverified bot traffic in the future.Learn more about the new Radar bot and crawler insights in our blog post ↗.
Log Explorer is now GA, providing native observability and forensics for traffic flowing through Cloudflare.
Search and analyze your logs, natively in the Cloudflare dashboard. These logs are also stored in Cloudflare's network, eliminating many of the costs associated with other log providers.
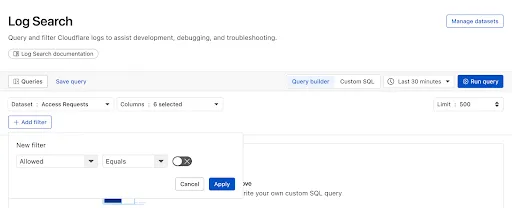
With Log Explorer, you can now:
- Monitor security and performance issues with custom dashboards – use natural language to define charts for measuring response time, error rates, top statistics and more.
- Investigate and troubleshoot issues with Log Search – use data type-aware search filters or custom sql to investigate detailed logs.
- Save time and collaborate with saved queries – save Log Search queries for repeated use or sharing with other users in your account.
- Access Log Explorer at the account and zone level – easily find Log Explorer at the account and zone level for querying any dataset.
For help getting started, refer to our documentation.
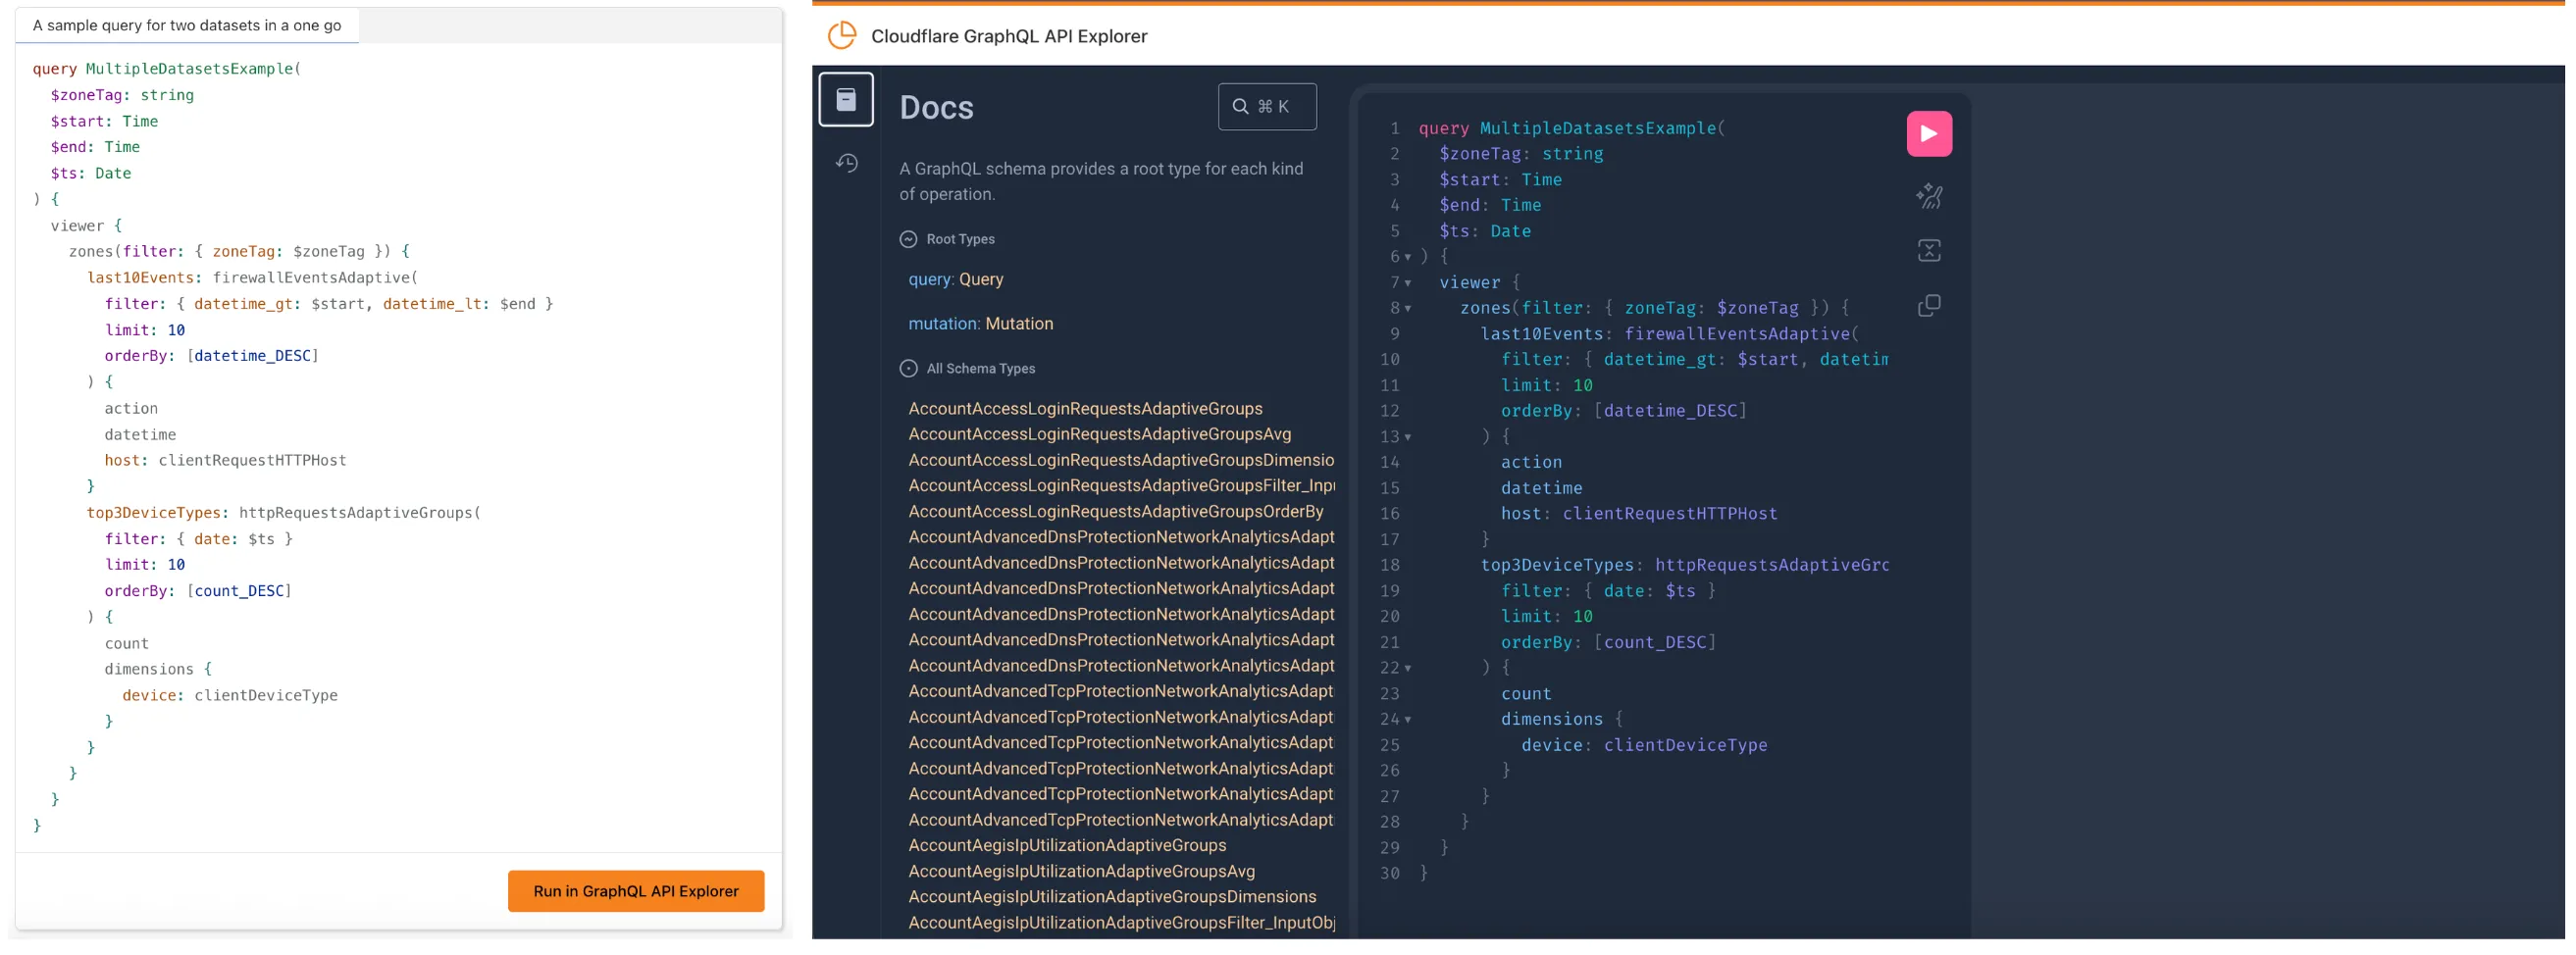
We’ve launched two powerful new tools to make the GraphQL Analytics API more accessible:
The new GraphQL API Explorer ↗ helps you build, test, and run queries directly in your browser. Features include:
- In-browser schema documentation to browse available datasets and fields
- Interactive query editor with autocomplete and inline documentation
- A "Run in GraphQL API Explorer" button to execute example queries from our docs
- Seamless OAuth authentication — no manual setup required
MCP Servers let you use natural language tools like Claude to generate structured queries against your data. See our blog post ↗ for details on how they work and which servers are available. The new GraphQL MCP server ↗ helps you discover and generate useful queries for the GraphQL Analytics API. With this server, you can:
- Explore what data is available to query
- Generate and refine queries using natural language, with one-click links to run them in the API Explorer
- Build dashboards and visualizations from structured query outputs
Example prompts include:
- “Show me HTTP traffic for the last 7 days for example.com”
- “What GraphQL node returns firewall events?”
- “Can you generate a link to the Cloudflare GraphQL API Explorer with a pre-populated query and variables?”
We’re continuing to expand these tools, and your feedback helps shape what’s next. Explore the documentation to learn more and get started.
Enterprise customers can now choose the geographic location from which a URL scan is performed — either via Security Center in the Cloudflare dashboard or via the URL Scanner API.
This feature gives security teams greater insight into how a website behaves across different regions, helping uncover targeted, location-specific threats.
What’s new:
- Location Picker: Select a location for the scan via Security Center → Investigate in the dashboard or through the API.
- Region-aware scanning: Understand how content changes by location — useful for detecting regionally tailored attacks.
- Default behavior: If no location is set, scans default to the user’s current geographic region.
Learn more in the Security Center documentation.
Custom Fields now support logging both raw and transformed values for request and response headers in the HTTP requests dataset.
These fields are configured per zone and apply to all Logpush jobs in that zone that include request headers, response headers. Each header can be logged in only one format—either raw or transformed—not both.
By default:
- Request headers are logged as raw values
- Response headers are logged as transformed values
These defaults can be overidden to suit your logging needs.
For more information refer to Custom fields documentation
Radar has expanded its security insights, providing visibility into aggregate trends in authentication requests, including the detection of leaked credentials through leaked credentials detection scans.
We have now introduced the following endpoints:
/leaked_credential_checks/summary/{dimension}: Retrieves summaries of HTTP authentication requests distribution across two different dimensions./leaked_credential_checks/timeseries_groups/{dimension}: Retrieves timeseries data for HTTP authentication requests distribution across two different dimensions.
The following dimensions are available, displaying the distribution of HTTP authentication requests based on:
compromised: Credential status (clean vs. compromised).bot_class: Bot class (human vs. bot).
Dive deeper into leaked credential detection in this blog post ↗ and learn more about the expanded Radar security insights in our blog post ↗.
Digital Experience Monitoring (DEX) provides visibility into device, network, and application performance across your Cloudflare SASE deployment. The latest release of the Cloudflare One agent (v2025.1.861) now includes device endpoint monitoring capabilities to provide deeper visibility into end-user device performance which can be analyzed directly from the dashboard.
Device health metrics are now automatically collected, allowing administrators to:
- View the last network a user was connected to
- Monitor CPU and RAM utilization on devices
- Identify resource-intensive processes running on endpoints
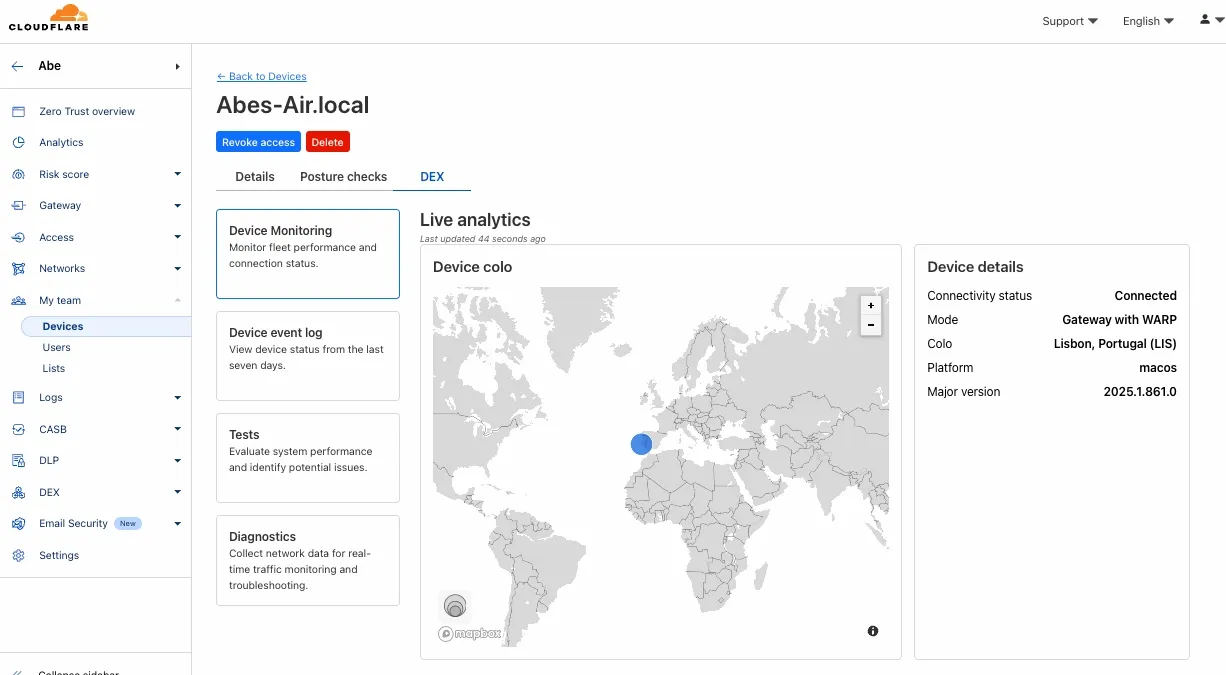
This feature complements existing DEX features like synthetic application monitoring and network path visualization, creating a comprehensive troubleshooting workflow that connects application performance with device state.
For more details refer to our DEX documentation.
We’ve streamlined the Logpush setup process by integrating R2 bucket creation directly into the Logpush workflow!
Now, you no longer need to navigate multiple pages to manually create an R2 bucket or copy credentials. With this update, you can seamlessly configure a Logpush job to R2 in just one click, reducing friction and making setup faster and easier.
This enhancement makes it easier for customers to adopt Logpush and R2.
For more details refer to our Logs documentation.
Radar has expanded its DNS insights, providing visibility into aggregated traffic and usage trends observed by our 1.1.1.1 DNS resolver. In addition to global, location, and ASN traffic trends, we are also providing perspectives on protocol usage, query/response characteristics, and DNSSEC usage.
Previously limited to the
toplocations and ASes endpoints, we have now introduced the following endpoints:/dns/timeseries: Retrieves DNS query volume over time./dns/summary/{dimension}: Retrieves summaries of DNS query distribution across ten different dimensions./dns/timeseries_groups/{dimension}: Retrieves timeseries data for DNS query distribution across ten different dimensions.
For the
summaryandtimeseries_groupsendpoints, the following dimensions are available, displaying the distribution of DNS queries based on:cache_hit: Cache status (hit vs. miss).dnsssec: DNSSEC support status (secure, insecure, invalid or other).dnsssec_aware: DNSSEC client awareness (aware vs. not-aware).dnsssec_e2e: End-to-end security (secure vs. insecure).ip_version: IP version (IPv4 vs. IPv6).matching_answer: Matching answer status (match vs. no-match).protocol: Transport protocol (UDP, TLS, HTTPS or TCP).query_type: Query type (A,AAAA,PTR, etc.).response_code: Response code (NOERROR,NXDOMAIN,REFUSED, etc.).response_ttl: Response TTL.
Learn more about the new Radar DNS insights in our blog post ↗, and check out the new Radar page ↗.
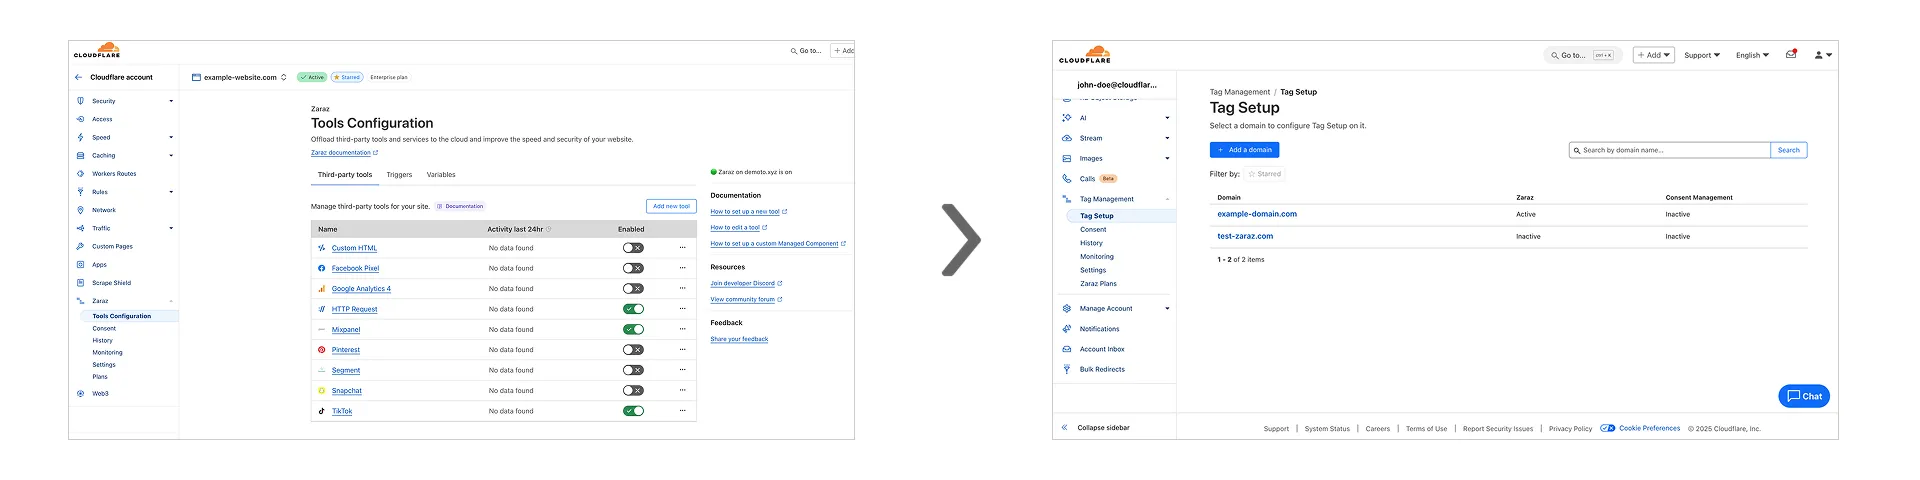
Previously, you could only configure Zaraz by going to each individual zone under your Cloudflare account. Now, if you’d like to get started with Zaraz or manage your existing configuration, you can navigate to the Tag Management ↗ section on the Cloudflare dashboard – this will make it easier to compare and configure the same settings across multiple zones.
These changes will not alter any existing configuration or entitlements for zones you already have Zaraz enabled on. If you’d like to edit existing configurations, you can go to the Tag Setup ↗ section of the dashboard, and select the zone you'd like to edit.
Radar has expanded its AI insights with new API endpoints for Internet services rankings, robots.txt analysis, and AI inference data.
Radar now provides rankings for Internet services, including Generative AI platforms, based on anonymized 1.1.1.1 resolver data. Previously limited to the annual Year in Review, these insights are now available daily via the API, through the following endpoints:
/ranking/internet_services/topshow service popularity at a specific date./ranking/internet_services/timeseries_groupstrack ranking trends over time.
Radar now analyzes robots.txt files from the top 10,000 domains, identifying AI bot access rules. AI-focused user agents from ai.robots.txt ↗ are categorized as:
- Fully allowed/disallowed if directives apply to all paths (
*). - Partially allowed/disallowed if restrictions apply to specific paths.
These insights are now available weekly via the API, through the following endpoints:
/robots_txt/top/user_agents/directiveto get the top AI user agents by directive./robots_txt/top/domain_categoriesto get the top domain categories by robots.txt files.
Radar now provides insights into public AI inference models from Workers AI, tracking usage trends across models and tasks. These insights are now available via the API, through the following endpoints:
/ai/inference/summary/{dimension}to view aggregatedmodelandtaskpopularity./ai/inference/timeseries_groups/{dimension}to track changes over time formodelortask.
Learn more about the new Radar AI insights in our blog post ↗.
Cloudflare has introduced new fields to two Gateway-related datasets in Cloudflare Logs:
-
Gateway HTTP:
ApplicationIDs,ApplicationNames,CategoryIDs,CategoryNames,DestinationIPContinentCode,DestinationIPCountryCode,ProxyEndpoint,SourceIPContinentCode,SourceIPCountryCode,VirtualNetworkID, andVirtualNetworkName. -
Gateway Network:
ApplicationIDs,ApplicationNames,DestinationIPContinentCode,DestinationIPCountryCode,ProxyEndpoint,SourceIPContinentCode,SourceIPCountryCode,TransportProtocol,VirtualNetworkID, andVirtualNetworkName.
-
The free version of Magic Network Monitoring (MNM) is now available to everyone with a Cloudflare account by default.
- Log in to your Cloudflare dashboard ↗, and select your account.
- Go to Analytics & Logs > Magic Monitoring.
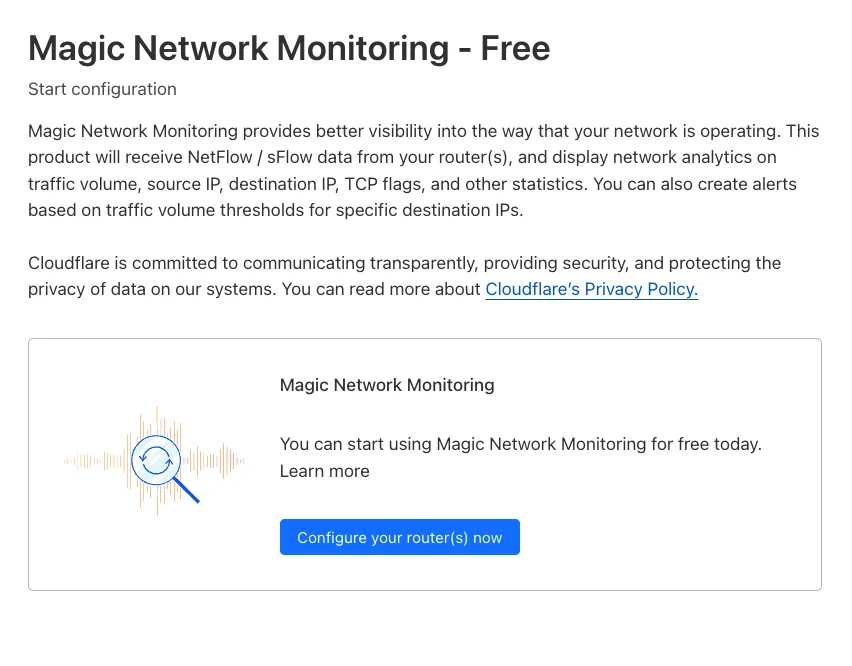
For more details, refer to the Get started guide.
Welcome to your new home for product updates on Cloudflare One.
Our new changelog lets you read about changes in much more depth, offering in-depth examples, images, code samples, and even gifs.
If you are looking for older product updates, refer to the following locations.