
Enterprise customers can now push per-connection WebSocket analytics to any Logpush destination using the new
websocket_analyticsdataset. Each log record is emitted when a WebSocket connection closes and includes fields that were previously only available to Cloudflare engineers via internal tooling.Key fields include:
ConnectionCloseReason— why the connection ended:peerReset,peerNoError,timedOut,upstreamReset,protocolViolation,unspecifiedError, ornone.ConnectionCloseSource— which side initiated the close:upstream,downstream,me, orboth.ConnectionTransportCloseCode— the TLS alert code or TCP-level close code for additional precision.RayID— correlate WebSocket connection events with your existing HTTP Request logs.
The dataset also includes directional byte counts (
BytesSentClient,BytesReceivedClient,BytesSentOrigin,BytesReceivedOrigin), connection timestamps, client IP, colo code, and request metadata from the original WebSocket upgrade.This data lets you build alerts on connection close patterns — for example, detecting spikes in TCP resets (
ConnectionCloseReason == "peerReset") grouped by host and data center — directly in your existing log analysis tools.For the full list of available fields, refer to WebSocket Analytics.
Cloudflare has updated Logpush datasets:
- Gateway DNS (added):
AppliedMaxTTLandUpstreamRecordTTLs. - Gateway HTTP (added):
Warnings. - HTTP requests (added):
CacheLockWaitedMs.
For the complete field definitions for each dataset, refer to Logpush datasets.
- Gateway DNS (added):
Cloudflare Logpush now supports firewall events as an account-scoped dataset. Configure a single Logpush job at the account level to receive firewall events for every zone in the account, instead of creating and maintaining a separate job per zone.
The dataset includes a new
ZoneNamefield so you can identify which zone each event came from when consuming logs in your downstream pipeline.- A new account-scoped
firewall_eventsdataset, configurable via the Logpush API or the Cloudflare dashboard. - The same fields and filter expressions supported by the existing zone-scoped firewall events dataset, plus the new
ZoneNamefield. - Support for all existing Logpush destinations.
- A new account-scoped
Cloudflare has updated Logpush datasets:
- WebSocket Analytics: A new dataset with fields including
BytesReceivedClient,BytesReceivedOrigin,BytesSentClient,BytesSentOrigin,ClientASN,ClientIP,ClientRequestHost,ClientRequestPath,ClientRequestUserAgent,ColoCode,ConnectionCloseReason,ConnectionCloseSource,ConnectionID,ConnectionTransportCloseCode,EdgeEndTimestamp,EdgeStartTimestamp, andRayID.
- Firewall events (added):
ZoneName. The Firewall events dataset is now also available for account-scope Logpush, in addition to the existing zone scope. - Email Security Alerts (added):
BCC,DKIMResult,DMARCPolicy,DMARCResult, andSPFResult.
For the complete field definitions for each dataset, refer to Logpush datasets.
- WebSocket Analytics: A new dataset with fields including
Radar now plots your IPv4 and IPv6 locations on the IP page ↗, shows the Cloudflare data centers serving your connection, and includes more detail about the autonomous system (AS) your primary IP belongs to.
The map of your connection now shows:
- IP location markers — The primary IP will show as a red marker. When both IP addresses do not geolocate to the same place, a second marker will appear in blue with a note explaining why IPv4 and IPv6 can resolve to different locations.
- Cloudflare data center markers — Cloudflare data centers now show as orange dots on the map and the one you are connected to is highlighted.
- Data center connectors — Each line connects your IP markers to their respective data centers.

Due to the data policies of our geolocation provider, this detailed location is only available for your own IP. Other IP addresses keep the current country-level view.
The AS card on the IP page now shows additional detail about the network an IP belongs to — including alternate names, the operator website, and an estimate of the AS user population — alongside the AS number and country.
Visit the Cloudflare Radar IP page ↗ to explore more details about your IP.
Regional Services now supports Regionalized IP Bindings, letting you regionalize traffic at the IP layer for prefixes you bring to Cloudflare through Bring Your Own IP (BYOIP).
Where Regional Hostnames regionalize traffic by hostname, Regionalized IP Bindings let you bind a CIDR from one of your prefixes to a region — ideal for address-map deployments and any service you address by IP rather than hostname. Cloudflare then terminates TLS and processes traffic to those addresses only within the data centers in that region.
Regionalized IP Bindings requires the Regional Services and Regional Services for BYOIP entitlements. Contact your account team to enable them.
To get started, refer to Regionalized IP Bindings.
Radar has changed how it measures Workers AI model and task popularity.
Previously, popularity was based on the number of unique accounts running inferences against each model or task. It is now based on the number of inferences, giving a more representative view of actual usage volume. This change will affect all new measurements as well as historical data. As a result, the model and task distributions shown on Radar may differ from what you saw previously, and historical trends may shift accordingly.
The Workers AI model popularity ↗ chart shows the distribution of inferences across models.

The Workers AI task popularity ↗ chart shows the distribution of inferences across tasks.

The same data is available via the following API endpoints:
Explore the data on the AI Insights page ↗.
TL;DR: Brand Protection now features an Automated Cease & Desist (C&D) workflow. When you discover an infringing domain hosted outside of Cloudflare, you can instantly generate, review, and download a custom-branded, pre-filled legal notice in seconds.
This update introduces a major shift from pure detection to actionable enforcement, eliminating the manual burden for your Trust & Safety and Legal teams:
- Instant WHOIS and Recipient Lookup: We automatically scrape registrar data and WHOIS contact information (such as the registrant or registrar abuse email) behind the scenes, highlighting exactly where your notice needs to be sent
- Smart Template Automation: We pre-fill your custom-branded templates with essential metadata, including the infringing domain, registrar name, and discovery date.
- Tailored Enforcement Tones: Choose from three default layout strategies depending on the severity of the infrastructure match:
- Exact Match: A formal demand for identical trademark infringements
- Similar Match: A standard notice optimized for typosquatting (one-character distance matches)
- Friendly Tone: An amicable initial outreach for potential unintentional or accidental infringements
- Full Editing Control: Before creating the final PDF, a real-time review screen allows you to fine-tune the messaging, modify placeholders, and ensure your text aligns perfectly with internal legal standards
When reviewing a malicious domain match inside your dashboard, your enforcement path splits depending on where the attacker is located:
- On the Cloudflare Network: If the domain uses Cloudflare’s network or registrar, trigger our existing integrated abuse reporting flow with one click.
- Hosted Elsewhere: If the domain is hosted on an external provider, click the Generate C&D Letter option to launch the new document builder, pick your template, verify the auto-populated recipient data, and download your finalized PDF.
You can manage your templates and enforce matches by going to the Cloudflare Dashboard > Application Security > Brand Protection and selecting your detected Brand Protection matches. For more information, read the Brand Protection documentation.
Note: Cloudflare does not represent you and cannot provide you with legal advice. Only you can decide whether your rights have been infringed, whether a cease and desist letter is appropriate, and what that letter should say.
Cloudforce One users can now turn Threat Events indicators into active defense. With this update, users can instantly generate a WAF rule that matches the dynamic list of IP addresses returned by any of their Saved Views.
Threat intelligence is most effective when it is immediately actionable. Previously, blocking threat actors required manually extracting indicators from threat events and copying them into your firewall rules. This new integration bridges the gap between threat discovery and threat mitigation:
- When you identify an active threat pattern - such as an ongoing campaign targeting a specific industry, or using a known indicator type - you can pivot from investigation to mitigation in a single click.
- Instead of writing complex, static IP rules, this functionality allows you to leverage the specific filtering logic you have already defined and saved within your Threat Events ecosystem.
- Automating the generation of the WAF rule expression from your threat views eliminates manual copying errors, ensuring that the right malicious infrastructure is blocked instantly.
You can implement these rules through both the dashboard UI and via the API / Terraform.
Go to Cloudflare Dashboard > Application Security > Threat Intelligence > Manage Views, select your desired view, and select Create WAF Rule.
This will automatically pre-populate the WAF rule builder with the matching threat event IP indicators.
You can also automate this workflow by utilizing the WAF Rule Builder API alongside your Threat Events saved views endpoints.
TL;DR: We’ve launched Threat Actor Profiles directly inside the Threat Events dashboard. You can now immediately pivot from a generic alert or blocked event to a profile that unmasks the "Who, Why, and How" behind a threat event.
Security teams often suffer from a visibility gap. When an attack is blocked, it's difficult to know if it was a random automated bot or a sophisticated advanced persistent threat (APT) campaign specifically targeting your industry. Finding out usually means leaving your security dashboard to hunt through external OSINT feeds or static, out-of-date threat reports. Threat Actor Profiles solve this by sharing Cloudforce One’s deep adversary research directly inside your workflow:
- Cloudflare sees the traffic in real-time across approximately 20% of the web. This means actor profiles display active malicious infrastructure the moment it touches our global edge.
- Every profile provides clear strategic and tactical modules including alternative aliases, origin tracking, historical threat event volume, and MITRE ATT&CK mapping detailing the adversary's technical methods.
- You can search the dedicated threat actor directory or click an actor's name inside any threat event to view all details and related events to the specific threat actor.
Adversary tracking is now available in the Cloudflare Dashbboard and ready to be included in your daily investigation workflow:
- Click on the Threat Actor name in the Threat Events table to open their full identity profile and review their aliases and attack stats.
- Navigate to Cloudflare Dashboard > Application Security > Threat Intelligence to explore the new Threat Actors tab. Here, you can browse a card-based directory of all established entities tracked by Cloudforce One.
Learn more in the Cloudforce One documentation ↗.
Radar now provides finer-grained traffic charts for longer time ranges. Previously, selecting a 1-3 month view on HTTP and NetFlows charts defaulted to weekly aggregation, which was too coarse to surface meaningful trends. Views longer than 3 months defaulted to monthly aggregation, returning as few as 7 data points for a 6-month range.
The new defaults are:
- 1-3 months: daily granularity (7x more data points)
- Longer than 3 months (HTTP and NetFlows): weekly granularity (4x more data points)
For example, a 12-week traffic view previously showed weekly data:

The same view now shows daily data:

Similarly, a 1-year HTTP traffic view that previously showed just 12 monthly data points now provides 52 weekly data points.
Visit Cloudflare Radar ↗ to explore the new granular views.
Cloudflare has updated Logpush datasets:
- Turnstile Events: A new dataset with fields including
ASN,Action,BrowserMajor,BrowserName,ClientIP,CountryCode,EventType,Hostname,OSMajor,OSName,Sitekey,Timestamp, andUserAgent.
For the complete field definitions for each dataset, refer to Logpush datasets.
- Turnstile Events: A new dataset with fields including
Cloudflare has updated Logpush datasets:
- DEX Device State Events (added):
DeviceRegistrationProfileID. - Gateway HTTP (added):
AddedHeaders,DeletedHeaders, andSetHeaders. - HTTP requests (added):
MatchedRules.
For the complete field definitions for each dataset, refer to Logpush datasets.
- DEX Device State Events (added):
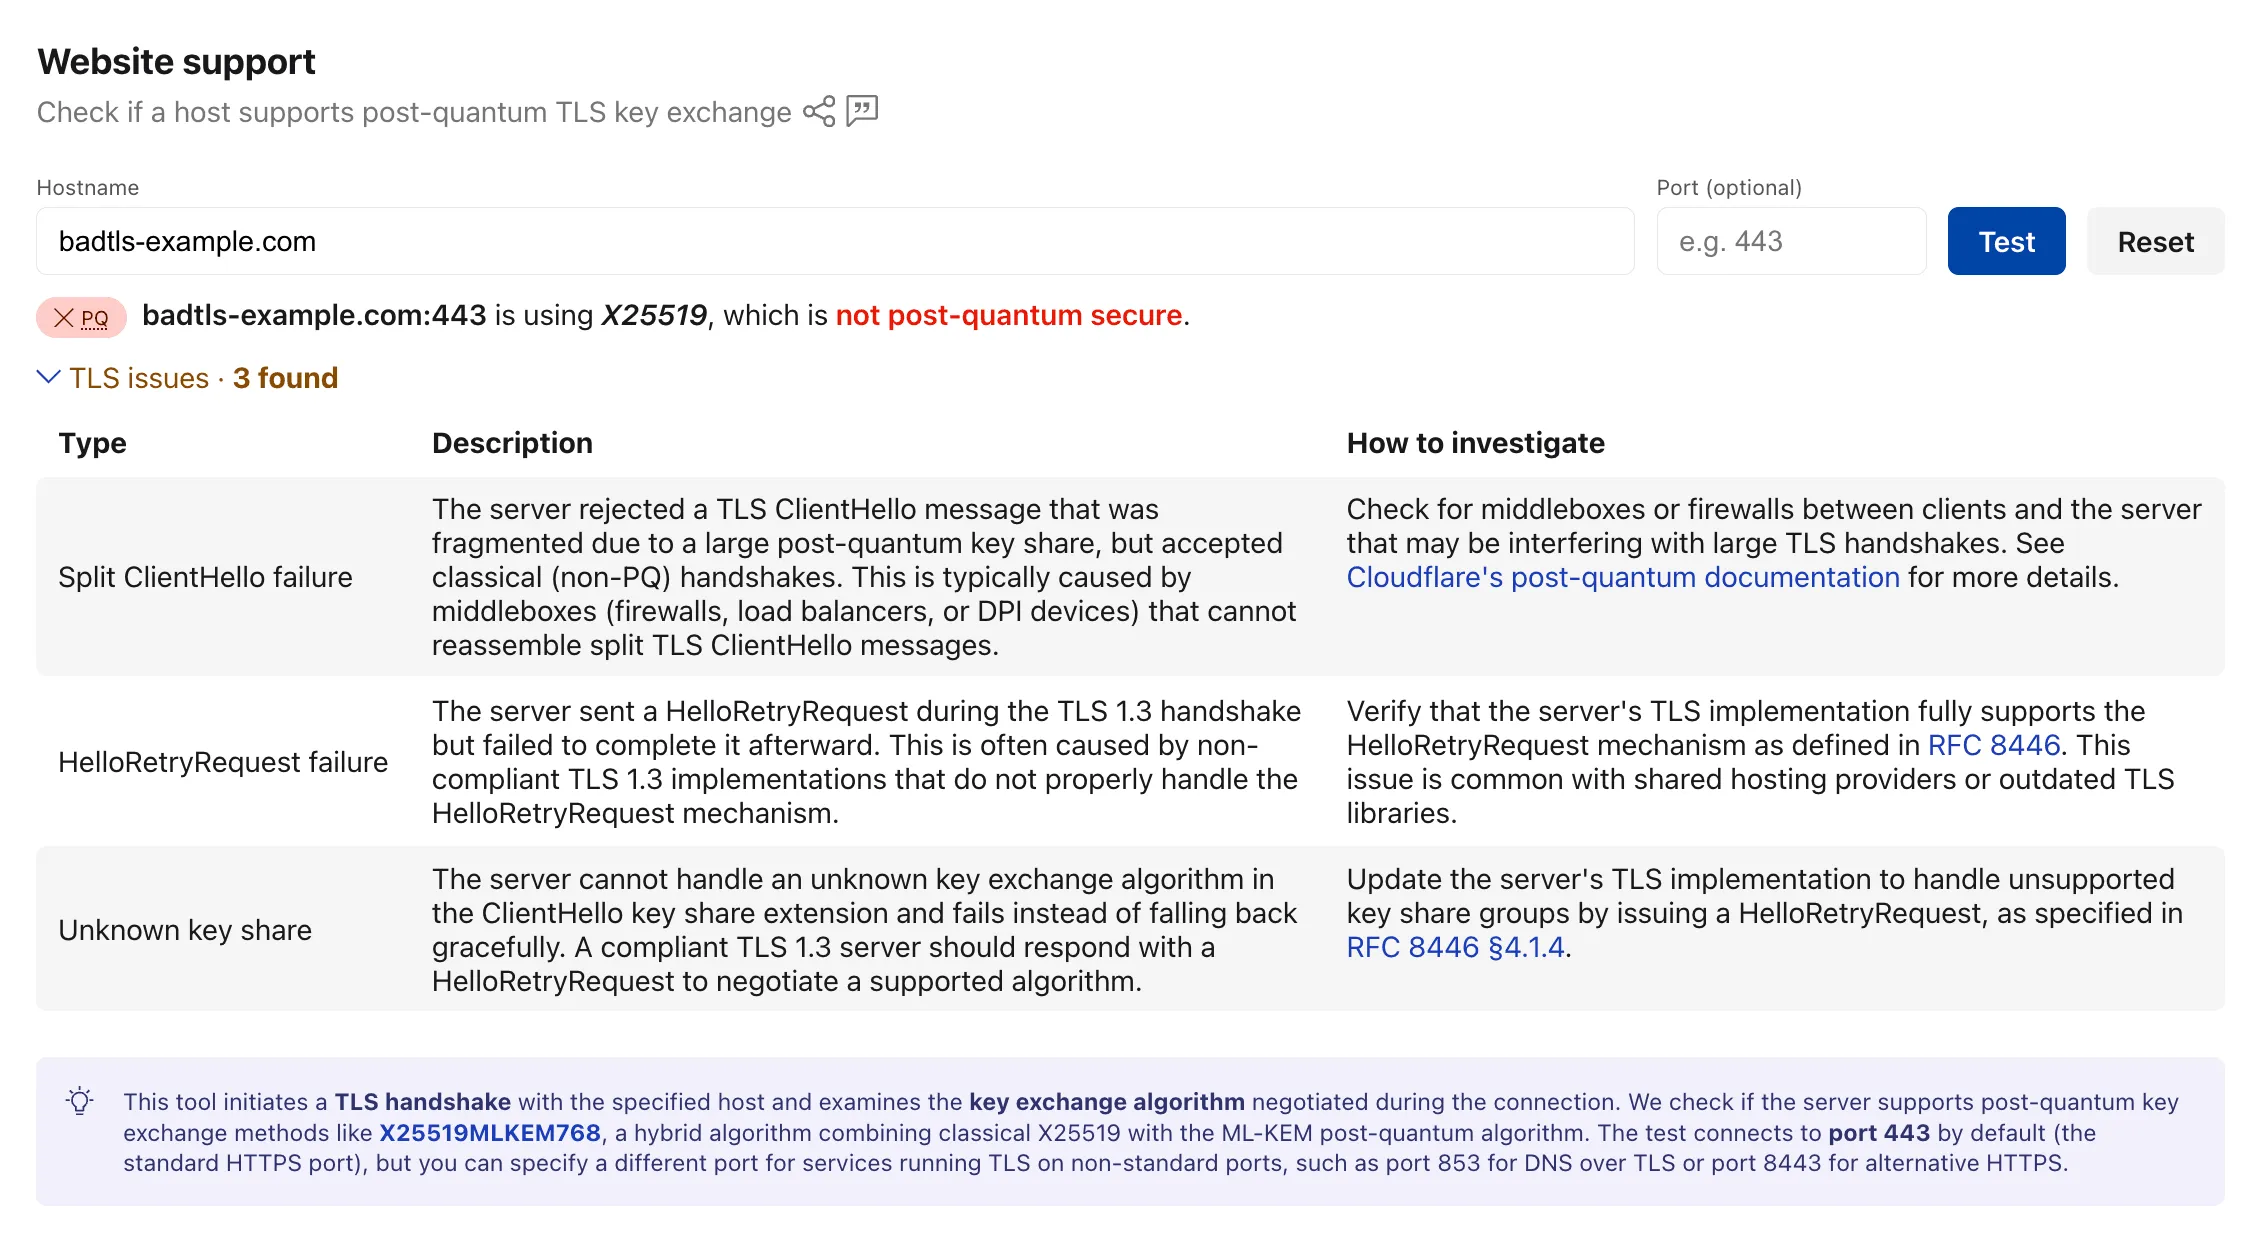
The Radar post-quantum TLS support checker ↗ now also reports TLS bugs detected during the handshake test. When a scanned host exhibits compatibility issues, the results include details on the specific bugs detected, along with guidance on how to investigate and remediate each issue. The bugs section only appears for hosts where issues are found.
The following TLS bugs are detected:
- Split ClientHello — The connection fails with a fragmented post-quantum
ClientHellobut succeeds with classical handshakes. Typically caused by middleboxes or firewalls that cannot reassemble split TLS messages. - HRR Failure — The server sends a
HelloRetryRequestbut fails to complete the handshake afterward. - Unknown Keyshare — The server cannot handle unknown key exchange algorithms and fails instead of responding with a
HelloRetryRequestas required by the TLS 1.3 specification.
Bug detection data is available through the existing
/post_quantum/tls/supportendpoint.Visit the Post-Quantum Encryption ↗ page to test a host.
- Split ClientHello — The connection fails with a fragmented post-quantum
Security Insights scans now run more often. Cloudflare scans Free accounts every 7 days, Pro and Business accounts every 3 days, and Enterprise accounts daily.
In addition, all accounts and zones now receive scans by default. You no longer need to enable scans before Cloudflare checks your account for misconfigurations, vulnerabilities, and other security risks.
Granular on-demand scans are now available on any plan. You can trigger an on-demand scan for any zone, insight, insight type from the Cloudflare dashboard in order to quickly re-check your security posture after remediating an issue.
To learn more, refer to the Security Insights documentation.
Radar now includes two new charts on the traffic page ↗ that provide deeper insights into the composition of HTTP traffic: a content type distribution chart and an API traffic share chart.
The new Content type ↗ chart displays the distribution of HTTP response content types, grouped into high-level categories. A traffic type selector allows filtering by human, bot, or all traffic. The existing Bot vs. Human ↗ chart also gained a content type category filter, allowing users to see the bot/human split for specific content categories.
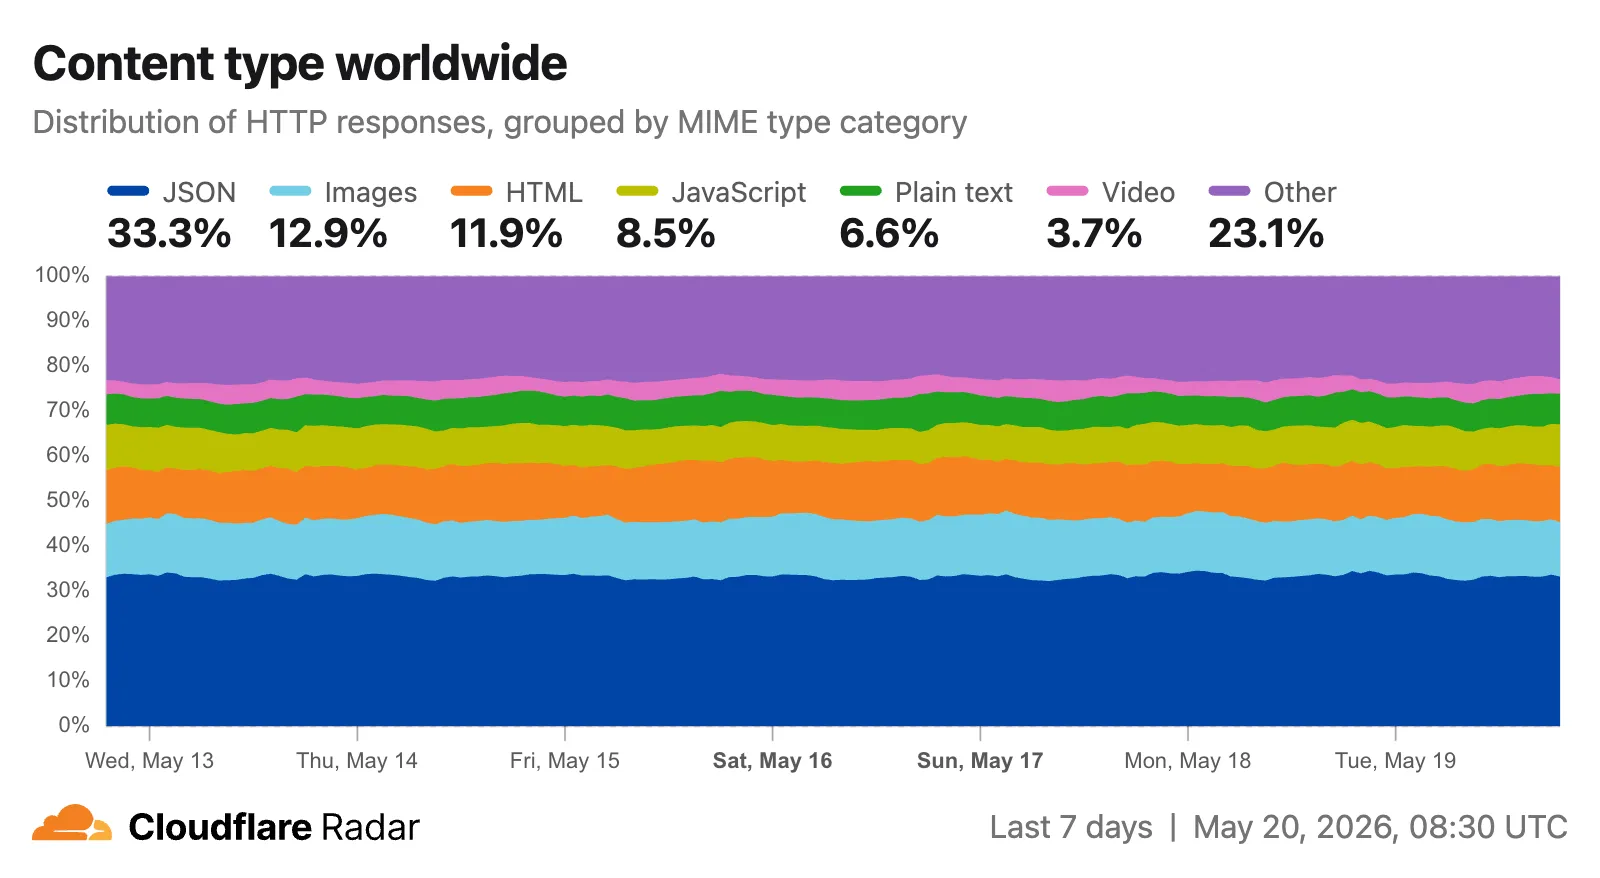
Content type categories:
- HTML — Web pages (
text/html) - Images — All image formats (
image/*) - JSON — JSON data and API responses (
application/json,*+json) - JavaScript — Scripts (
application/javascript,text/javascript) - CSS — Stylesheets (
text/css) - Plain Text — Unformatted text (
text/plain) - Fonts — Web fonts (
font/*,application/font-*) - XML — XML documents and feeds (
text/xml,application/xml,application/rss+xml,application/atom+xml) - YAML — Configuration files (
text/yaml,application/yaml) - Video — Video content and streaming (
video/*,application/ogg,*mpegurl) - Audio — Audio content (
audio/*) - Markdown — Markdown documents (
text/markdown) - Documents — PDFs, Office documents, ePub, CSV (
application/pdf,application/msword,text/csv) - Binary — Executables, archives, WebAssembly (
application/octet-stream,application/zip,application/wasm) - Serialization — Binary API formats (
application/protobuf,application/grpc,application/msgpack) - Other — All other content types
The
CONTENT_TYPEdimension andcontentTypefilter are available on the HTTP summary, timeseries groups, and timeseries endpoints.The new API traffic ↗ chart shows the percentage of dynamic (non-cacheable) HTTP request traffic that is API-related. API traffic is identified by JSON or XML response content types (
application/json,application/xml,text/xml) on HTTP requests that returned a 200 status code. A traffic type selector allows switching between human traffic, bot traffic, or all traffic.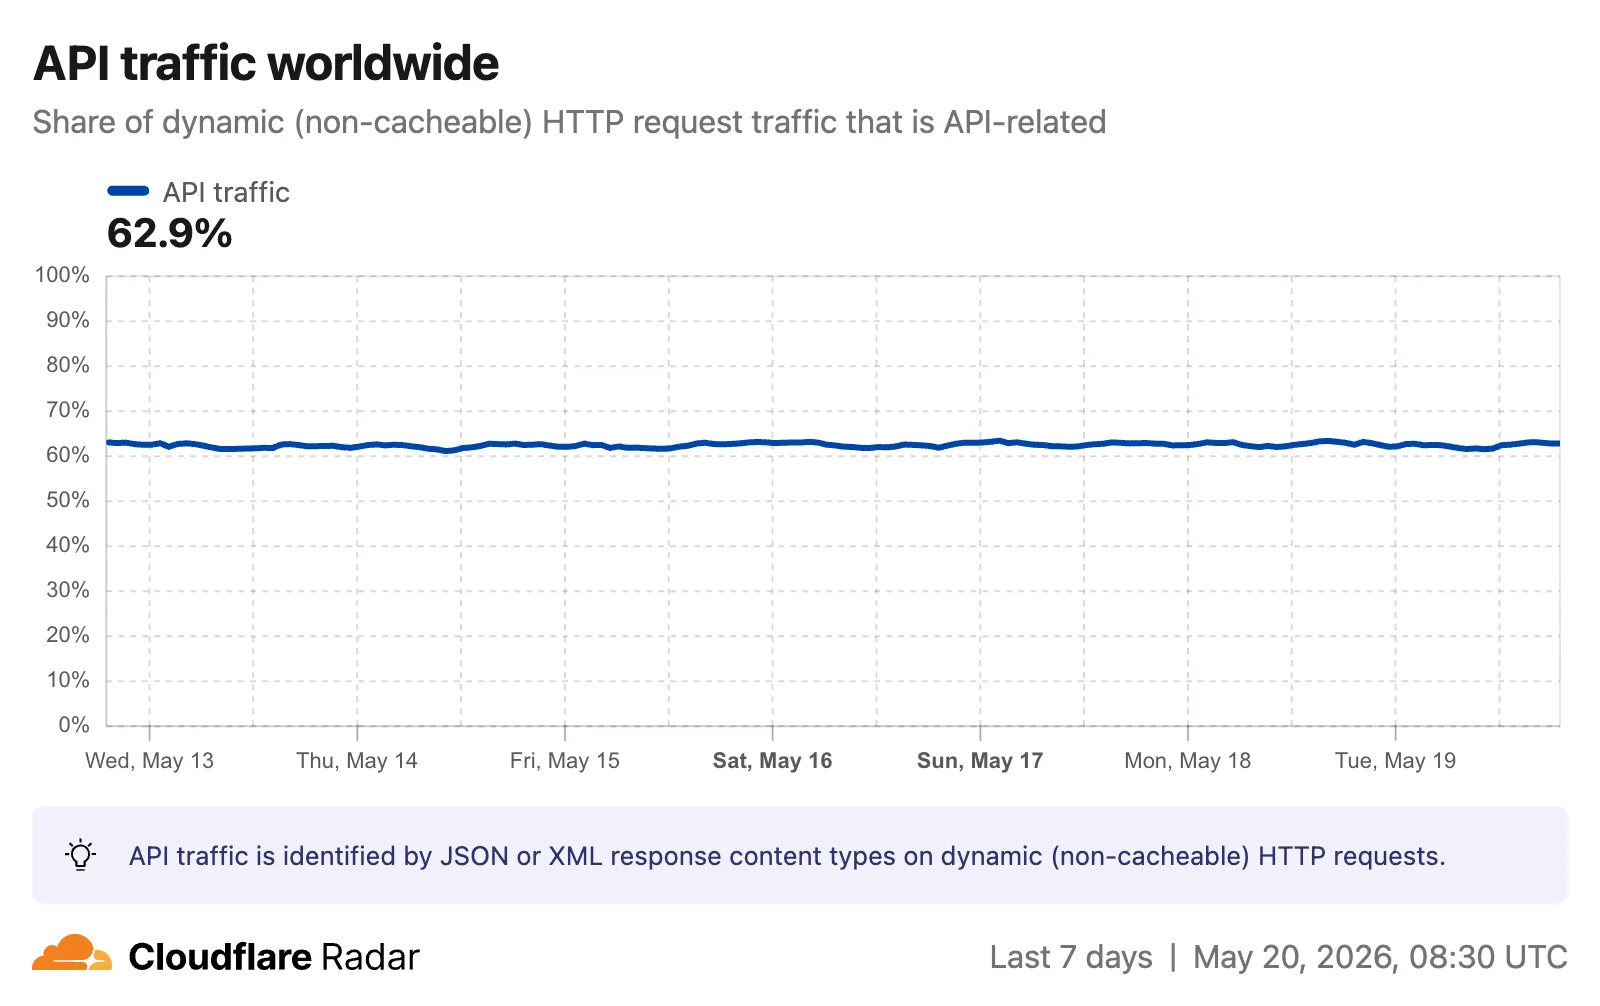
The
API_TRAFFICdimension is available on the existing HTTP summary and timeseries groups endpoints. AnapiTrafficfilter (APIorNON_API) can also be applied to HTTP timeseries requests to retrieve raw request counts for API-only or non-API traffic.Visit the Radar traffic page ↗ to explore these new charts.
- HTML — Web pages (
Radar now includes an MRT Explorer ↗ tool in the Routing section. Route collectors like RIPE RIS and RouteViews publish MRT (Multi-Threaded Routing Toolkit) dump files containing BGP announcements, withdrawals, and route attributes. The new tool parses these files entirely in the browser — nothing gets uploaded.
Paste a URL to fetch an MRT file remotely, drag and drop one onto the page, or browse for a local file. Gzip and bzip2 compressed files are supported. A sample file is also available to get started right away.
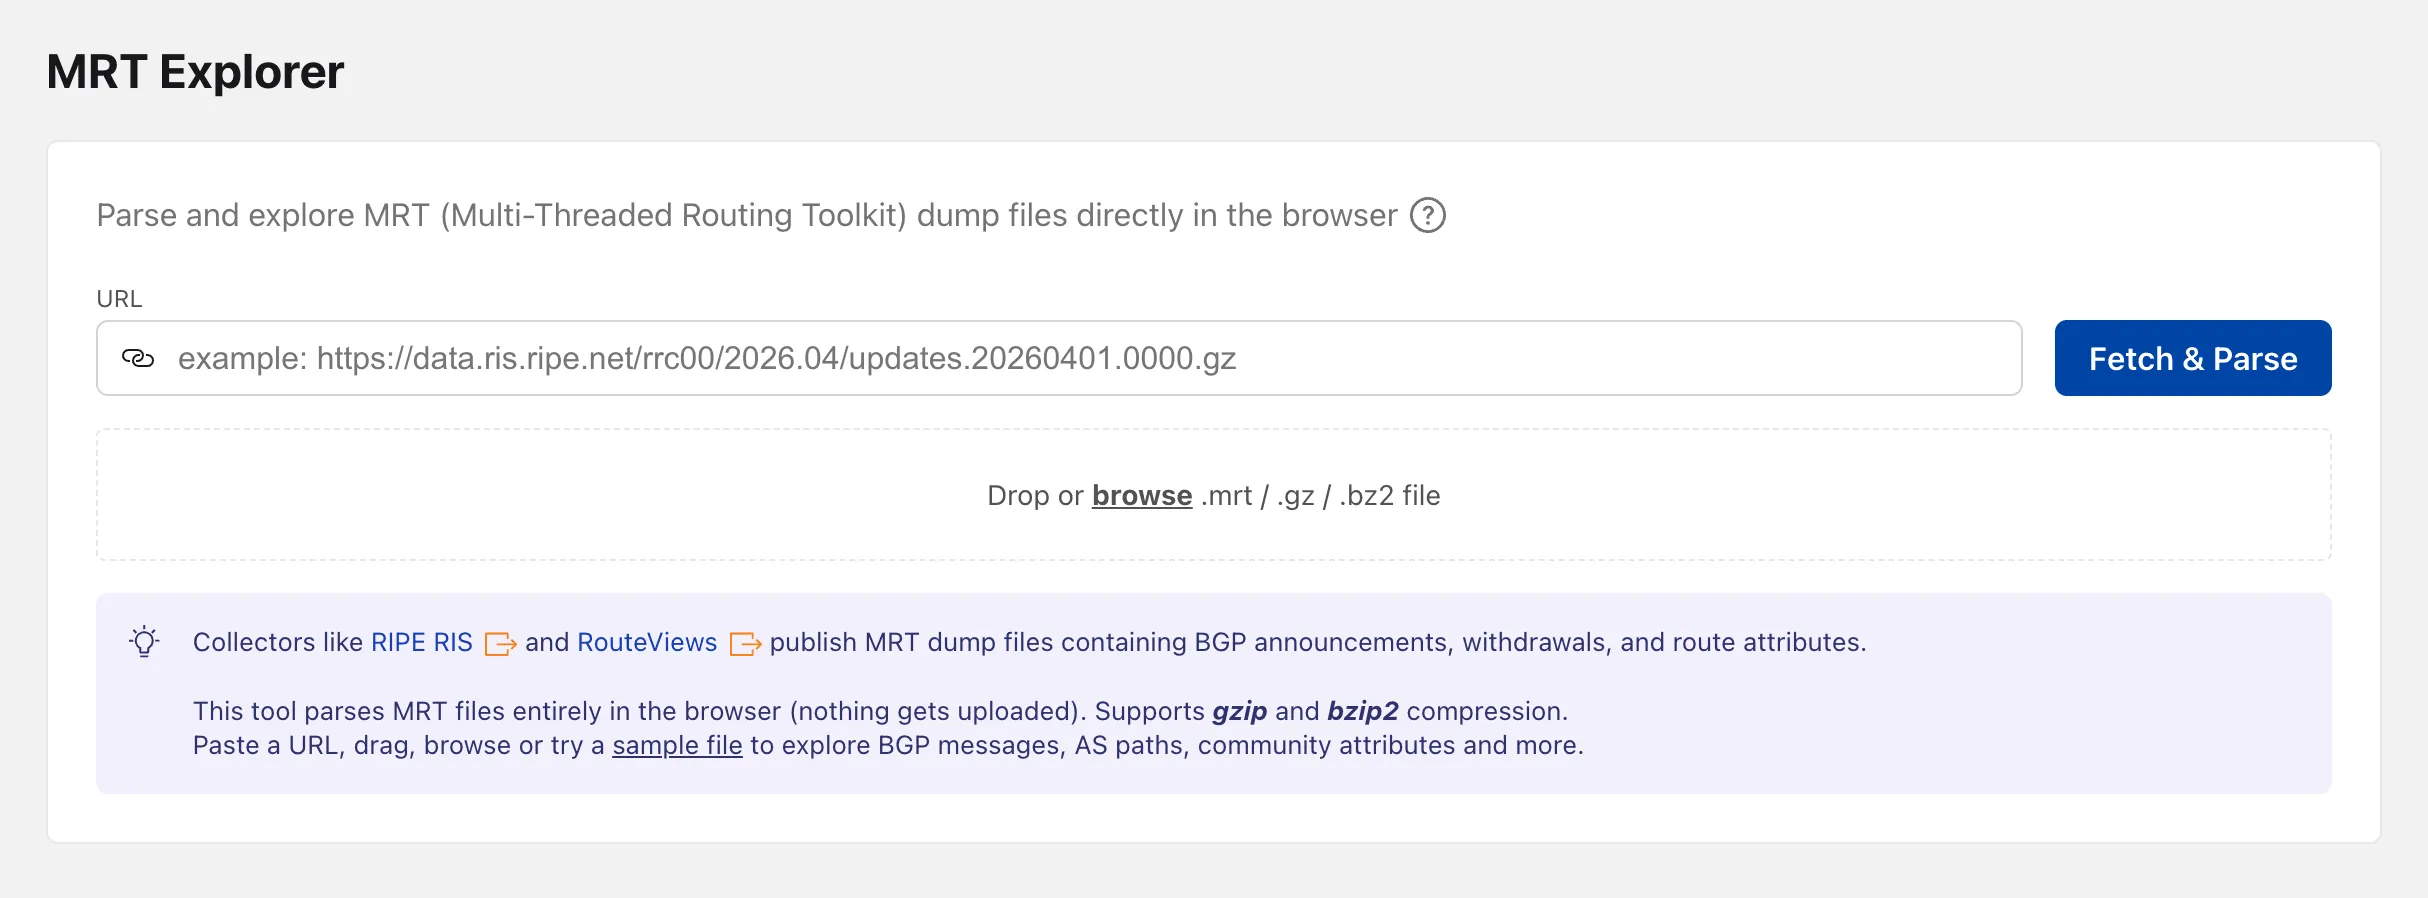
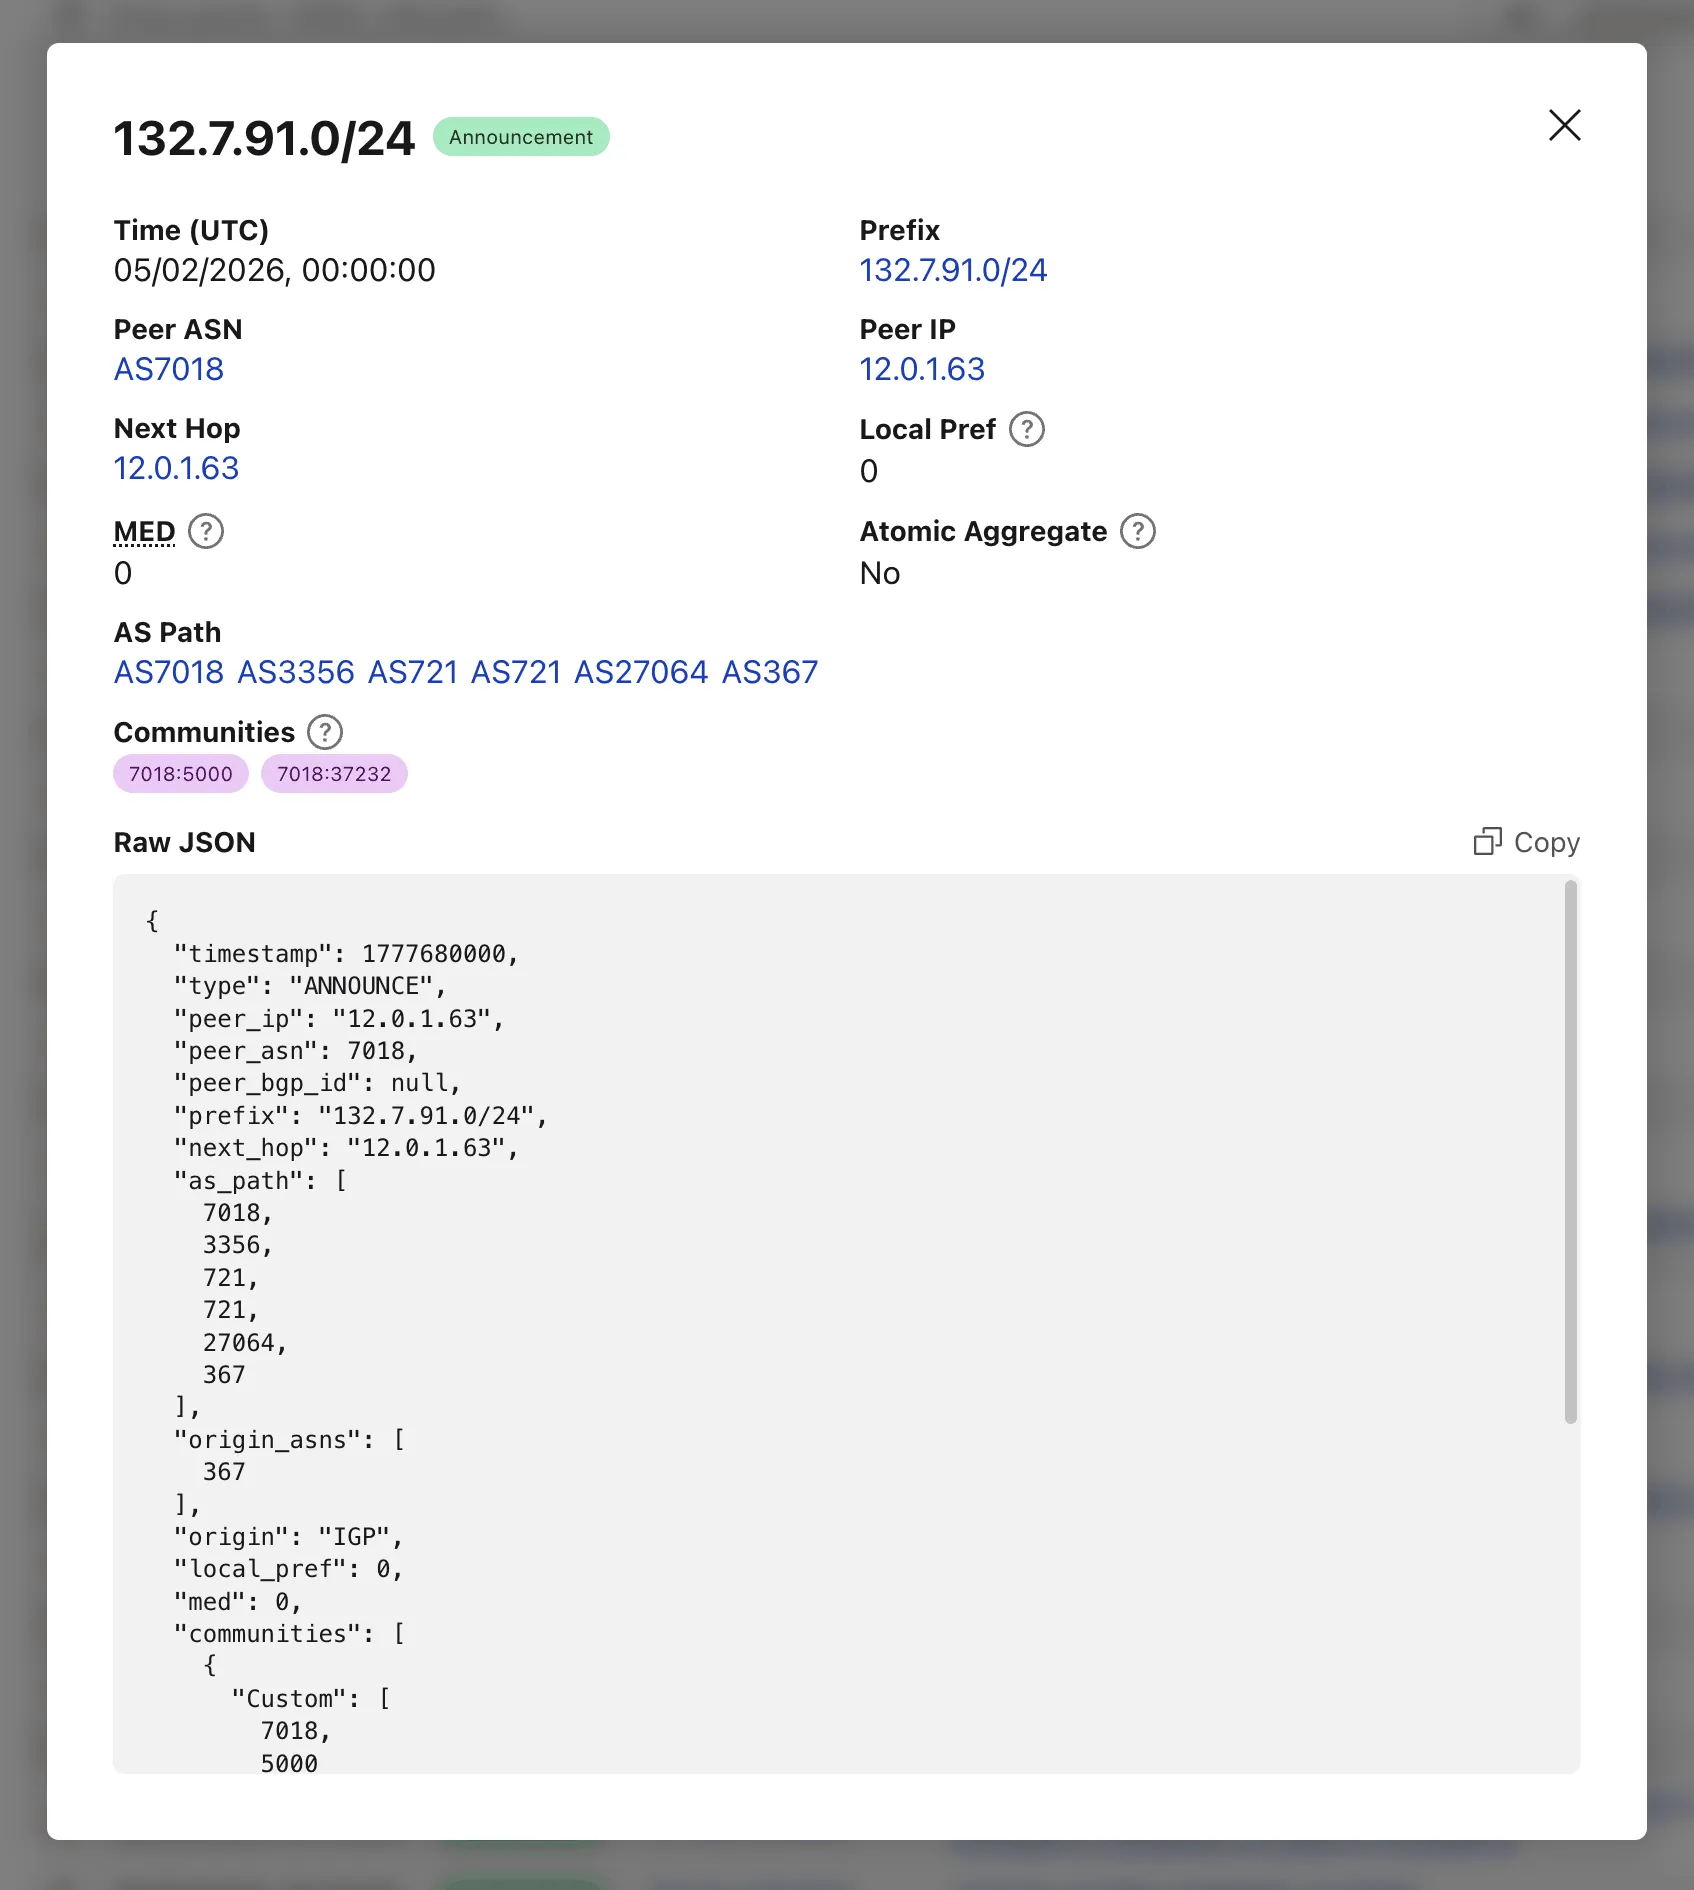
Once parsed, the tool lists every BGP event with its timestamp, prefix, AS path, OTC (Only to Customer), and community attributes.
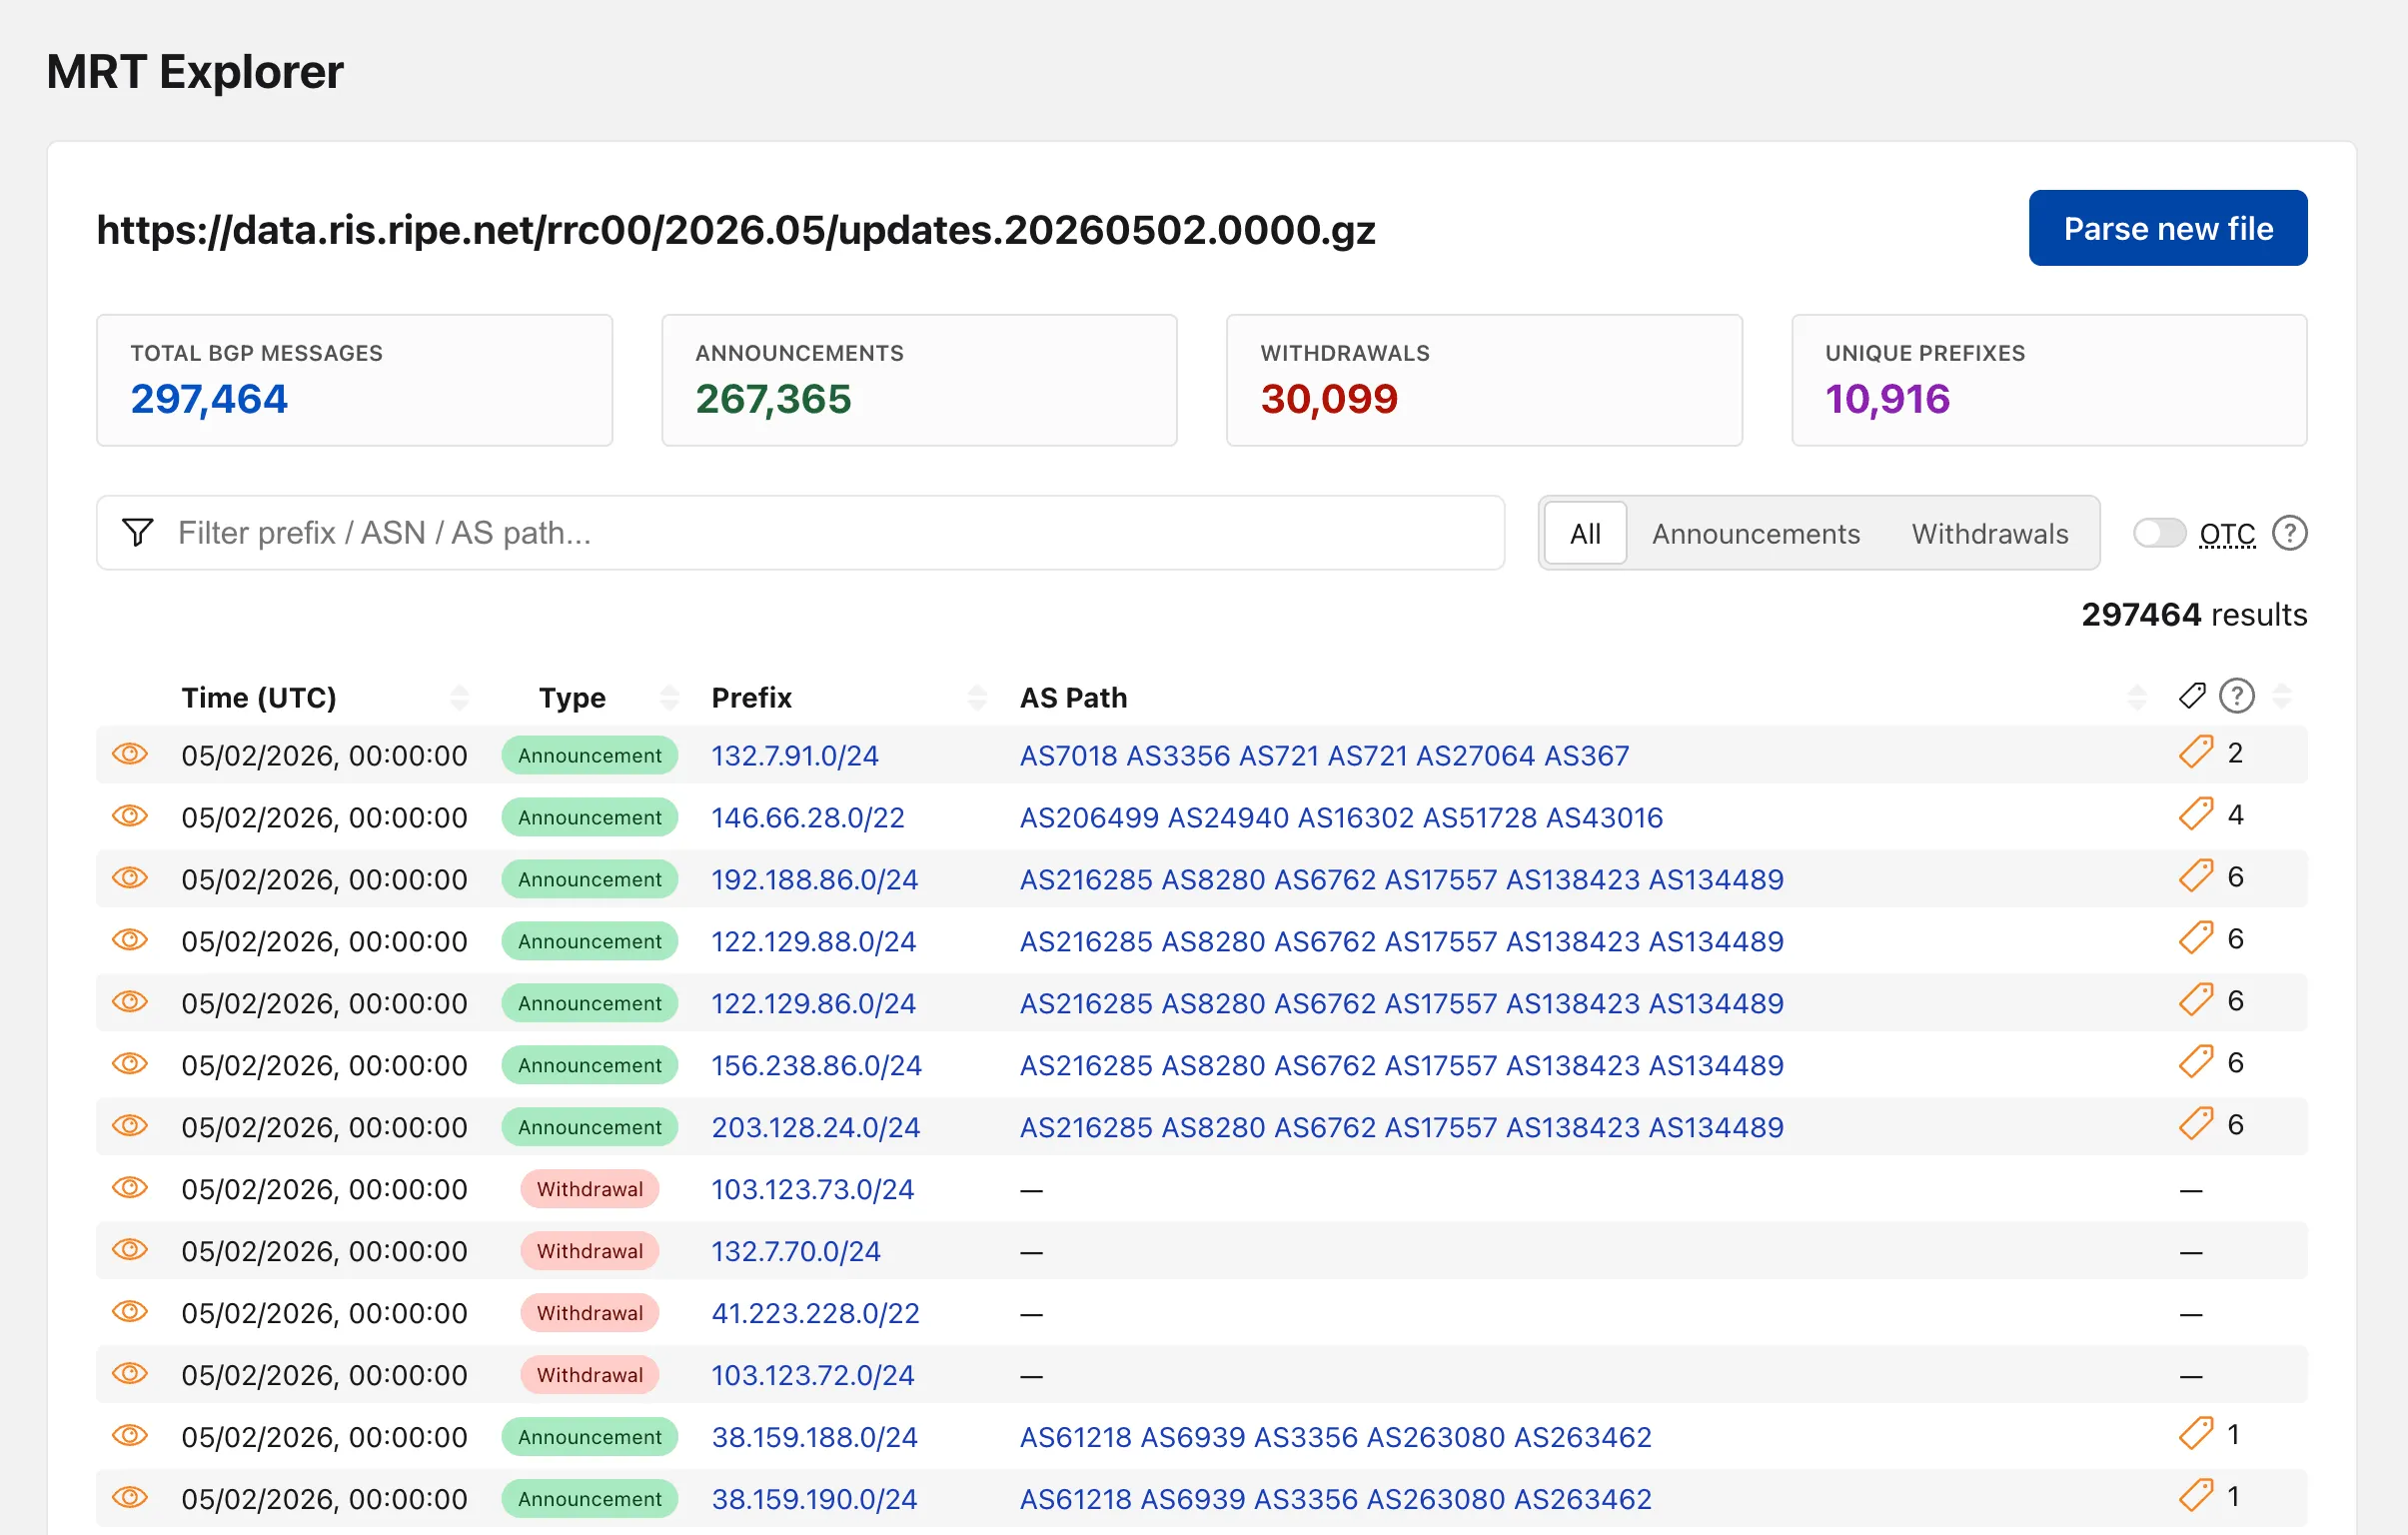
Clicking on the "View details" action opens a modal with additional properties and the full event JSON.
When loading a file by URL, the query string captures the source so the link can be shared directly — the recipient's browser immediately fetches and parses the same file.
Try the MRT Explorer on Cloudflare Radar ↗.
Cloudflare has updated Logpush datasets:
- Email Security Post-Delivery Events: A new dataset with fields including
AlertID,CompletedAt,Destination,FinalDisposition,Folder,From,FromName,MessageID,MessageTimestamp,MicrosoftTenantID,Operation,PostfixID,Reasons,Recipient,RequestedAt,RequestedBy,RequestedDisposition,Status,Subject,Success, andTo. - Magic Network Monitoring Flow Logs: A new dataset with fields including
AWSVPCFlowJSON,Bits,DestinationAS,DestinationAddress,DestinationPort,DeviceID,EgressBits,EgressPackets,Ethertype,FlowProtocol,FlowTimestamp,NumFlows,PacketID,Packets,Protocol,RuleIDs,SampleRate,SampleRateType,SamplerAddress,SourceAS,SourceAddress,SourcePort,TcpFlags, andTimestamp.
- Firewall events (added):
AISecurityInjectionScore,AISecurityPIICategories,AISecurityTokenCount, andAISecurityUnsafeTopicCategories. - HTTP requests (added):
AISecurityInjectionScore,AISecurityPIICategories,AISecurityTokenCount,AISecurityUnsafeTopicCategories, andSubrequests.
For the complete field definitions for each dataset, refer to Logpush datasets.
- Email Security Post-Delivery Events: A new dataset with fields including
The
/cdn-cgi/rumbeacon endpoint now returns405 Method Not Allowedfor non-POST requests instead of404 Not Found. The response includes anAllow: POST, OPTIONSheader per RFC 9110 §15.5.6 ↗.Previously, sending a
GETor other non-POST request to this endpoint returned a404, which was misleading because it suggested the endpoint did not exist. The new405response clearly indicates that the endpoint exists but only acceptsPOSTrequests.The Web Analytics beacon (
beacon.min.js) already usesPOSTfor all metric submissions, so this change does not affect normal beacon operation.OPTIONSrequests for CORS preflight continue to work as before.For more information, refer to the Web Analytics FAQ.
We’ve added a new Agent Readiness tab to URL Scanner reports accessible via the Cloudflare dashboard. This feature evaluates your site against emerging AI standards and provides six specialized scores to help you optimize for the next generation of AI agents and automated discovery.
The Internet is shifting from a human-read web to a machine-read web. AI agents now browse, interact with, and even perform transactions on websites. If a site isn't "agent-ready," these bots may consume excessive bandwidth, fail to find critical information, or be unable to navigate your services efficiently.
This update provides material value by breaking down readiness into six actionable categories:
- Basic Web Presence
- Discoverability
- Content Accessibility
- Bot Access Control
- Protocol Discovery
- Commerce
You can view these scores for any scanned URL directly in the dashboard or via our API.
- Dashboard: Go to Protect & Connect > Application Security > Investigate. After running a scan, select the Agent Readiness tab in the report.
- API: Use the URL Scanner API ↗ to programmatically retrieve these scores for your infrastructure.
To learn more about the methodology behind these scores, refer to the blogpost ↗.
You can now export your Requests for Information (RFI) history to a CSV document and customize your dashboard view by choosing how many RFI records to load per page.
These quality-of-life updates focus on data portability and dashboard performance, allowing power users to manage high volumes of requests more efficiently:
- The new CSV export allows you to move RFI data into external tools for custom reporting, internal auditing, or cross-referencing with other security projects without manual data entry
- With adjustable page density, you can now choose to load more records at once (10, 25 or 50) to scan through history faster
Cloudforce One subscribers can find these new options in Cloudflare Dashboard > Application Security > Threat Intelligence > Requests for Information ↗.
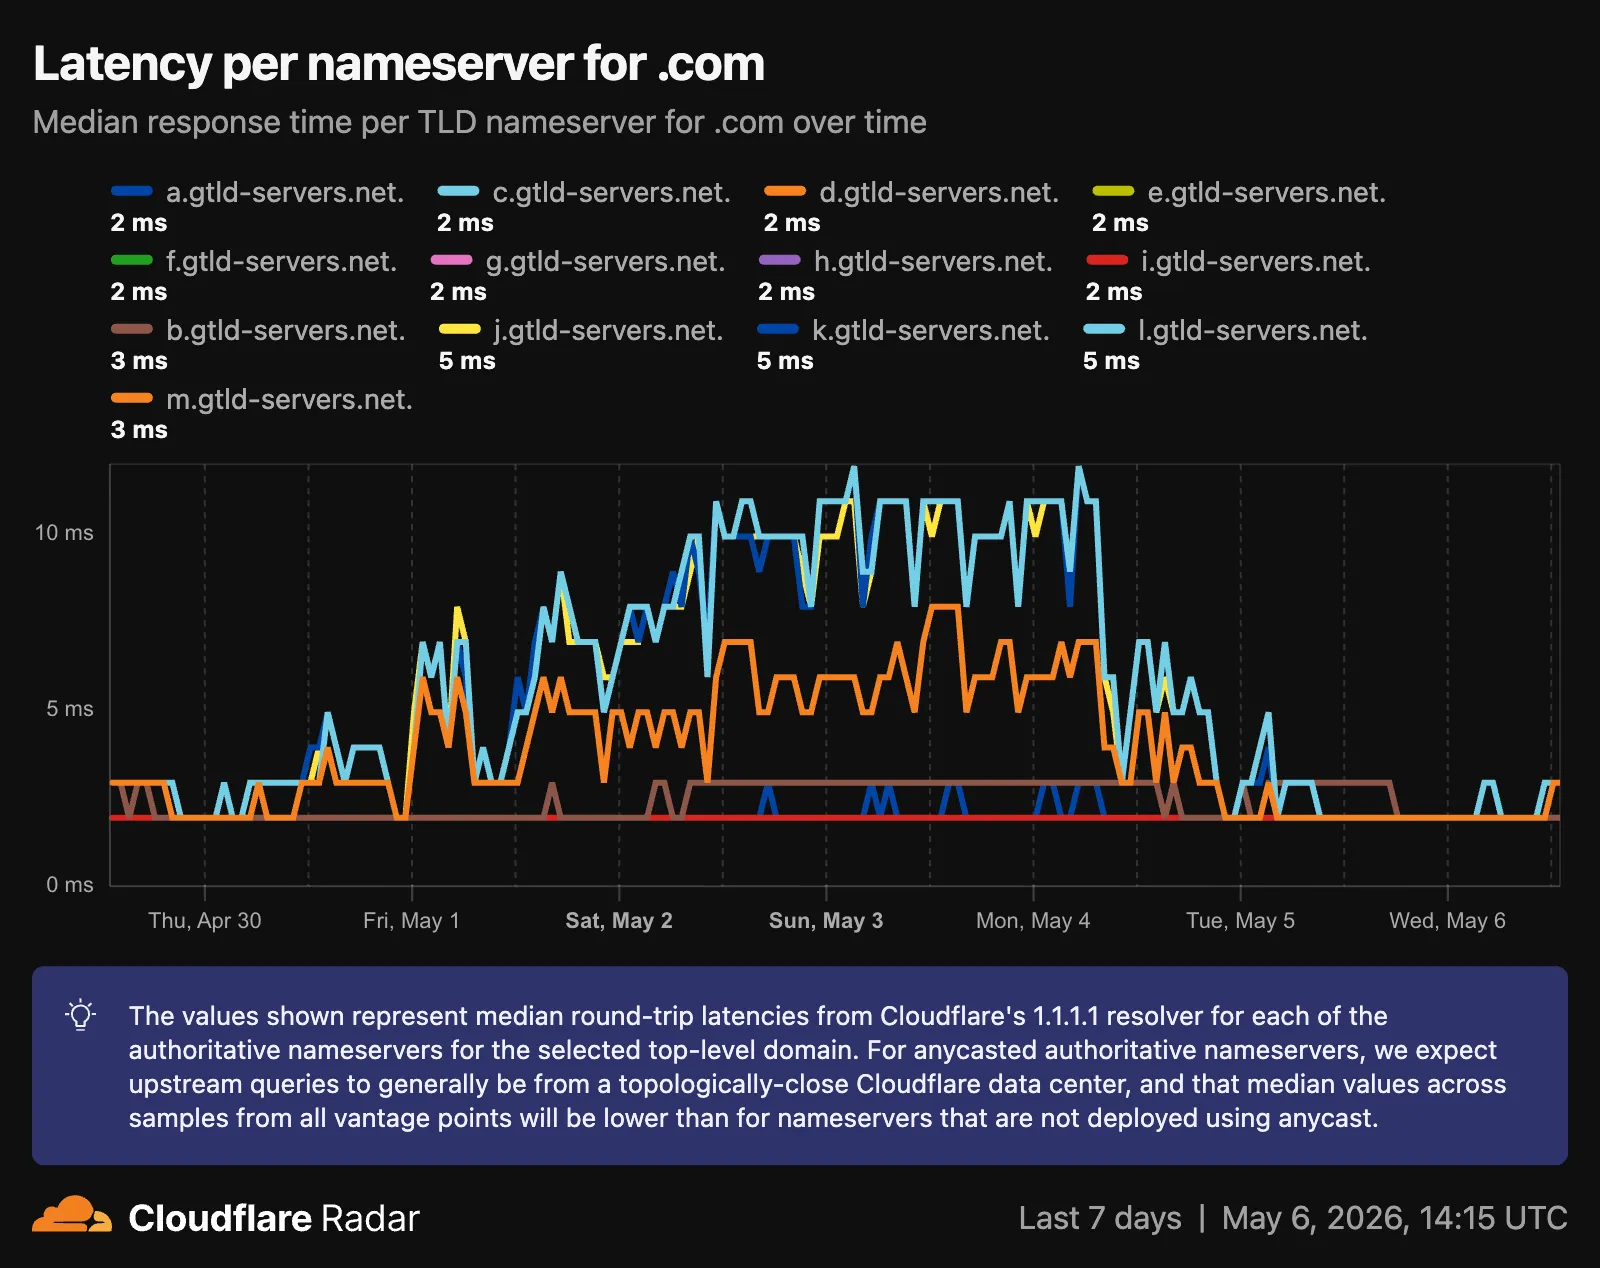
Radar now provides TLD authoritative nameserver performance insights, measuring response time (latency) as observed from Cloudflare's 1.1.1.1 resolver infrastructure when forwarding queries upstream to TLD nameservers.
New widgets on TLD detail pages ↗:
- Aggregate nameserver latency ↗: Response time percentiles (p25/p50/p75) for all authoritative nameservers of the selected TLD.
- Latency per nameserver ↗: Median response time (p50) broken down by each authoritative nameserver over time.
- Median latency geographic distribution ↗: p50 response time by Cloudflare data center country, displayed on a choropleth map.
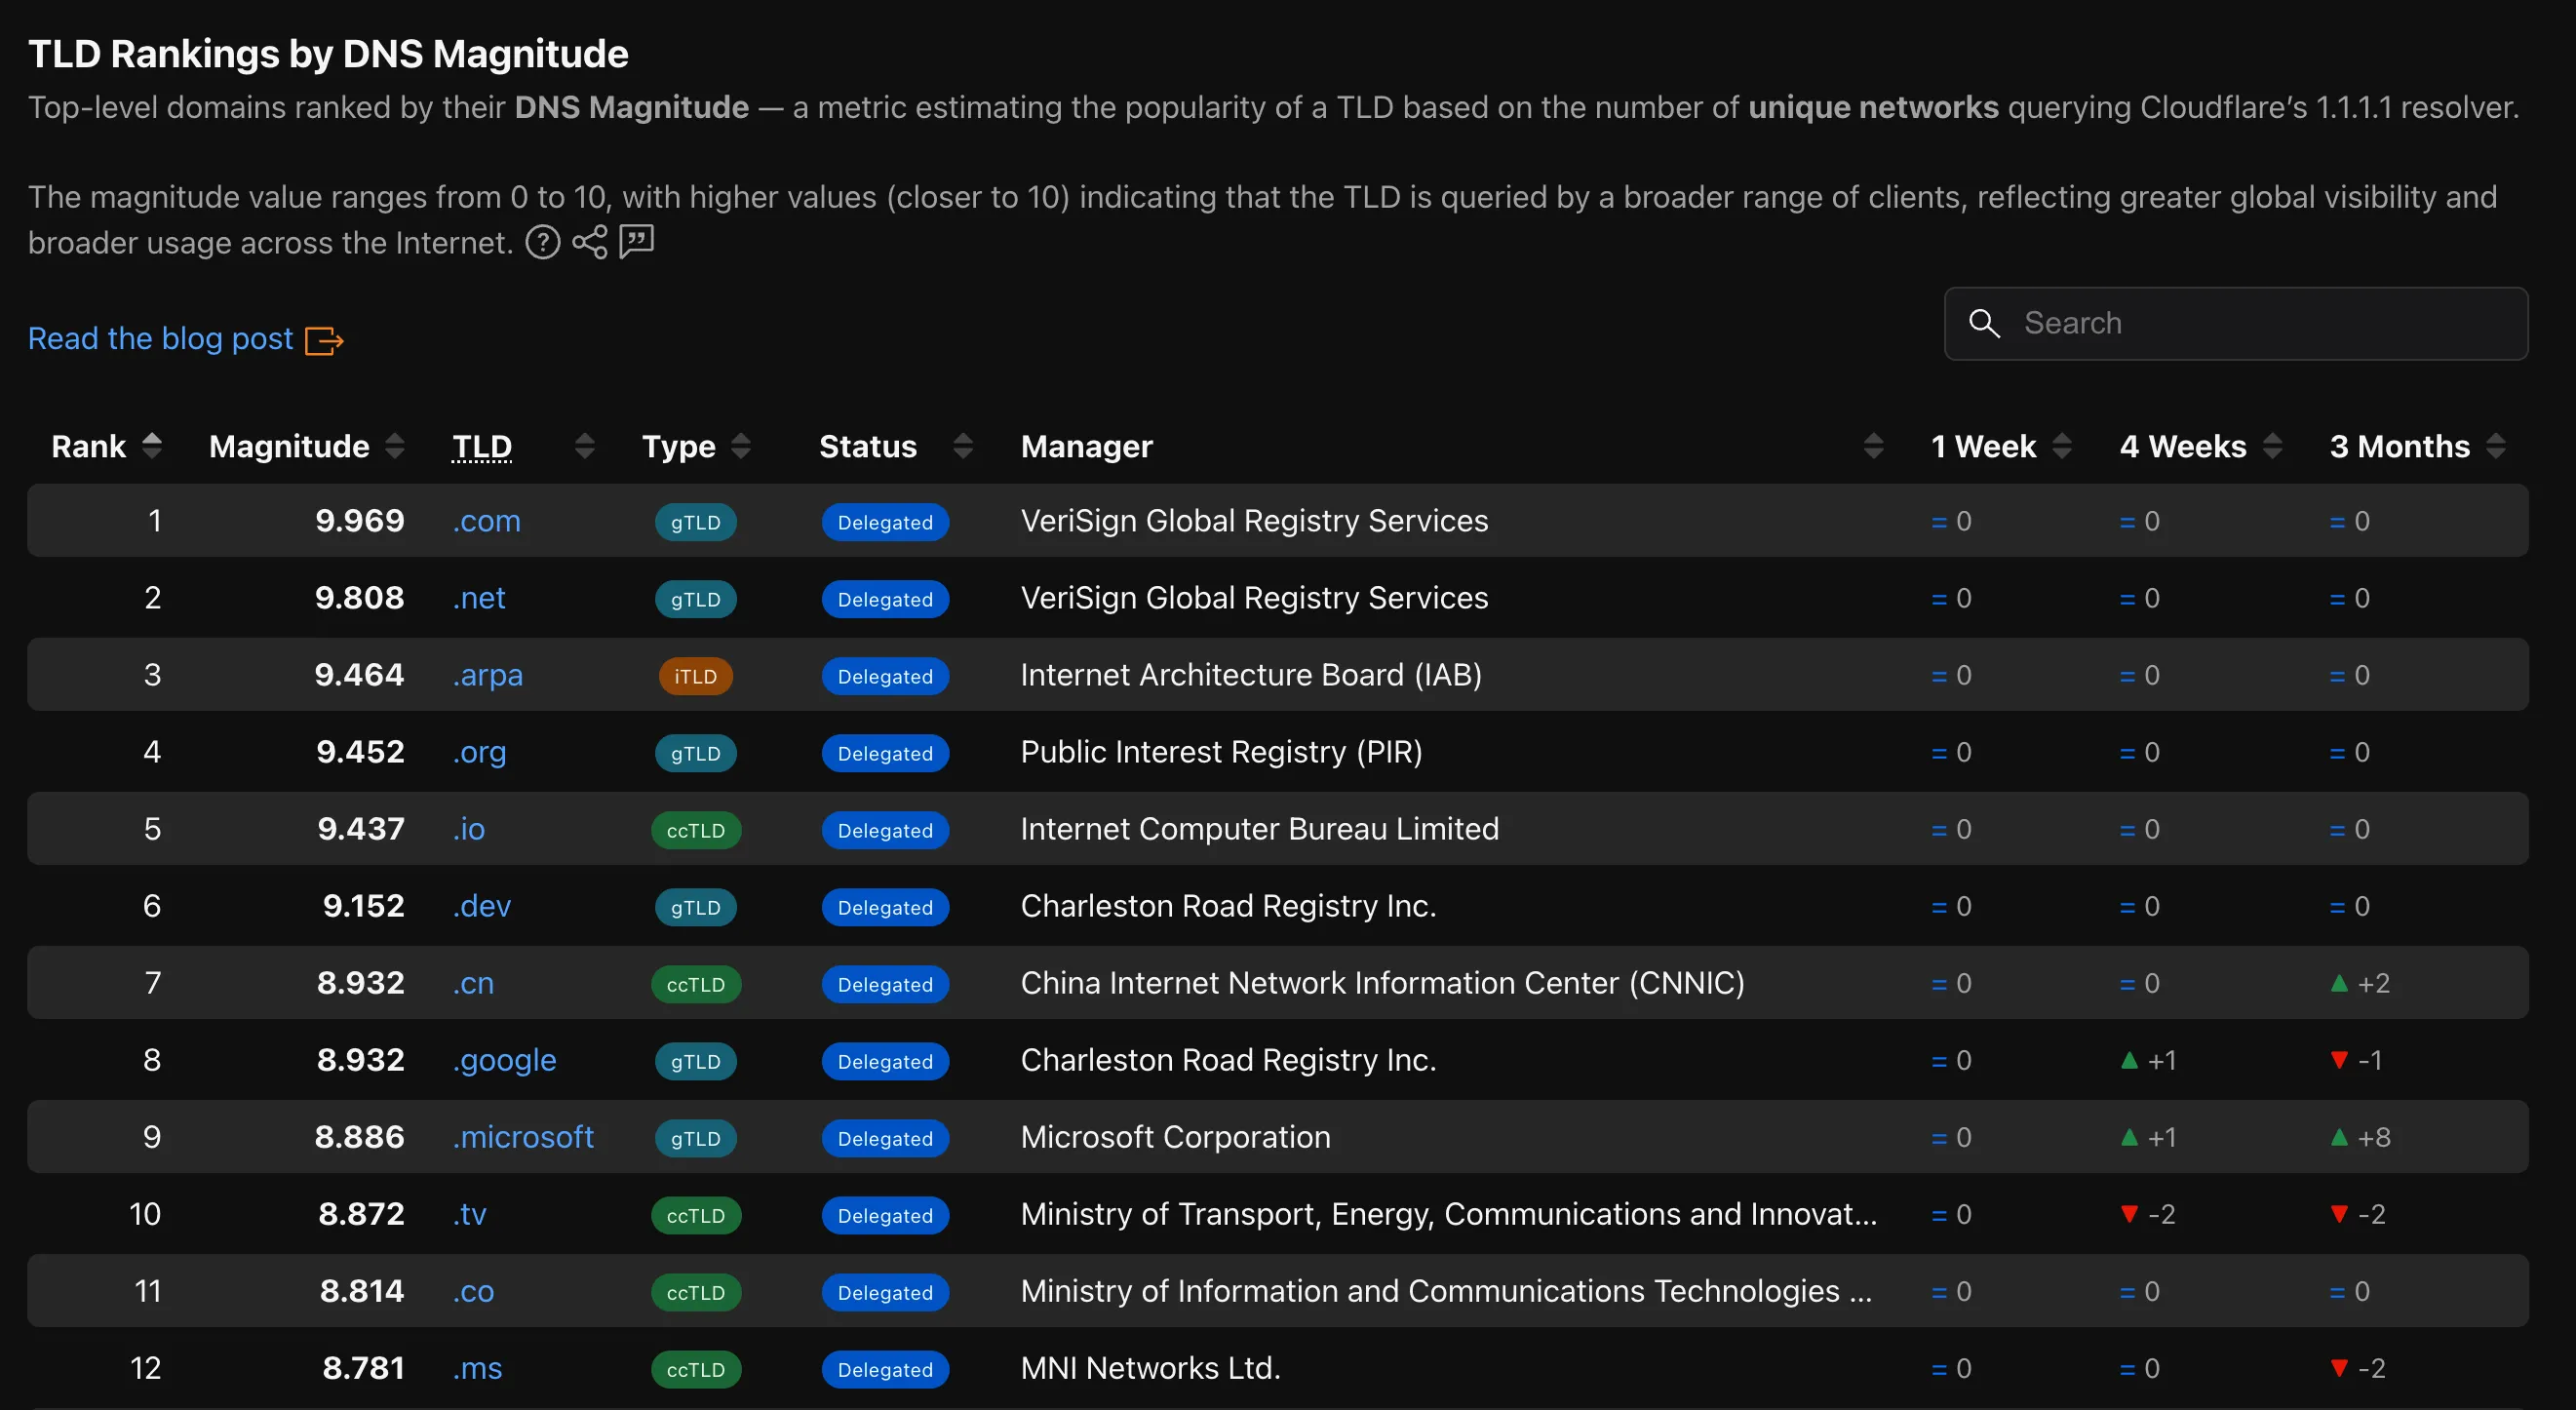
- TLD ranking over time ↗: Daily DNS magnitude rank and magnitude value with a Rank/Magnitude toggle.
- Rank change deltas ↗: 1 week, 4 weeks, and 3 months rank changes added to the TLD magnitude table and the TLD detail info panel.
The new
TLD PerformanceAPI provides the following endpoints:/tlds/performance/summary/{dimension}— TLD nameserver performance summarized by dimension./tlds/performance/timeseries_groups/{dimension}— TLD nameserver performance over time grouped by dimension.
Available dimensions:
LATENCY(aggregate p25/p50/p75),NAMESERVER_LATENCY(per-nameserver p50),LOCATION_LATENCY(per-data-center-country p50).TLD Performance is also available as a dataset in the Data Explorer ↗.
Check out the updated TLD detail page ↗.
The Cloudforce One Threat Events API now supports TAXII ↗ as an output format, enabling standardized, automated sharing of cyber threat intelligence with your existing security stack.
- You can now ingest Cloudforce One threat data directly into your SIEM, TIP or SOAR tools that prefer TAXII-formatted streams without needing custom translation scripts.
- By supporting the TAXII format parameter in our API, security teams can automate the synchronization of indicator data, reducing the manual overhead of updating blocklists and detection rules.
- This alignment with industry standards ensures that your threat data remains consistent across different security ecosystems and partner integrations.
When calling the Threat Events API, you can now specify
taxiiin theformatquery parameter:GET /accounts/{account_id}/cloudforce_one/threat_events?format=taxiiYou can find the updated documentation in the Cloudflare API Reference ↗.
Radar is expanding its Routing section ↗ with two new widgets that give a deeper view into how networks announce address space and how RPKI ROA coverage evolves over time.
Country routing pages now include a Top ASes by announced IP space chart, breaking down the IPv4 and IPv6 address space announced from a country across the autonomous systems that originate it. The chart stacks the IPv4 and IPv6 views vertically, with the top contributing ASes called out by color and the remaining networks aggregated as Other.

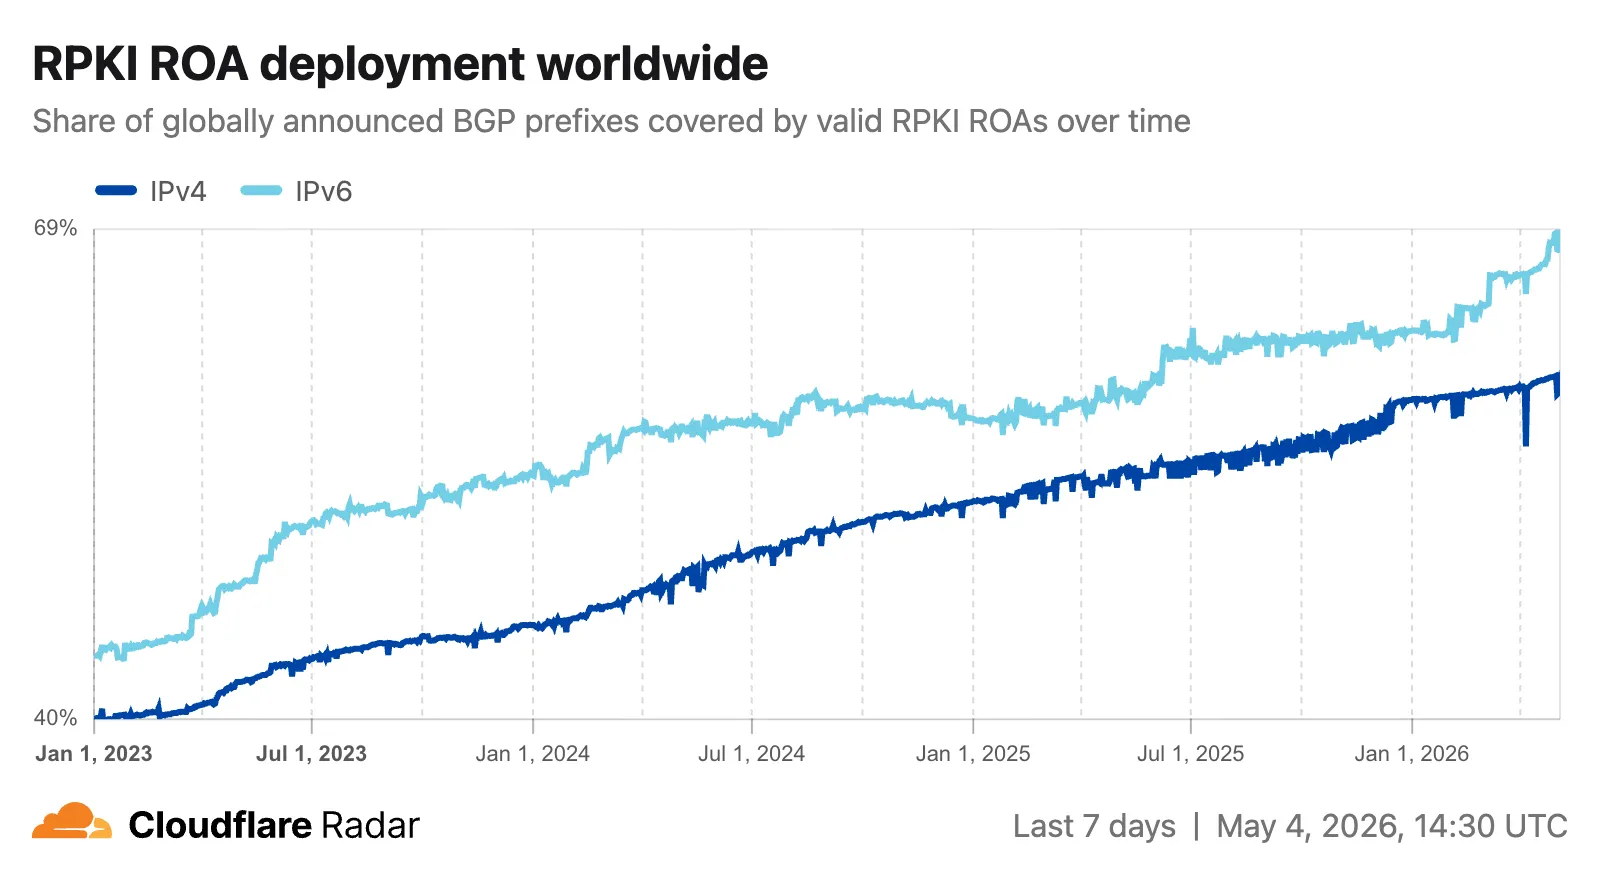
The RPKI sub-page ↗ adds an RPKI ROA deployment timeseries widget that tracks the share of announced BGP space covered by a valid Route Origin Authorization (ROA) over time, with separate IPv4 and IPv6 lines. A toggle switches the view between the share of covered prefixes and the share of covered IP address space. The widget is available on global, country, and AS views, so operators can monitor RPKI adoption progress and compare deployment trends across different scopes.
The data behind these widgets is also available through two new endpoints on the
BGPAPI:/bgp/ips/top/ases- Returns the top autonomous systems by announced IP space (IPv4/24s or IPv6/48s), globally or filtered by country, snapped to the nearest 8-hour RIB boundary./bgp/rpki/roas/timeseries- Returns RPKI ROA validation coverage over time, by share of prefixes or share of IP address space, split by IP version, with optional ASN or location filters.
Visit the Radar routing section ↗ to explore both widgets.
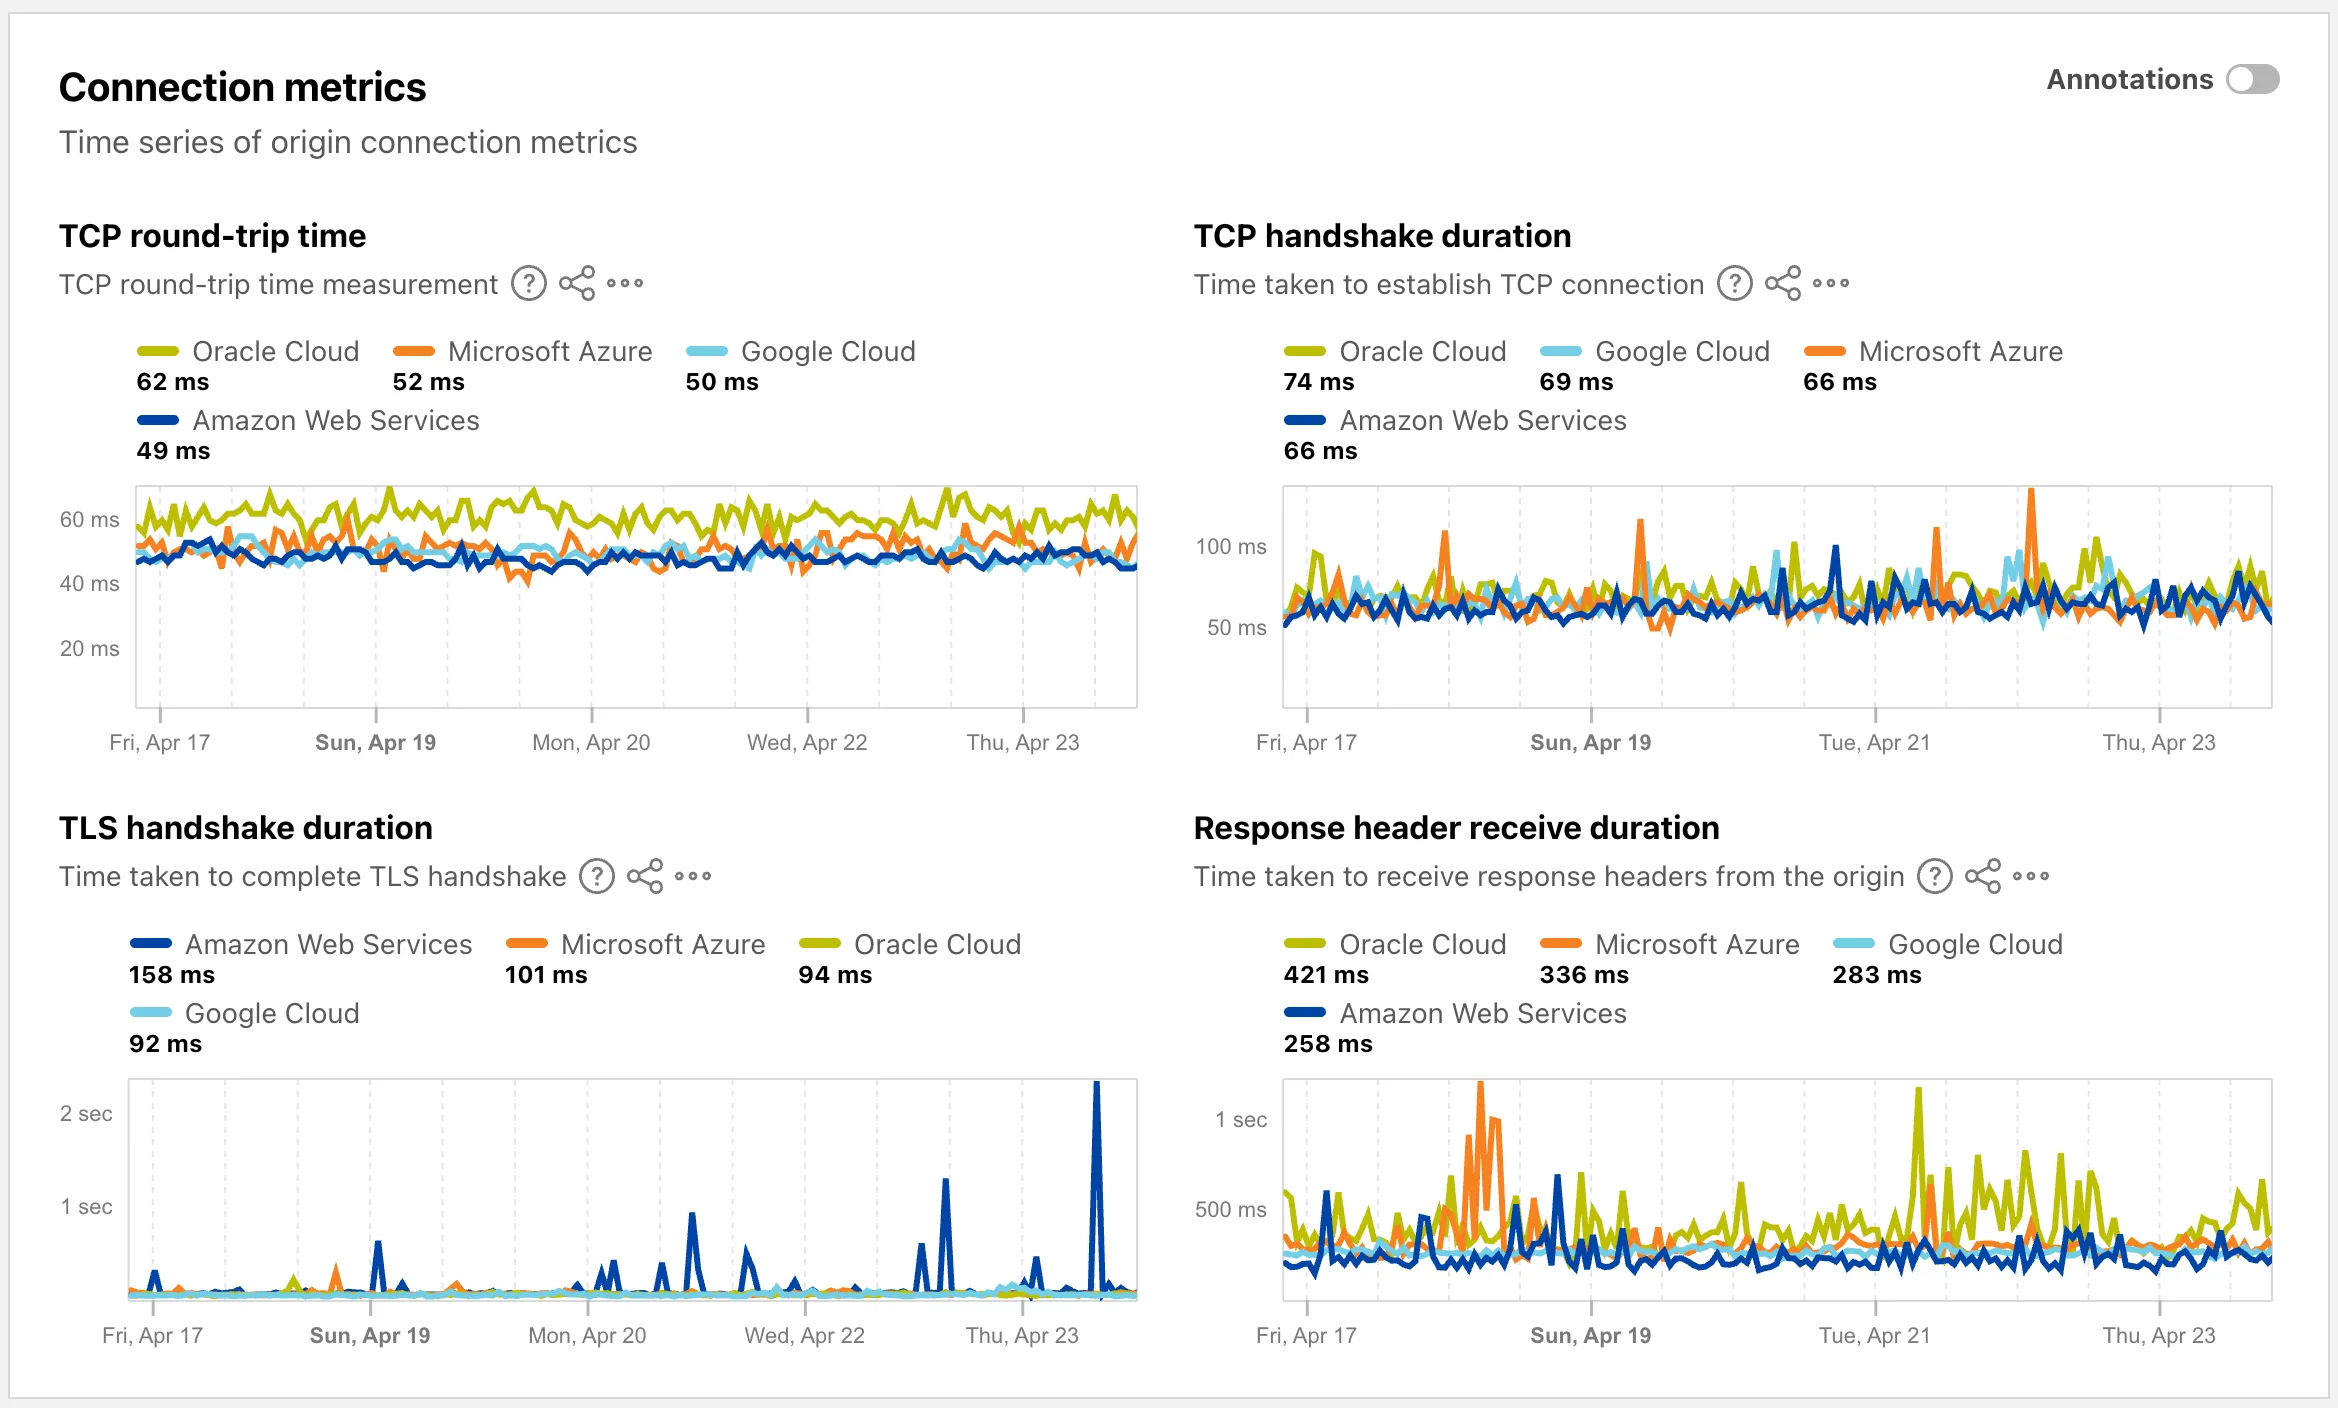
The Cloud Observatory ↗ on Radar now provides improved connection metric insights, offering new ways to explore TCP round-trip time, TCP handshake duration, TLS handshake duration, and response header receive duration across cloud provider origin servers.
The Cloud Observatory overview ↗ now shows connection metrics broken down by cloud provider, making it easy to compare connection performance across Amazon Web Services, Google Cloud, Microsoft Azure, and Oracle Cloud.
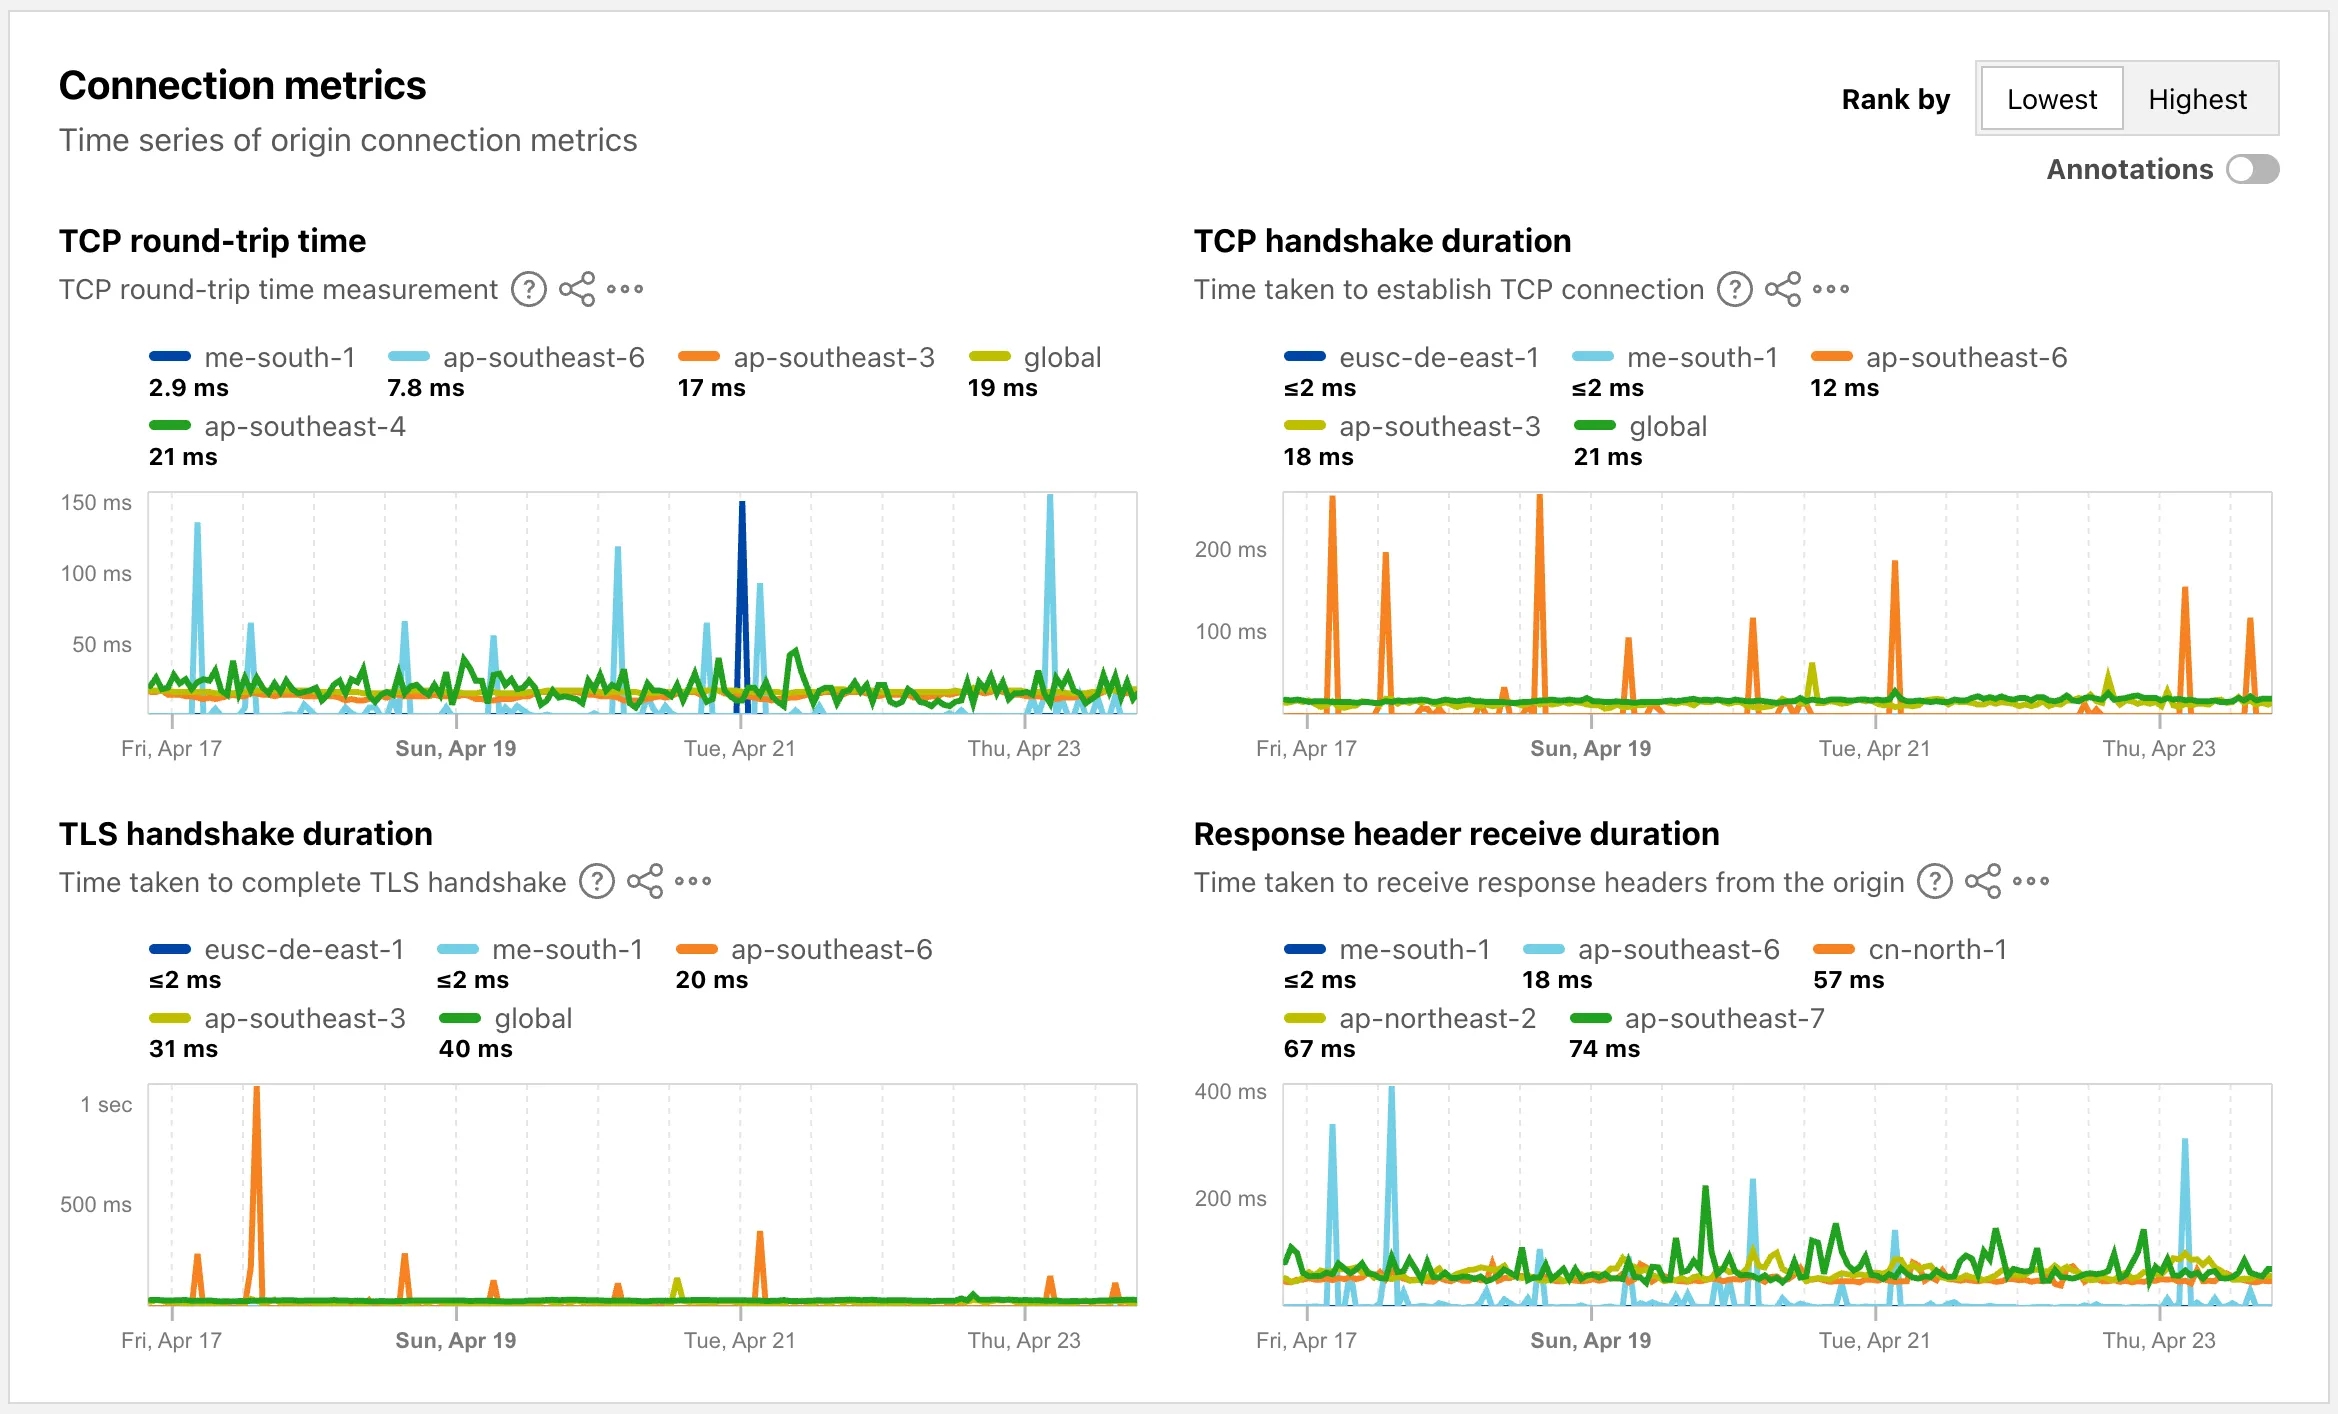
Each provider page ↗ now shows connection metrics for the top five regions, with a selector to rank by lowest or highest values.
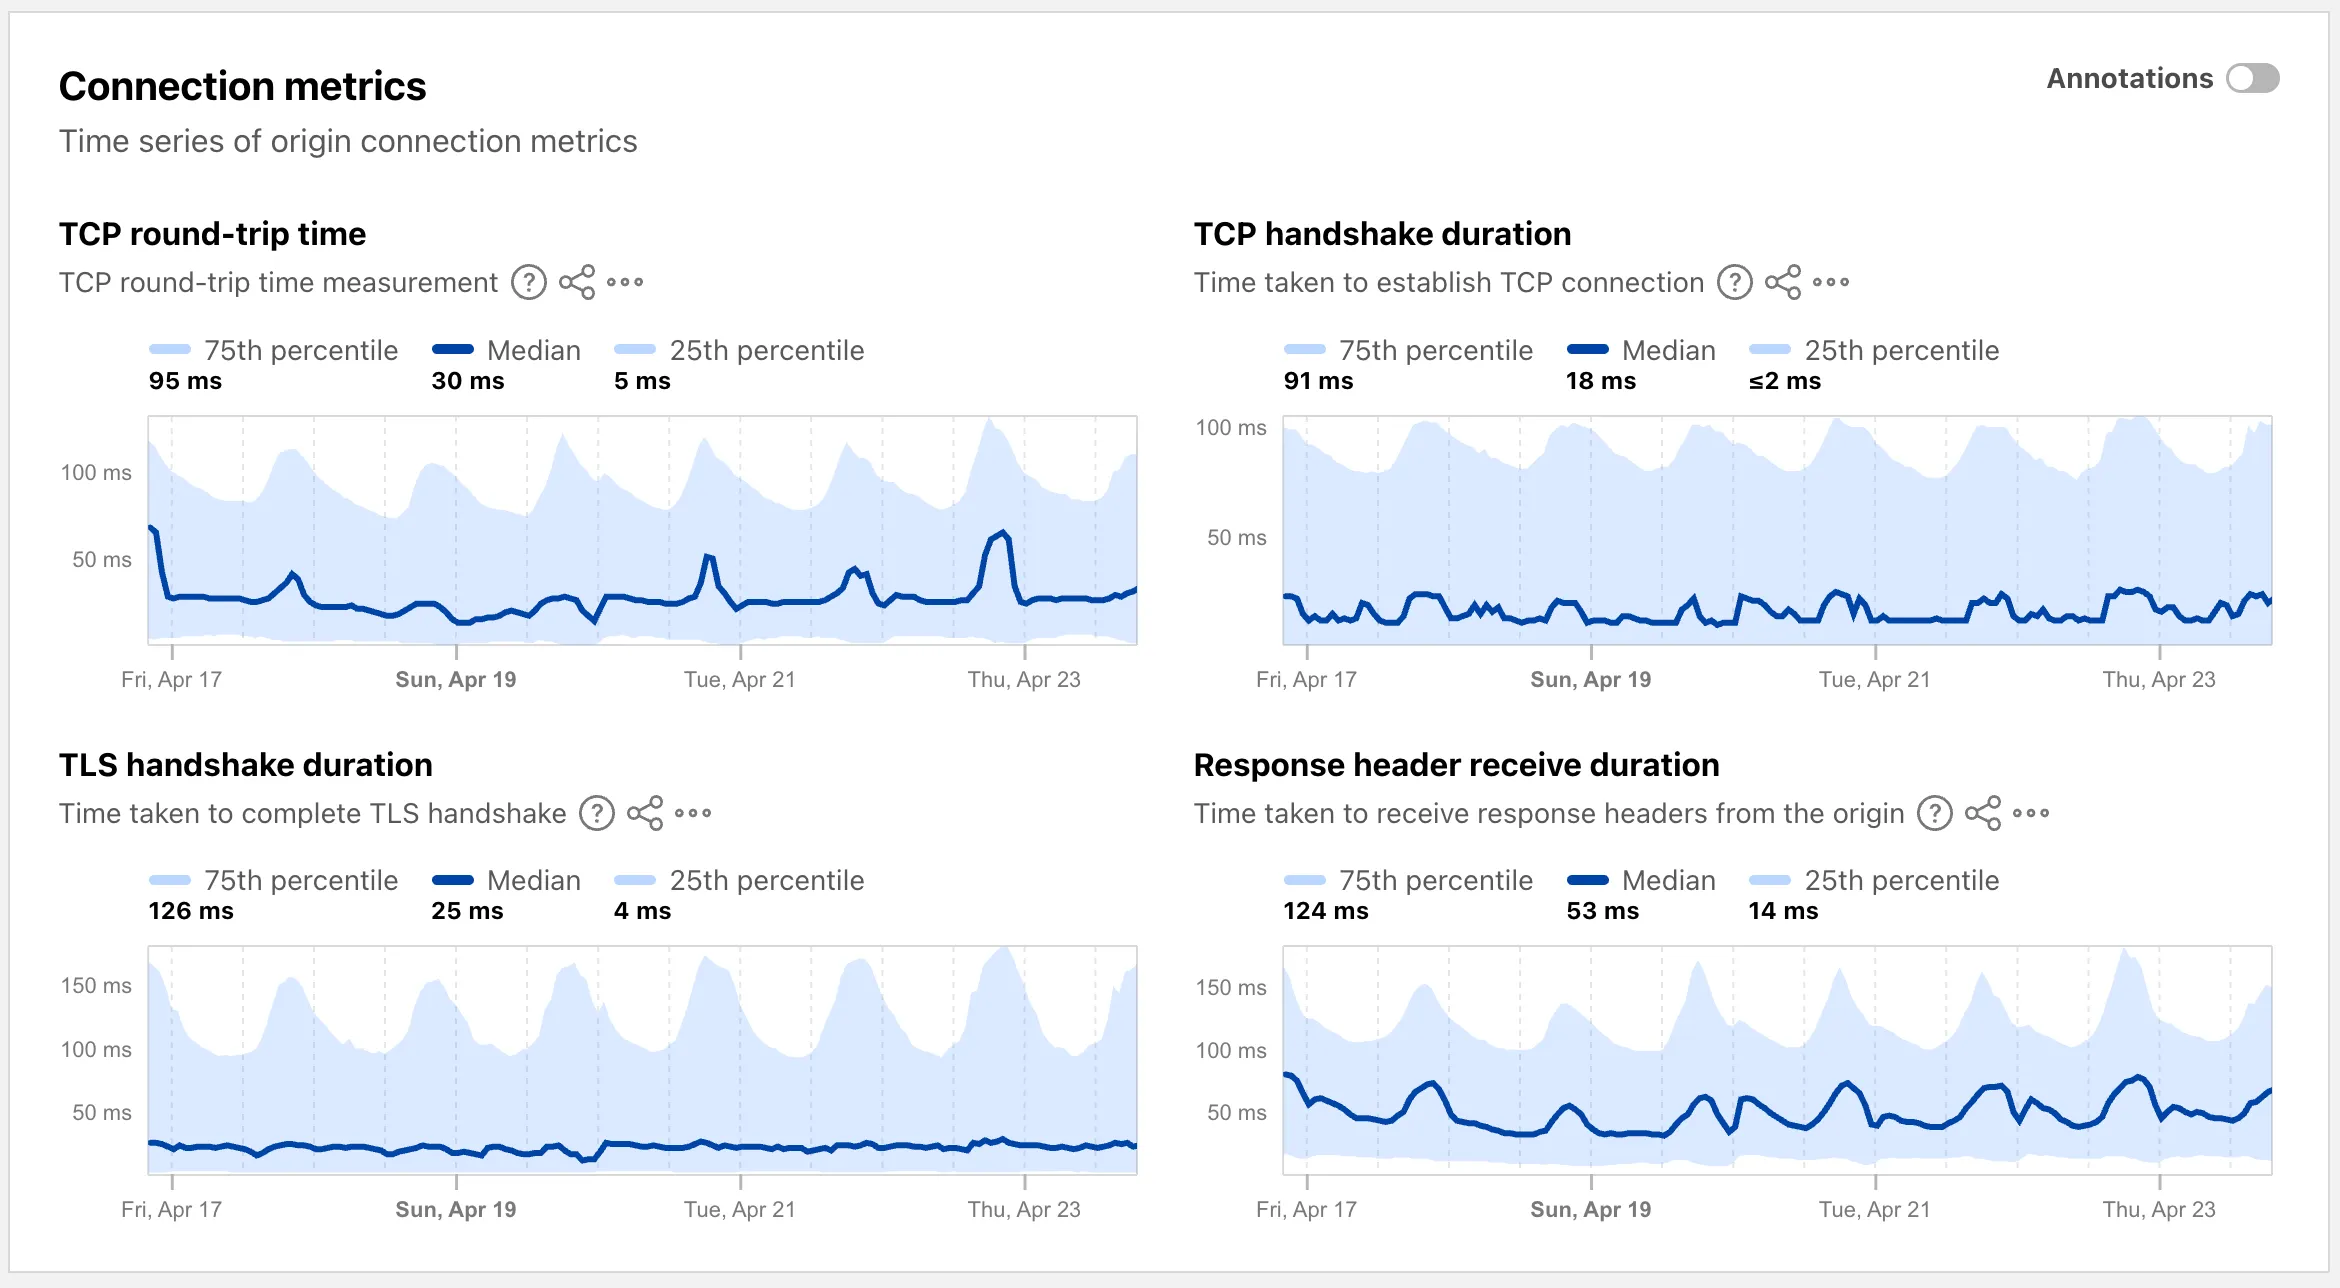
Each region page ↗ now displays connection metrics as percentile distributions (25th percentile, median, and 75th percentile), providing insight into the range and variability of connection times.
These views are also available through the
OriginsAPI, using thetimeseries_groupsendpoint with theORIGIN,REGION, orPERCENTILEdimension.