We’re excited to introduce Logpush Health Dashboards, giving customers real-time visibility into the status, reliability, and performance of their Logpush jobs. Health dashboards make it easier to detect delivery issues, monitor job stability, and track performance across destinations. The dashboards are divided into two sections:
-
Upload Health: See how much data was successfully uploaded, where drops occurred, and how your jobs are performing overall. This includes data completeness, success rate, and upload volume.
-
Upload Reliability – Diagnose issues impacting stability, retries, or latency, and monitor key metrics such as retry counts, upload duration, and destination availability.
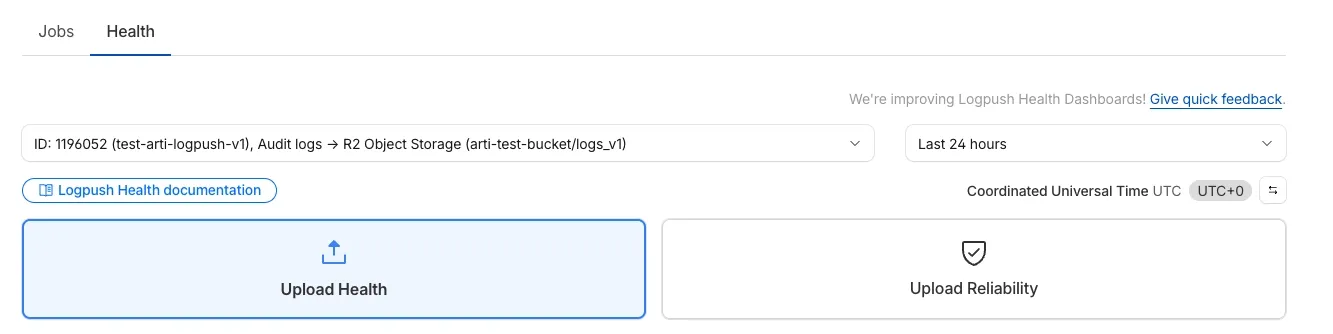
Health Dashboards can be accessed from the Logpush page in the Cloudflare dashboard at the account or zone level, under the Health tab. For more details, refer to our Logpush Health Dashboards documentation, which includes a comprehensive troubleshooting guide to help interpret and resolve common issues.
-
Permissions for managing Logpush jobs related to Zero Trust datasets (Access, Gateway, and DEX) have been updated to improve data security and enforce appropriate access controls.
To view, create, update, or delete Logpush jobs for Zero Trust datasets, users must now have both of the following permissions:
- Logs Edit
- Zero Trust: PII Read
We're excited to announce that Log Explorer users can now cancel queries that are currently running.
This new feature addresses a common pain point: waiting for a long, unintended, or misconfigured query to complete before you can submit a new, correct one. With query cancellation, you can immediately stop the execution of any undesirable query, allowing you to quickly craft and submit a new query, significantly improving your investigative workflow and productivity within Log Explorer.
We're excited to announce a new feature in Log Explorer that significantly enhances how you analyze query results: the Query results distribution chart.
This new chart provides a graphical distribution of your results over the time window of the query. Immediately after running a query, you will see the distribution chart above your result table. This visualization allows Log Explorer users to quickly spot trends, identify anomalies, and understand the temporal concentration of log events that match their criteria. For example, you can visually confirm if a spike in traffic or errors occurred at a specific time, allowing you to focus your investigation efforts more effectively. This feature makes it faster and easier to extract meaningful insights from your vast log data.
The chart will dynamically update to reflect the logs matching your current query.
The Brand Protection logo query dashboard now allows you to use the Report to Cloudflare button to submit an Abuse report directly from the Brand Protection logo queries dashboard. While you could previously report new domains that were impersonating your brand before, now you can do the same for websites found to be using your logo without your permission. The abuse reports will be prefilled and you will only need to validate a few fields before you can click the submit button, after which our team process your request.
Ready to start? Check out the Brand Protection docs.
Logpush now supports integration with Microsoft Sentinel ↗.The new Azure Sentinel Connector built on Microsoft’s Codeless Connector Framework (CCF), is now available. This solution replaces the previous Azure Functions-based connector, offering significant improvements in security, data control, and ease of use for customers. Logpush customers can send logs to Azure Blob Storage and configure this new Sentinel Connector to ingest those logs directly into Microsoft Sentinel.
This upgrade significantly streamlines log ingestion, improves security, and provides greater control:
- Simplified Implementation: Easier for engineering teams to set up and maintain.
- Cost Control: New support for Data Collection Rules (DCRs) allows you to filter and transform logs at ingestion time, offering potential cost savings.
- Enhanced Security: CCF provides a higher level of security compared to the older Azure Functions connector.
- Data Lake Integration: Includes native integration with Data Lake.
Find the new solution here ↗ and refer to the Cloudflare's developer documentation ↗for more information on the connector, including setup steps, supported logs and Microsoft's resources.
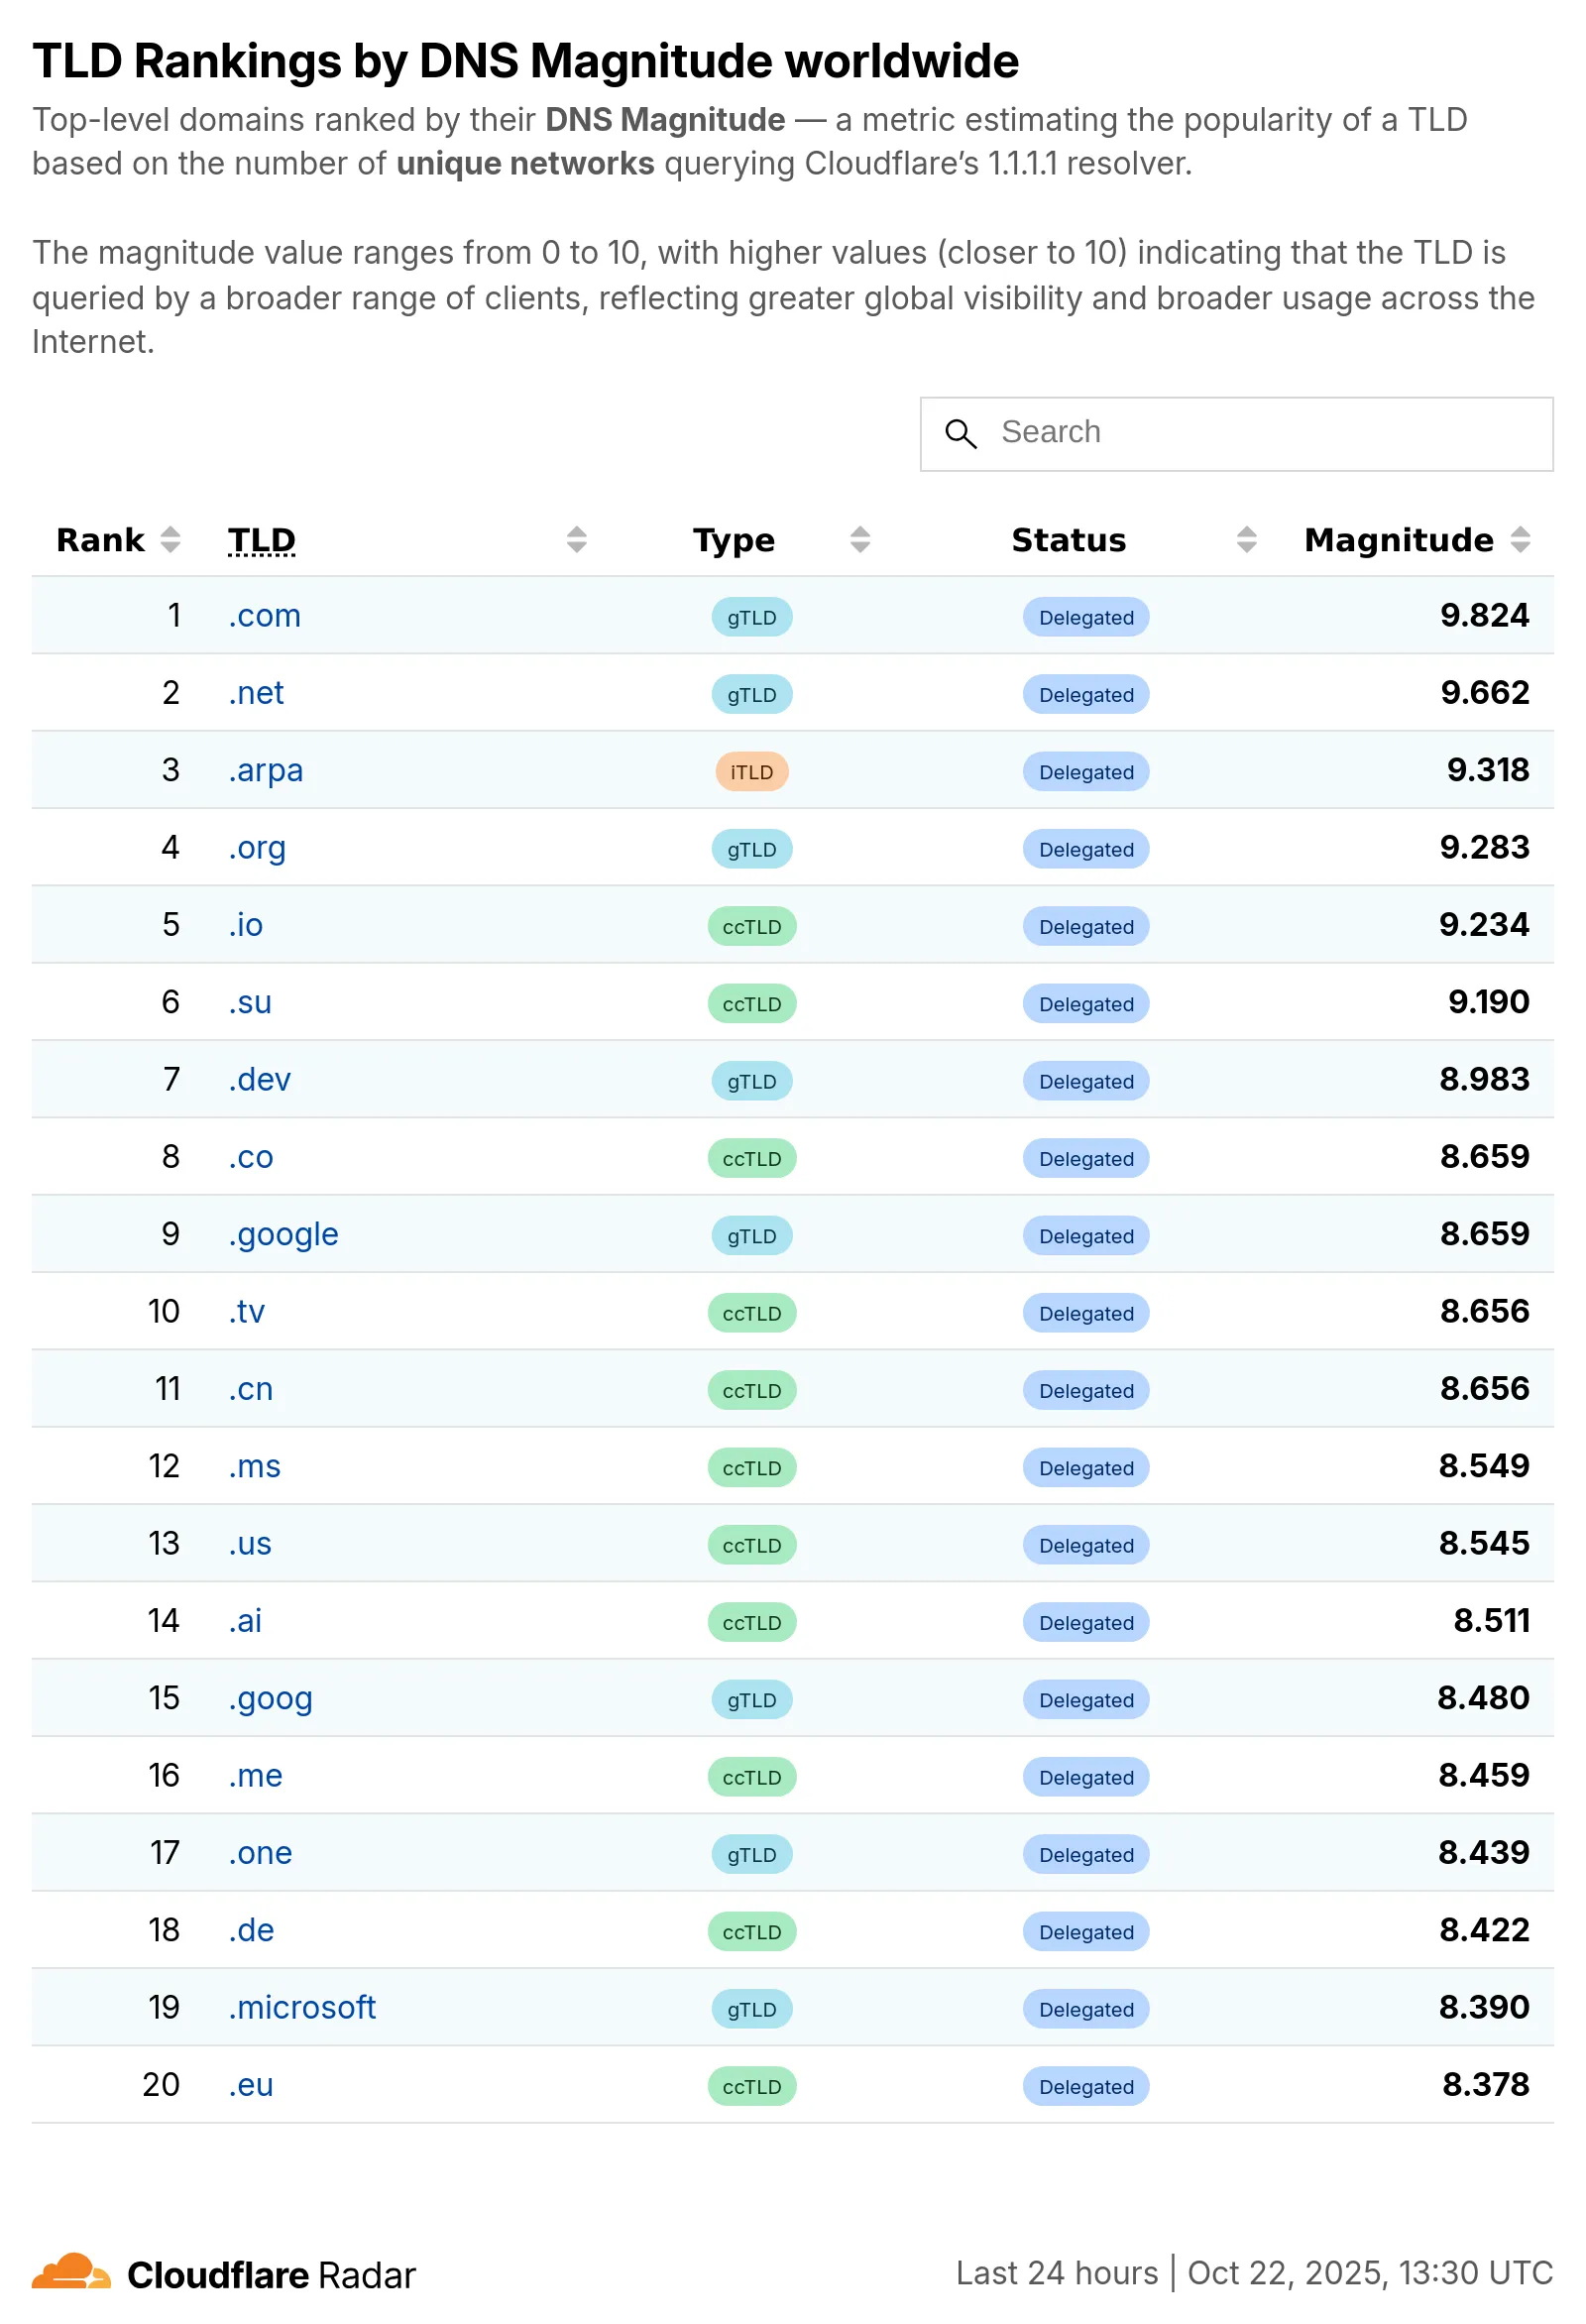
Radar now introduces Top-Level Domain (TLD) insights, providing visibility into popularity based on the DNS magnitude metric, detailed TLD information including its type, manager, DNSSEC support, RDAP support, and WHOIS data, and trends such as DNS query volume and geographic distribution observed by the 1.1.1.1 DNS resolver.
The following dimensions were added to the Radar DNS API, specifically, to the
/dns/summary/{dimension}and/dns/timeseries_groups/{dimension}endpoints:tld: Top-level domain extracted from DNS queries; can also be used as a filter.tld_dns_magnitude: Top-level domain ranking by DNS magnitude.
And the following endpoints were added:
/tlds- Lists all TLDs./tlds/{tld}- Retrieves information about a specific TLD.
Learn more about the new Radar DNS insights in our blog post ↗, and check out the new Radar page ↗.
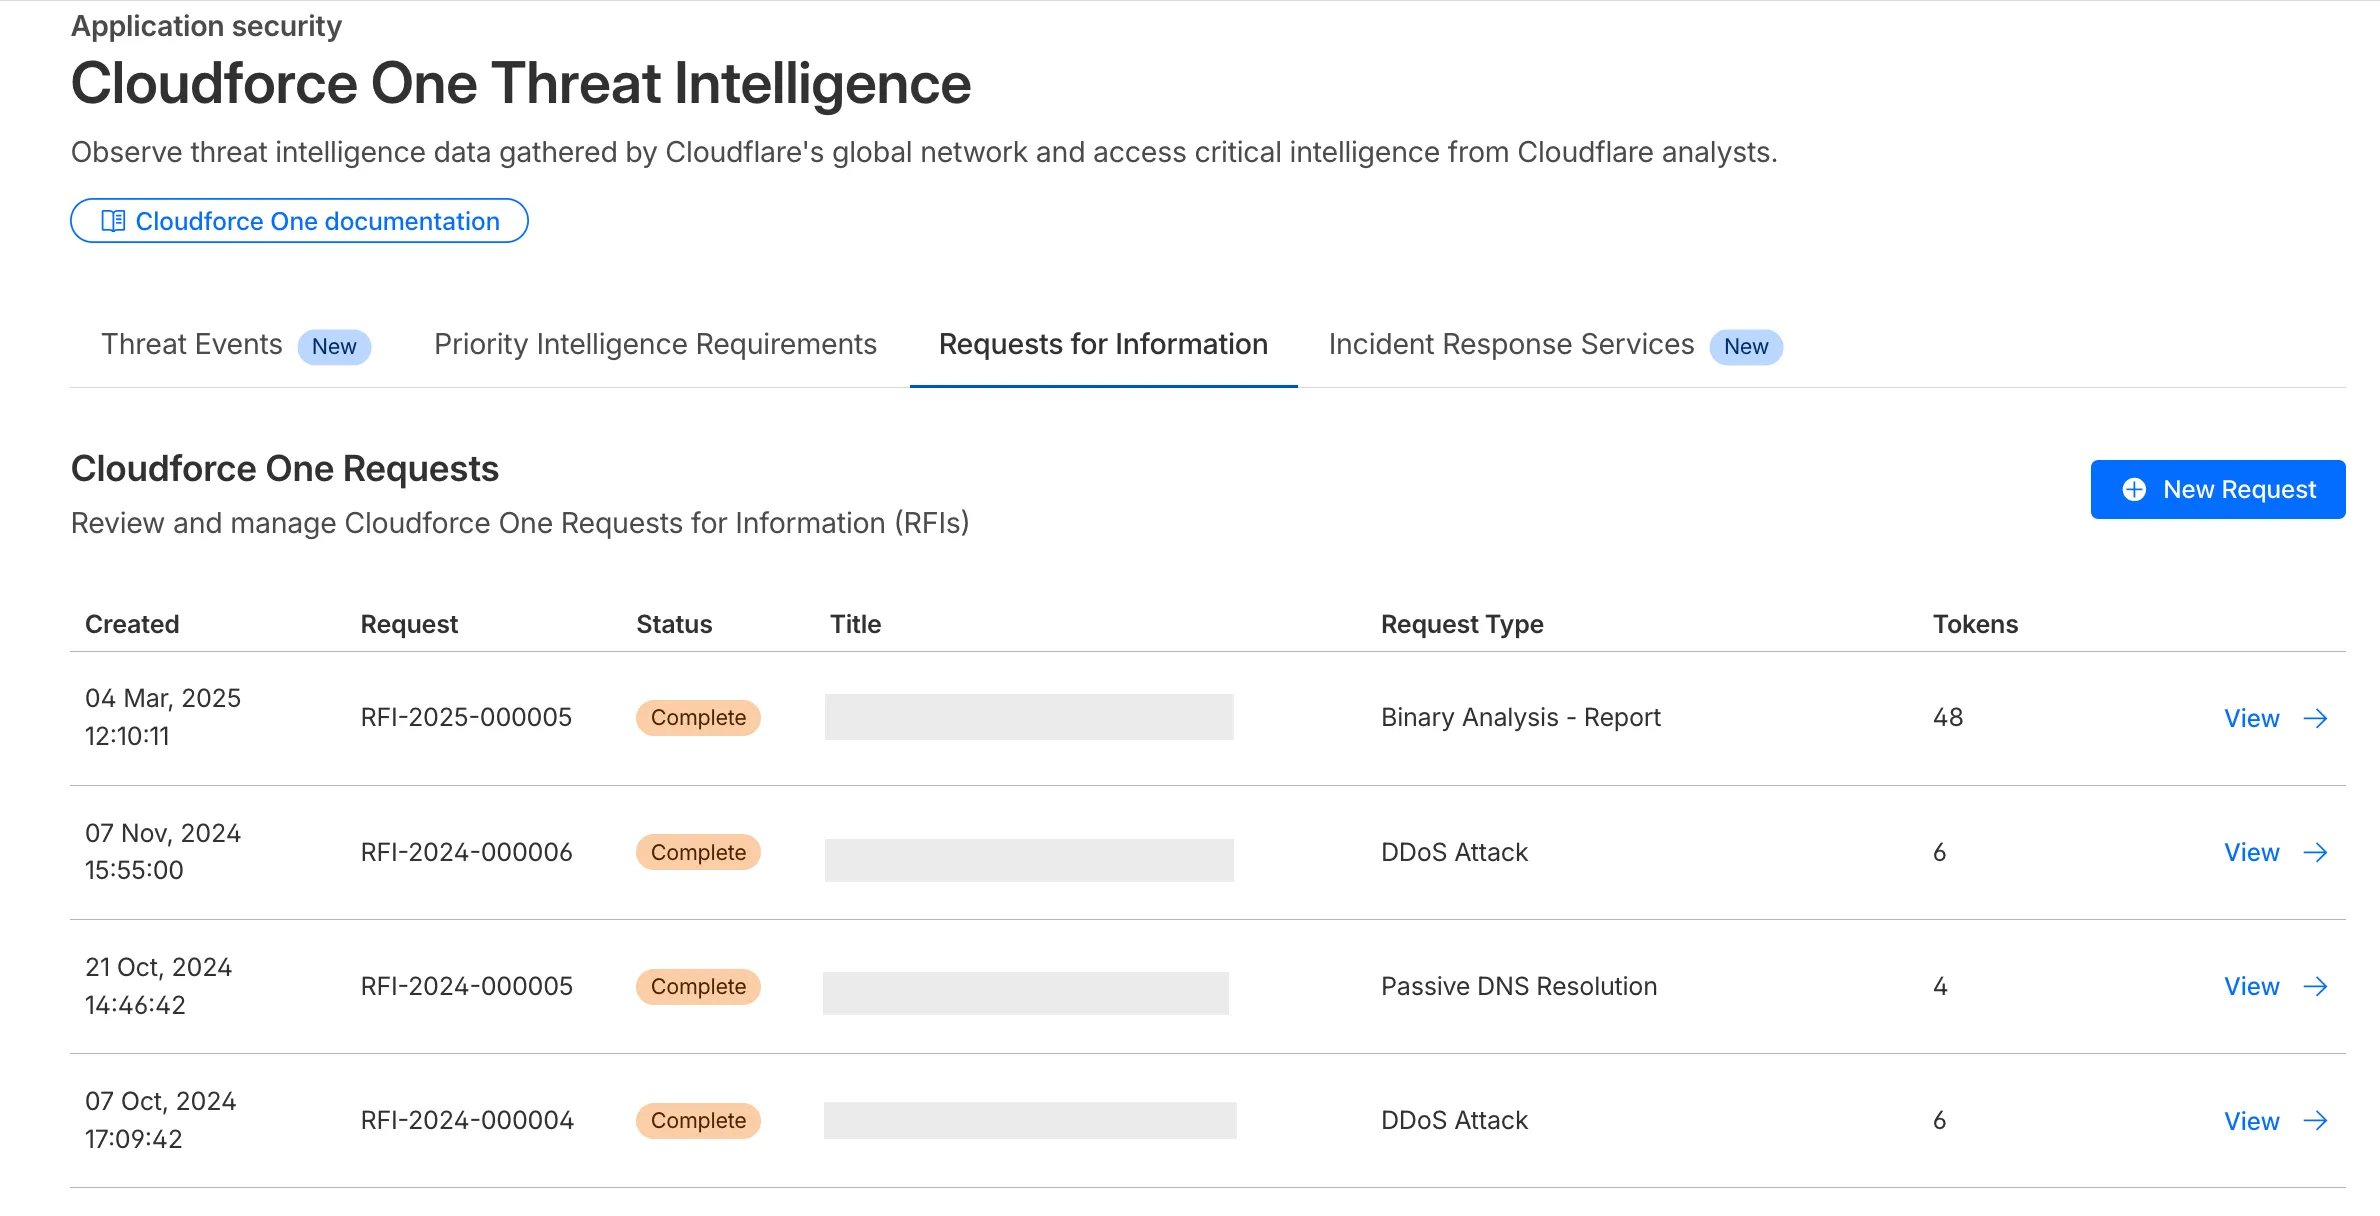
The Requests for Information (RFI) dashboard now shows users the number of tokens used by each submitted RFI to better understand usage of tokens and how they relate to each request submitted.
What’s new:
- Users can now see the number of tokens used for a submitted request for information.
- Users can see the remaining tokens allocated to their account for the quarter.
- Users can only select the Routine priority for the
Strategic Threat Researchrequest type.
Cloudforce One subscribers can try it now in Application Security > Threat Intelligence > Requests for Information ↗.
Cloudflare's new Application Security report, currently in Closed Beta, is now available in the dashboard.
Go to Security reportsThe reports are generated monthly and provide cyber security insights trends for all of the Enterprise zones in your Cloudflare account.
The reports also include an industry benchmark, comparing your cyber security landscape to peers in your industry.
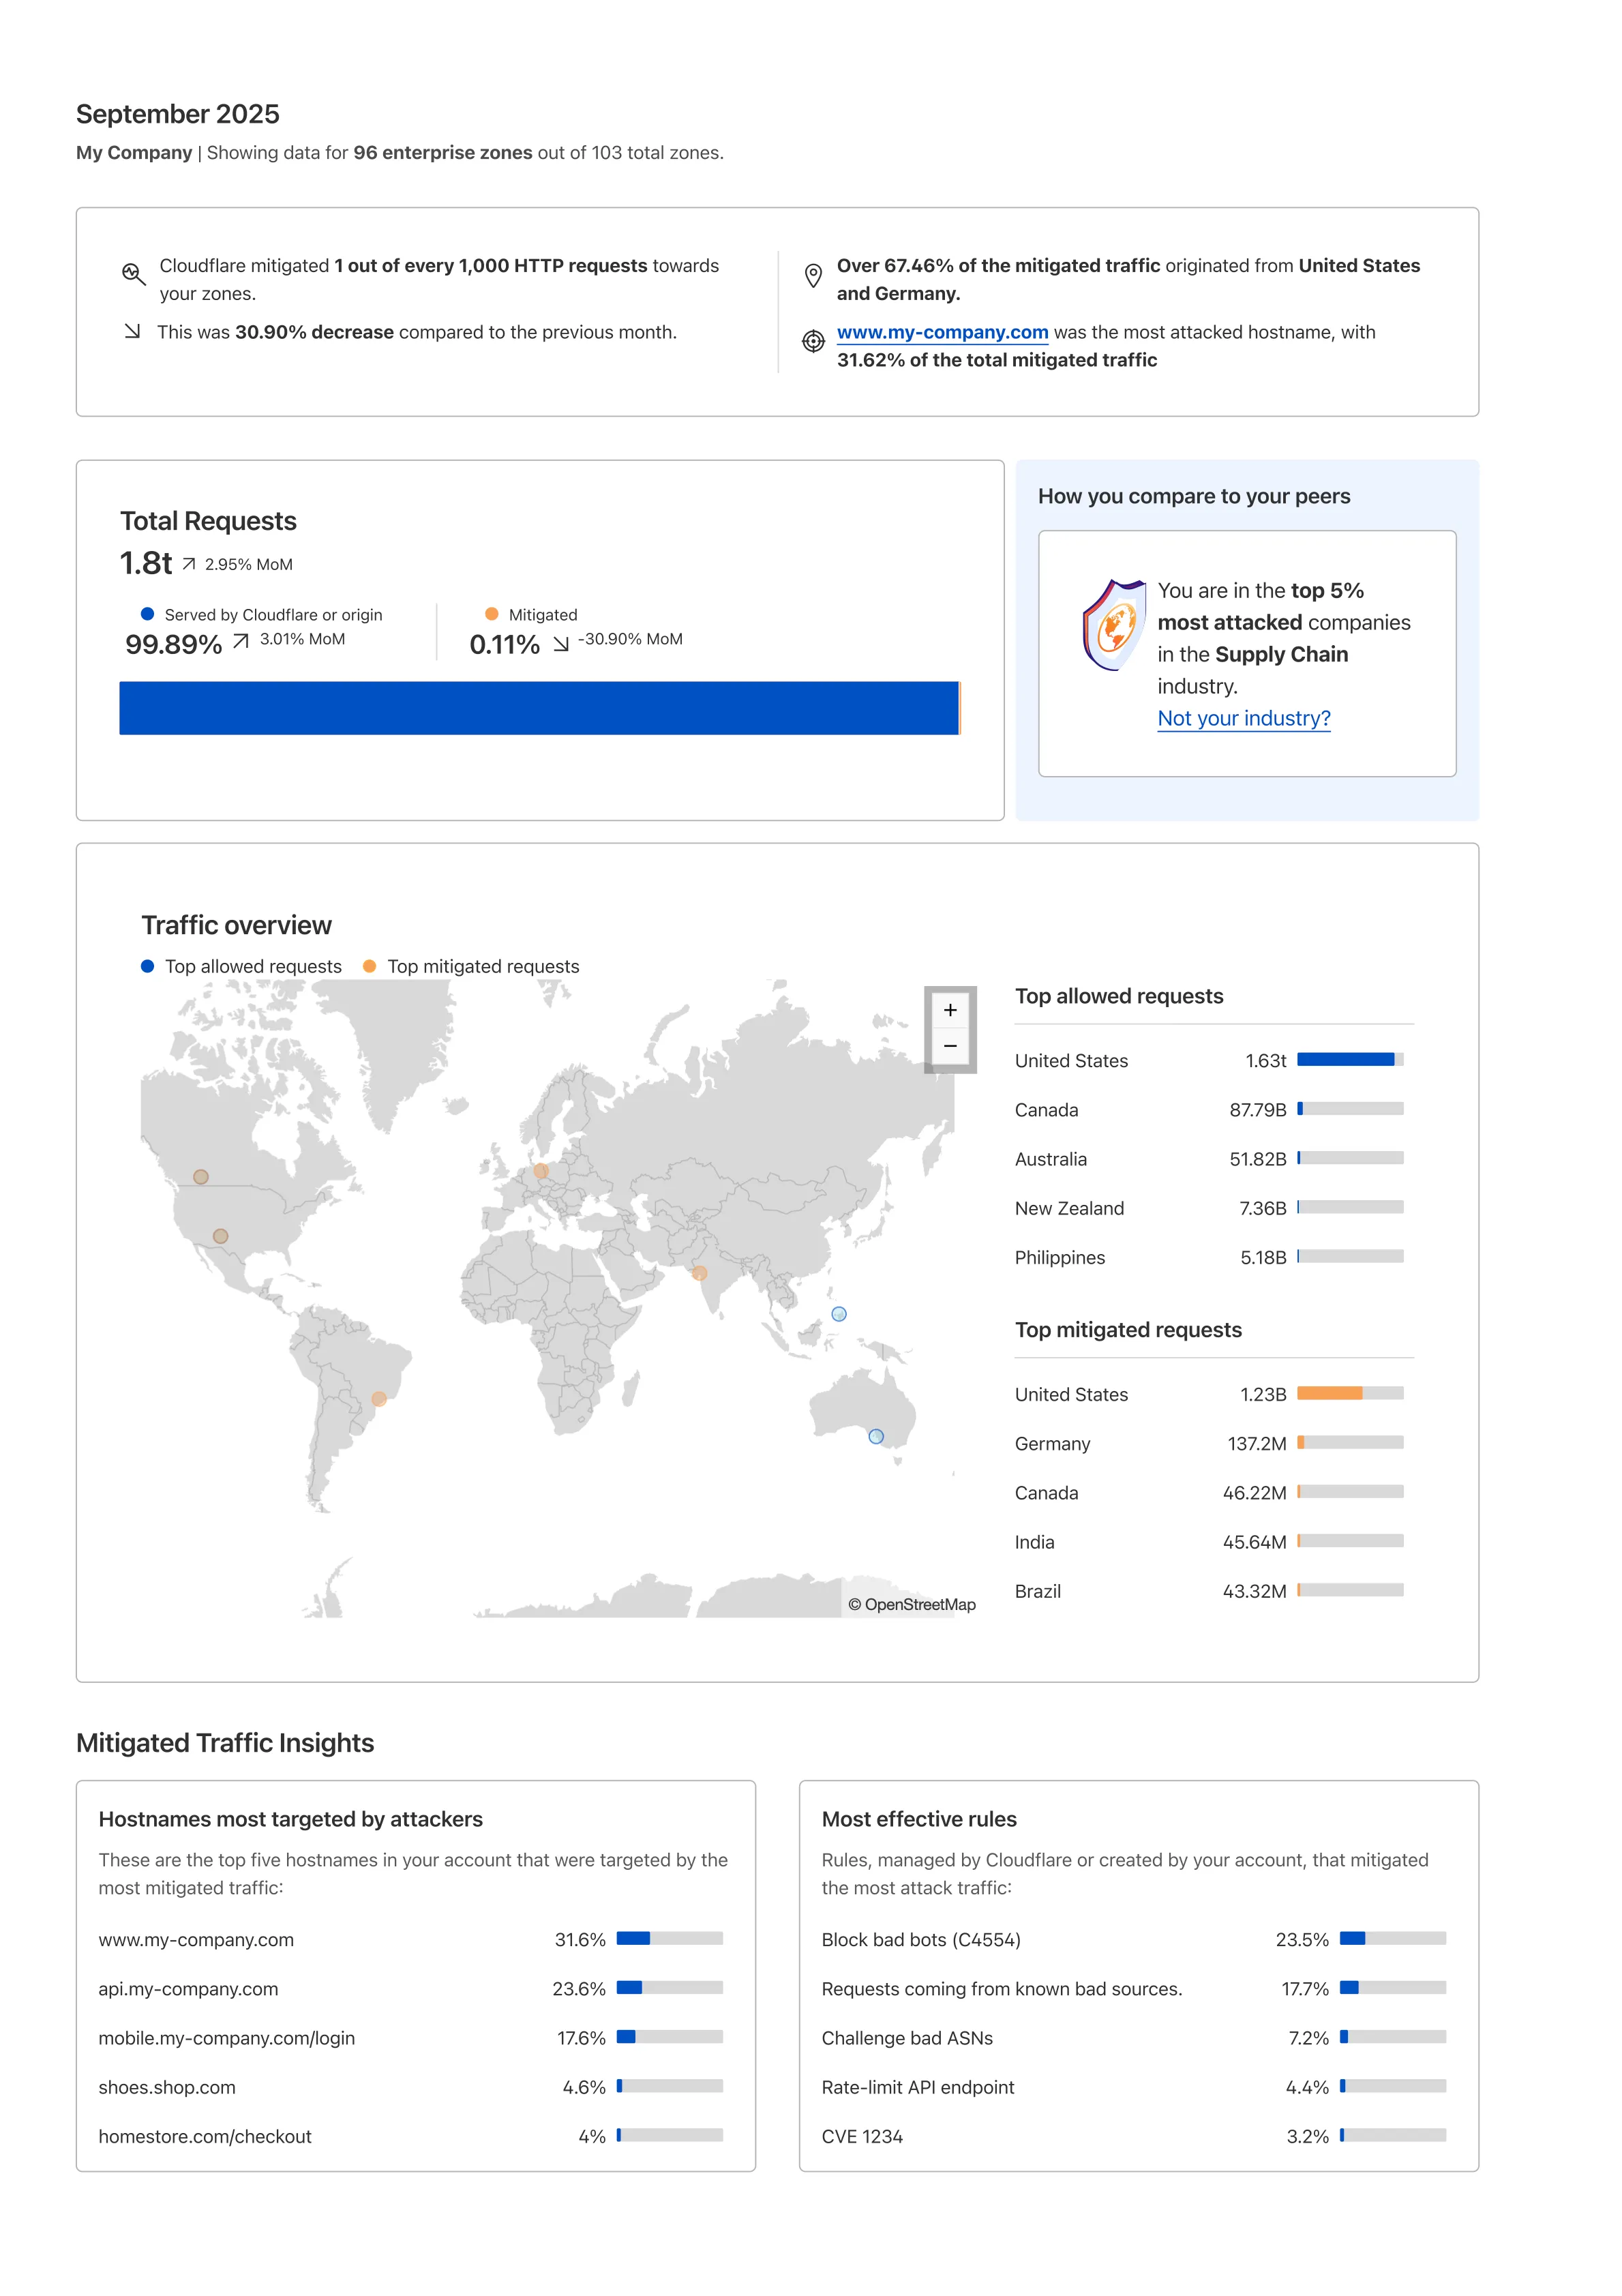
Learn more about the reports by referring to the Security Reports documentation.
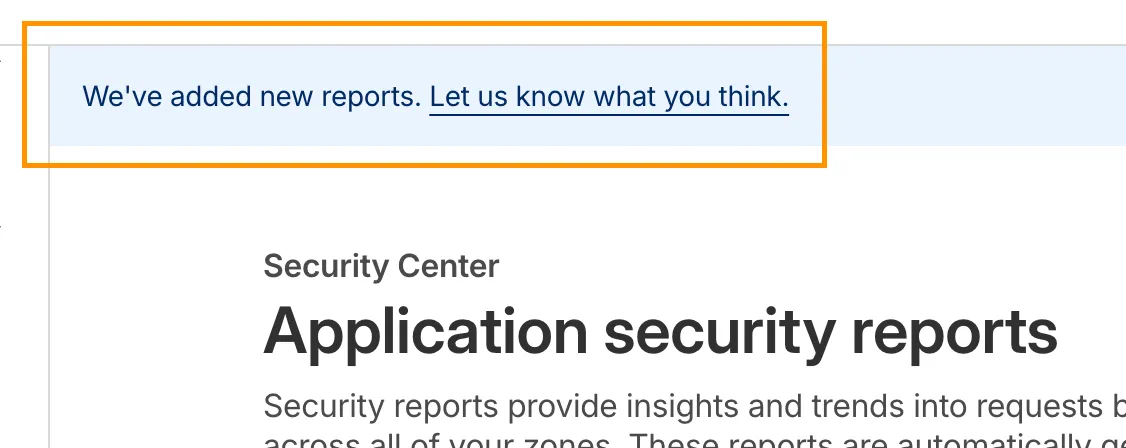
Use the feedback survey link at the top of the page to help us improve the reports.
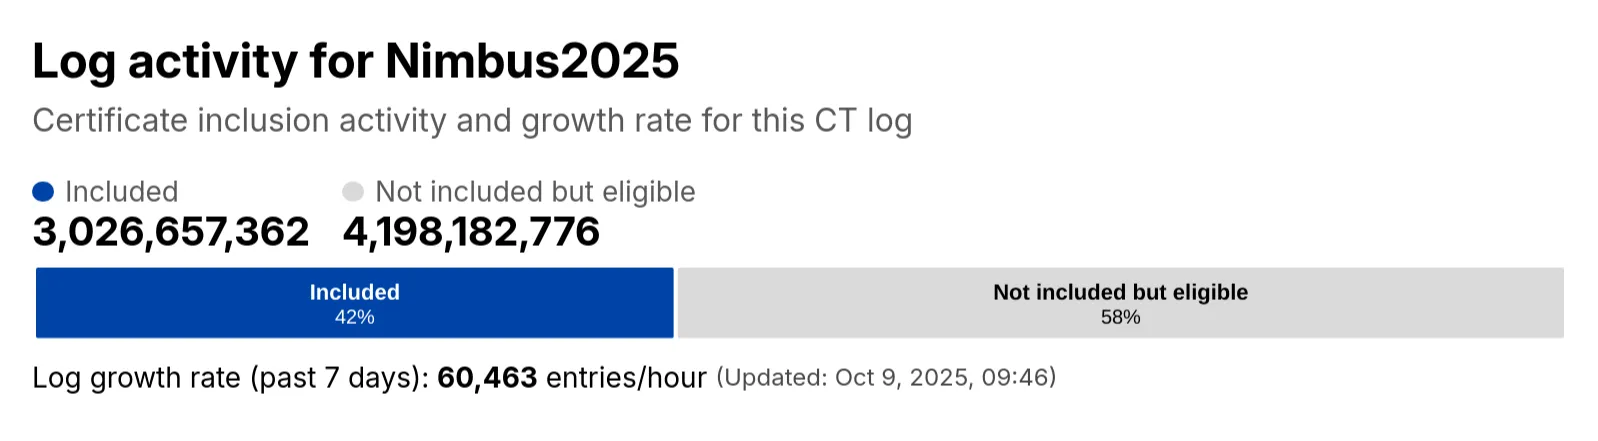
Radar has expanded its Certificate Transparency (CT) log insights with new stats that provide greater visibility into log activity:
- Log growth rate: The average throughput of the CT log over the past 7 days, measured in certificates per hour.
- Included certificate count: The total number of certificates already included in this CT log.
- Eligible-for-inclusion certificate count: The number of certificates eligible for inclusion in this log but not yet included. This metric is based on certificates signed by trusted root CAs within the log’s accepted date range.
- Last update: The timestamp of the most recent update to the CT log.
These new statistics have been added to the response of the Get Certificate Log Details API endpoint, and are displayed on the CT log information page ↗.
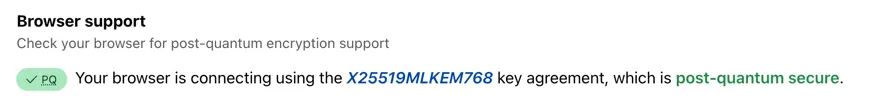
Radar now includes browser detection for Post-quantum (PQ) encryption. The Post-quantum encryption card ↗ now checks whether a user’s browser supports post-quantum encryption. If support is detected, information about the key agreement in use is displayed.
You can now perform more powerful queries directly in Workers Analytics Engine ↗ with a major expansion of our SQL function library.
Workers Analytics Engine allows you to ingest and store high-cardinality data at scale (such as custom analytics) and query your data through a simple SQL API.
Today, we've expanded Workers Analytics Engine's SQL capabilities with several new functions:
argMin()- Returns the value associated with the minimum in a groupargMax()- Returns the value associated with the maximum in a grouptopK()- Returns an array of the most frequent values in a grouptopKWeighted()- Returns an array of the most frequent values in a group using weightsfirst_value()- Returns the first value in an ordered set of values within a partitionlast_value()- Returns the last value in an ordered set of values within a partition
bitAnd()- Returns the bitwise AND of two expressionsbitCount()- Returns the number of bits set to one in the binary representation of a numberbitHammingDistance()- Returns the number of bits that differ between two numbersbitNot()- Returns a number with all bits flippedbitOr()- Returns the inclusive bitwise OR of two expressionsbitRotateLeft()- Rotates all bits in a number left by specified positionsbitRotateRight()- Rotates all bits in a number right by specified positionsbitShiftLeft()- Shifts all bits in a number left by specified positionsbitShiftRight()- Shifts all bits in a number right by specified positionsbitTest()- Returns the value of a specific bit in a numberbitXor()- Returns the bitwise exclusive-or of two expressions
abs()- Returns the absolute value of a numberlog()- Computes the natural logarithm of a numberround()- Rounds a number to a specified number of decimal placesceil()- Rounds a number up to the nearest integerfloor()- Rounds a number down to the nearest integerpow()- Returns a number raised to the power of another number
lowerUTF8()- Converts a string to lowercase using UTF-8 encodingupperUTF8()- Converts a string to uppercase using UTF-8 encoding
hex()- Converts a number to its hexadecimal representationbin()- Converts a string to its binary representation
New type conversion functions: ↗
toUInt8()- Converts any numeric expression, or expression resulting in a string representation of a decimal, into an unsigned 8 bit integer
Whether you're building usage-based billing systems, customer analytics dashboards, or other custom analytics, these functions let you get the most out of your data. Get started with Workers Analytics Engine and explore all available functions in our SQL reference documentation.
The GraphQL Analytics API now supports confidence intervals for
sumandcountfields on adaptive (sampled) datasets. Confidence intervals provide a statistical range around sampled results, helping verify accuracy and quantify uncertainty.- Supported datasets: Adaptive (sampled) datasets only.
- Supported fields: All
sumandcountfields. - Usage: The confidence
levelmust be provided as a decimal between 0 and 1 (e.g.0.90,0.95,0.99). - Default: If no confidence level is specified, no intervals are returned.
For examples and more details, see the GraphQL Analytics API documentation.
Radar now introduces Regional Data, providing traffic insights that bring a more localized perspective to the traffic trends shown on Radar.
The following API endpoints are now available:
Get Geolocation- Retrieves geolocation bygeoId.List Geolocations- Lists geolocations.NetFlows Summary By Dimension- Retrieves NetFlows summary by dimension.
All
summaryandtimeseries_groupsendpoints inHTTPandNetFlowsnow include anadm1dimension for grouping data by first level administrative division (for example, state, province, etc.)A new filter
geoIdwas also added to all endpoints inHTTPandNetFlows, allowing filtering by a specific administrative division.Check out the new Regional traffic insights on a country specific traffic page new Radar page ↗.
Directly from Log Search results, customers can pivot to other parts of the Cloudflare dashboard to immediately take action as a result of their investigation.
From the
http_requestsorfw_eventsdataset results, right click on an IP Address or JA3 Fingerprint to pivot to the Investigate portal to lookup the reputation of an IP address or JA3 fingerprint.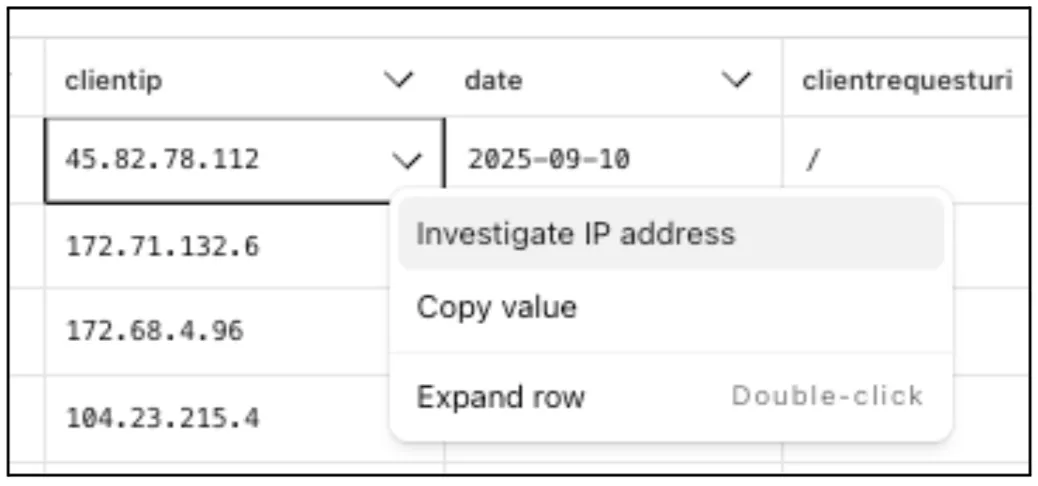
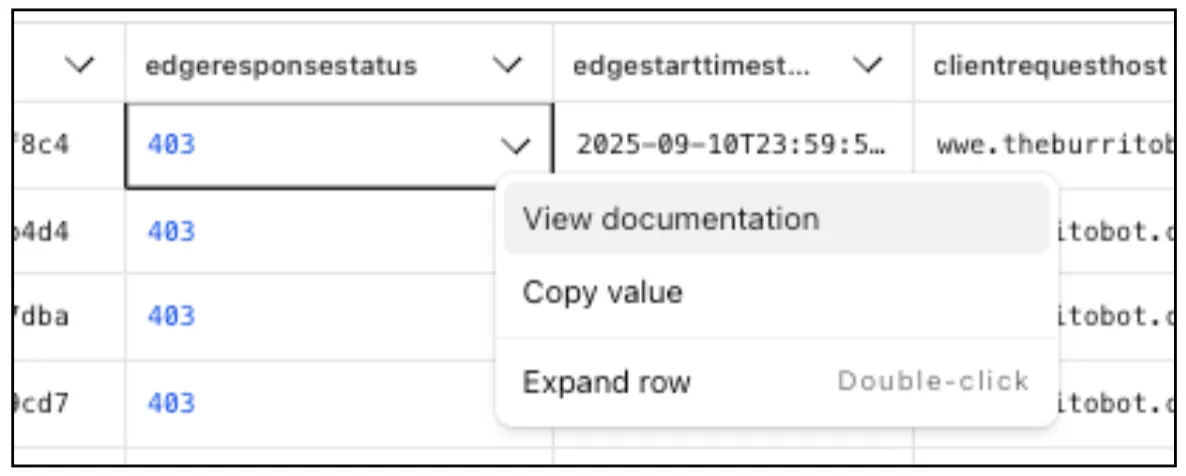
Easily learn about error codes by linking directly to our documentation from the EdgeResponseStatus or OriginResponseStatus fields.
From the
gateway_httpdataset, click on a policyid to link directly to the Zero Trust dashboard to review or make changes to a specific Gateway policy.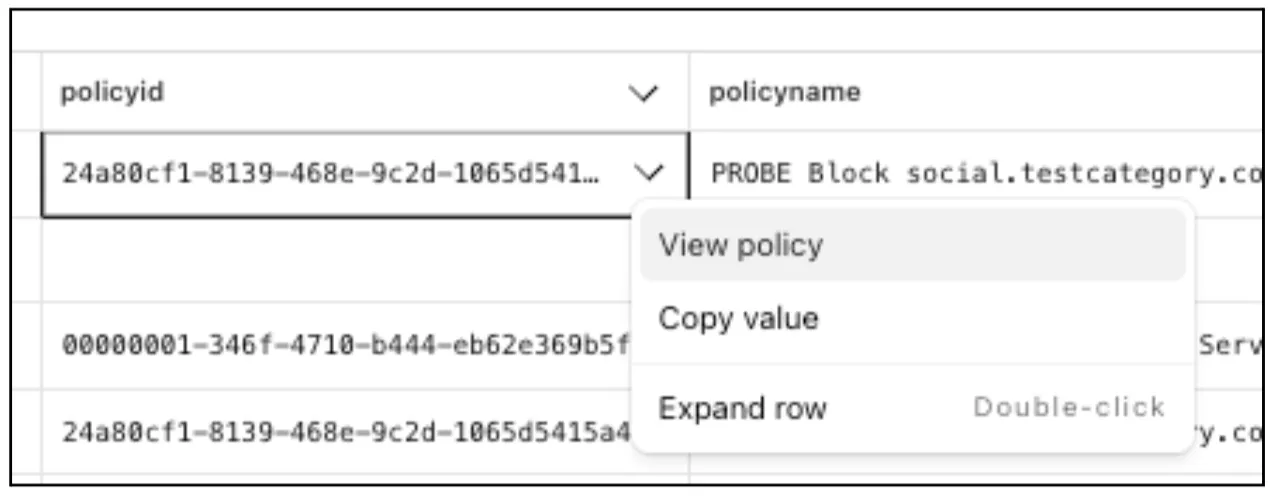
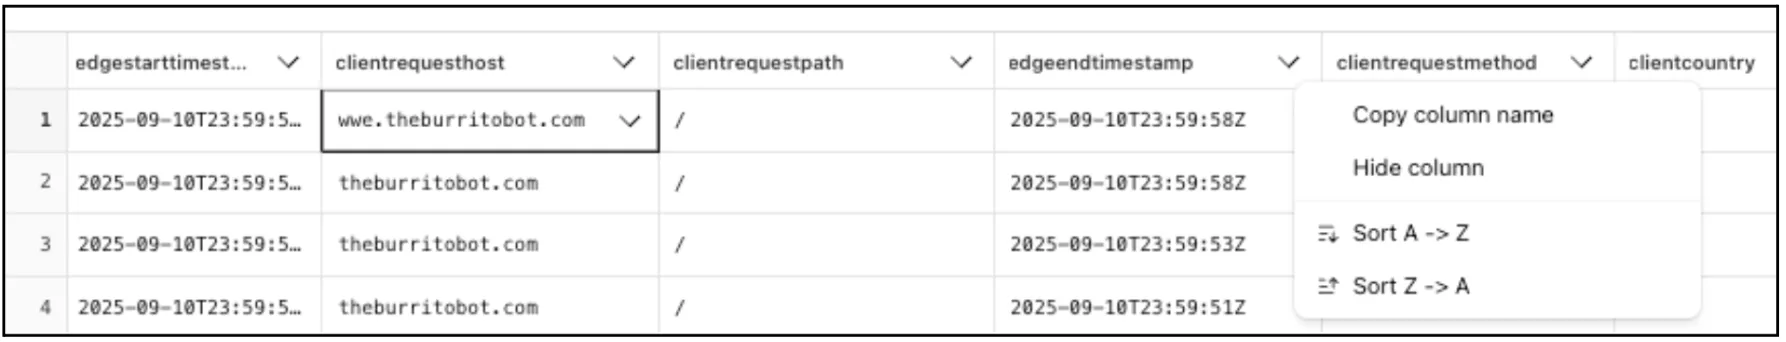
The results table view of Log Search has been updated with additional functionality and a more streamlined user experience. Users can now easily:
- Remove/add columns.
- Resize columns.
- Sort columns.
- Copy values from any field.
Log Explorer now supports logging and filtering on header or cookie fields in the
http_requestsdataset.Create a custom field to log desired header or cookie values into the
http_requestsdataset and Log Explorer will import these as searchable fields. Once configured, use the custom SQL editor in Log Explorer to view or filter on these requests.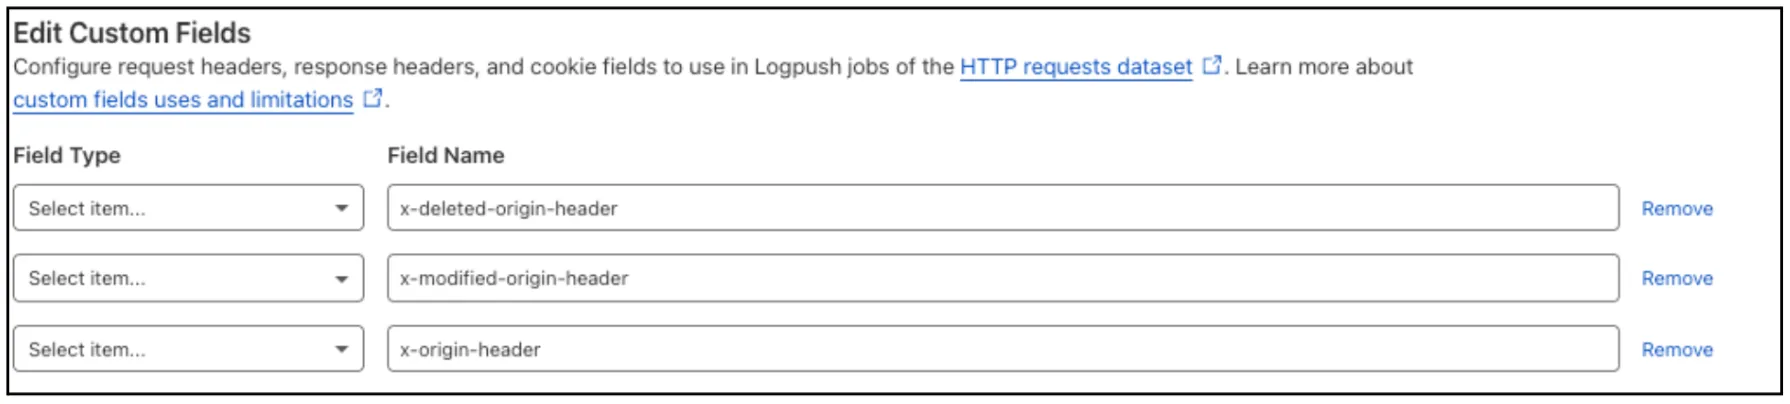
For more details, refer to Headers and cookies.
Digital Experience Monitoring (DEX) provides visibility into device connectivity and performance across your Cloudflare SASE deployment.
We've released an MCP server (Model Context Protocol) ↗ for DEX.
The DEX MCP server is an AI tool that allows customers to ask a question like, "Show me the connectivity and performance metrics for the device used by carly@acme.com", and receive an answer that contains data from the DEX API.
Any Cloudflare One customer using a Free, Pay-as-you-go, or Enterprise account can access the DEX MCP Server. This feature is available to everyone.
Customers can test the new DEX MCP server in less than one minute. To learn more, read the DEX MCP server documentation.
Cloudflare Logpush can now deliver logs from using fixed, dedicated egress IPs. By routing Logpush traffic through a Cloudflare zone enabled with Aegis IP, your log destination only needs to allow Aegis IPs making setup more secure.
Highlights:
- Fixed egress IPs ensure your destination only accepts traffic from known addresses.
- Works with any supported Logpush destination.
- Recommended to use a dedicated zone as a proxy for easier management.
To get started, work with your Cloudflare account team to provision Aegis IPs, then configure your Logpush job to deliver logs through the proxy zone. For full setup instructions, refer to the Logpush documentation.
Customers can now rely on Log Explorer to meet their log retention compliance requirements.
Contract customers can choose to store their logs in Log Explorer for up to two years, at an additional cost of $0.10 per GB per month. Customers interested in this feature can contact their account team to have it added to their contract.
Brand Protection detects domains that may be impersonating your brand — from common misspellings (
cloudfalre.com) to malicious concatenations (cloudflare-okta.com). Saved search queries run continuously and alert you when suspicious domains appear.You can now create and save multiple queries in a single step, streamlining setup and management. Available now via the Brand Protection bulk query creation API.
Cloudflare Logpush now supports IBM Cloud Logs as a native destination.
Logs from Cloudflare can be sent to IBM Cloud Logs ↗ via Logpush. The setup can be done through the Logpush UI in the Cloudflare Dashboard or by using the Logpush API. The integration requires IBM Cloud Logs HTTP Source Address and an IBM API Key. The feature also allows for filtering events and selecting specific log fields.
For more information, refer to Destination Configuration documentation.
Radar now introduces Certificate Transparency (CT) insights, providing visibility into certificate issuance trends based on Certificate Transparency logs currently monitored by Cloudflare.
The following API endpoints are now available:
/ct/timeseries: Retrieves certificate issuance time series./ct/summary/{dimension}: Retrieves certificate distribution by dimension./ct/timeseries_groups/{dimension}: Retrieves time series of certificate distribution by dimension./ct/authorities: Lists certification authorities./ct/authorities/{ca_slug}: Retrieves details about a Certification Authority (CA). CA information is derived from the Common CA Database (CCADB) ↗./ct/logs: Lists CT logs./ct/logs/{log_slug}: Retrieves details about a CT log. CT log information is derived from the Google Chrome log list ↗.
For the
summaryandtimeseries_groupsendpoints, the following dimensions are available (and also usable as filters):ca: Certification Authority (certificate issuer)ca_owner: Certification Authority Ownerduration: Certificate validity duration (between NotBefore and NotAfter dates)entry_type: Entry type (certificate vs. pre-certificate)expiration_status: Expiration status (valid vs. expired)has_ips: Presence of IP addresses in certificate Subject Alternative Names (SANs) ↗has_wildcards: Presence of wildcard DNS names in certificate SANslog: CT log namelog_api: CT log API (RFC6962 ↗ vs. Static ↗)log_operator: CT log operatorpublic_key_algorithm: Public key algorithm of certificate's keysignature_algorithm: Signature algorithm used by CA to sign certificatetld: Top-level domain for DNS names found in certificates SANsvalidation_level: Validation level ↗
Check out the new Certificate Transparency insights in the new Radar page ↗.
The Brand Protection API is now available, allowing users to create new queries and delete existing ones, fetch matches and more!
What you can do:
- create new string or logo query
- delete string or logo queries
- download matches for both logo and string queries
- read matches for both logo and string queries
Ready to start? Check out the Brand Protection API in our documentation.
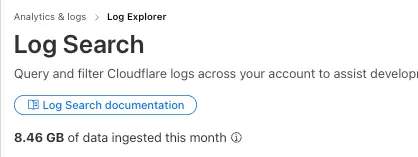
Log Explorer customers can now monitor their data ingestion volume to keep track of their billing. Monthly usage is displayed at the top of the Log Search and Manage Datasets screens in Log Explorer.