
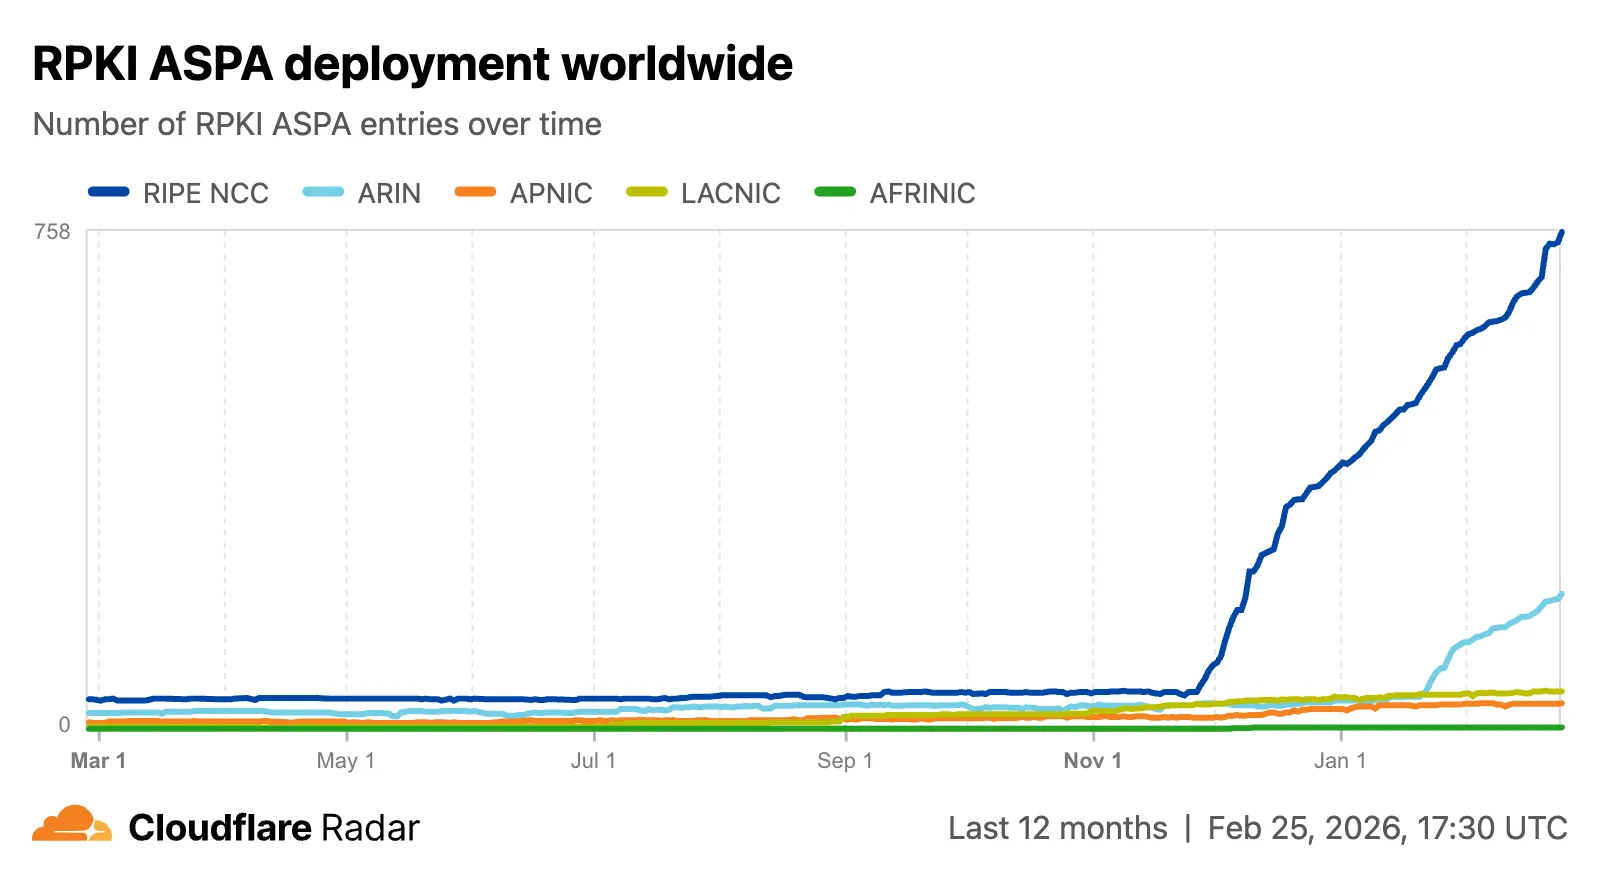
Radar now includes Autonomous System Provider Authorization (ASPA) ↗ deployment insights, providing visibility into the adoption and verification of ASPA objects across the global routing ecosystem.
The new
ASPAAPI provides the following endpoints:/bgp/rpki/aspa/snapshot- Retrieves current or historical ASPA objects./bgp/rpki/aspa/changes- Retrieves changes to ASPA objects over time./bgp/rpki/aspa/timeseries- Retrieves ASPA object counts over time as a timeseries.
The global routing page ↗ now shows the ASPA deployment trend over time by counting daily ASPA objects.
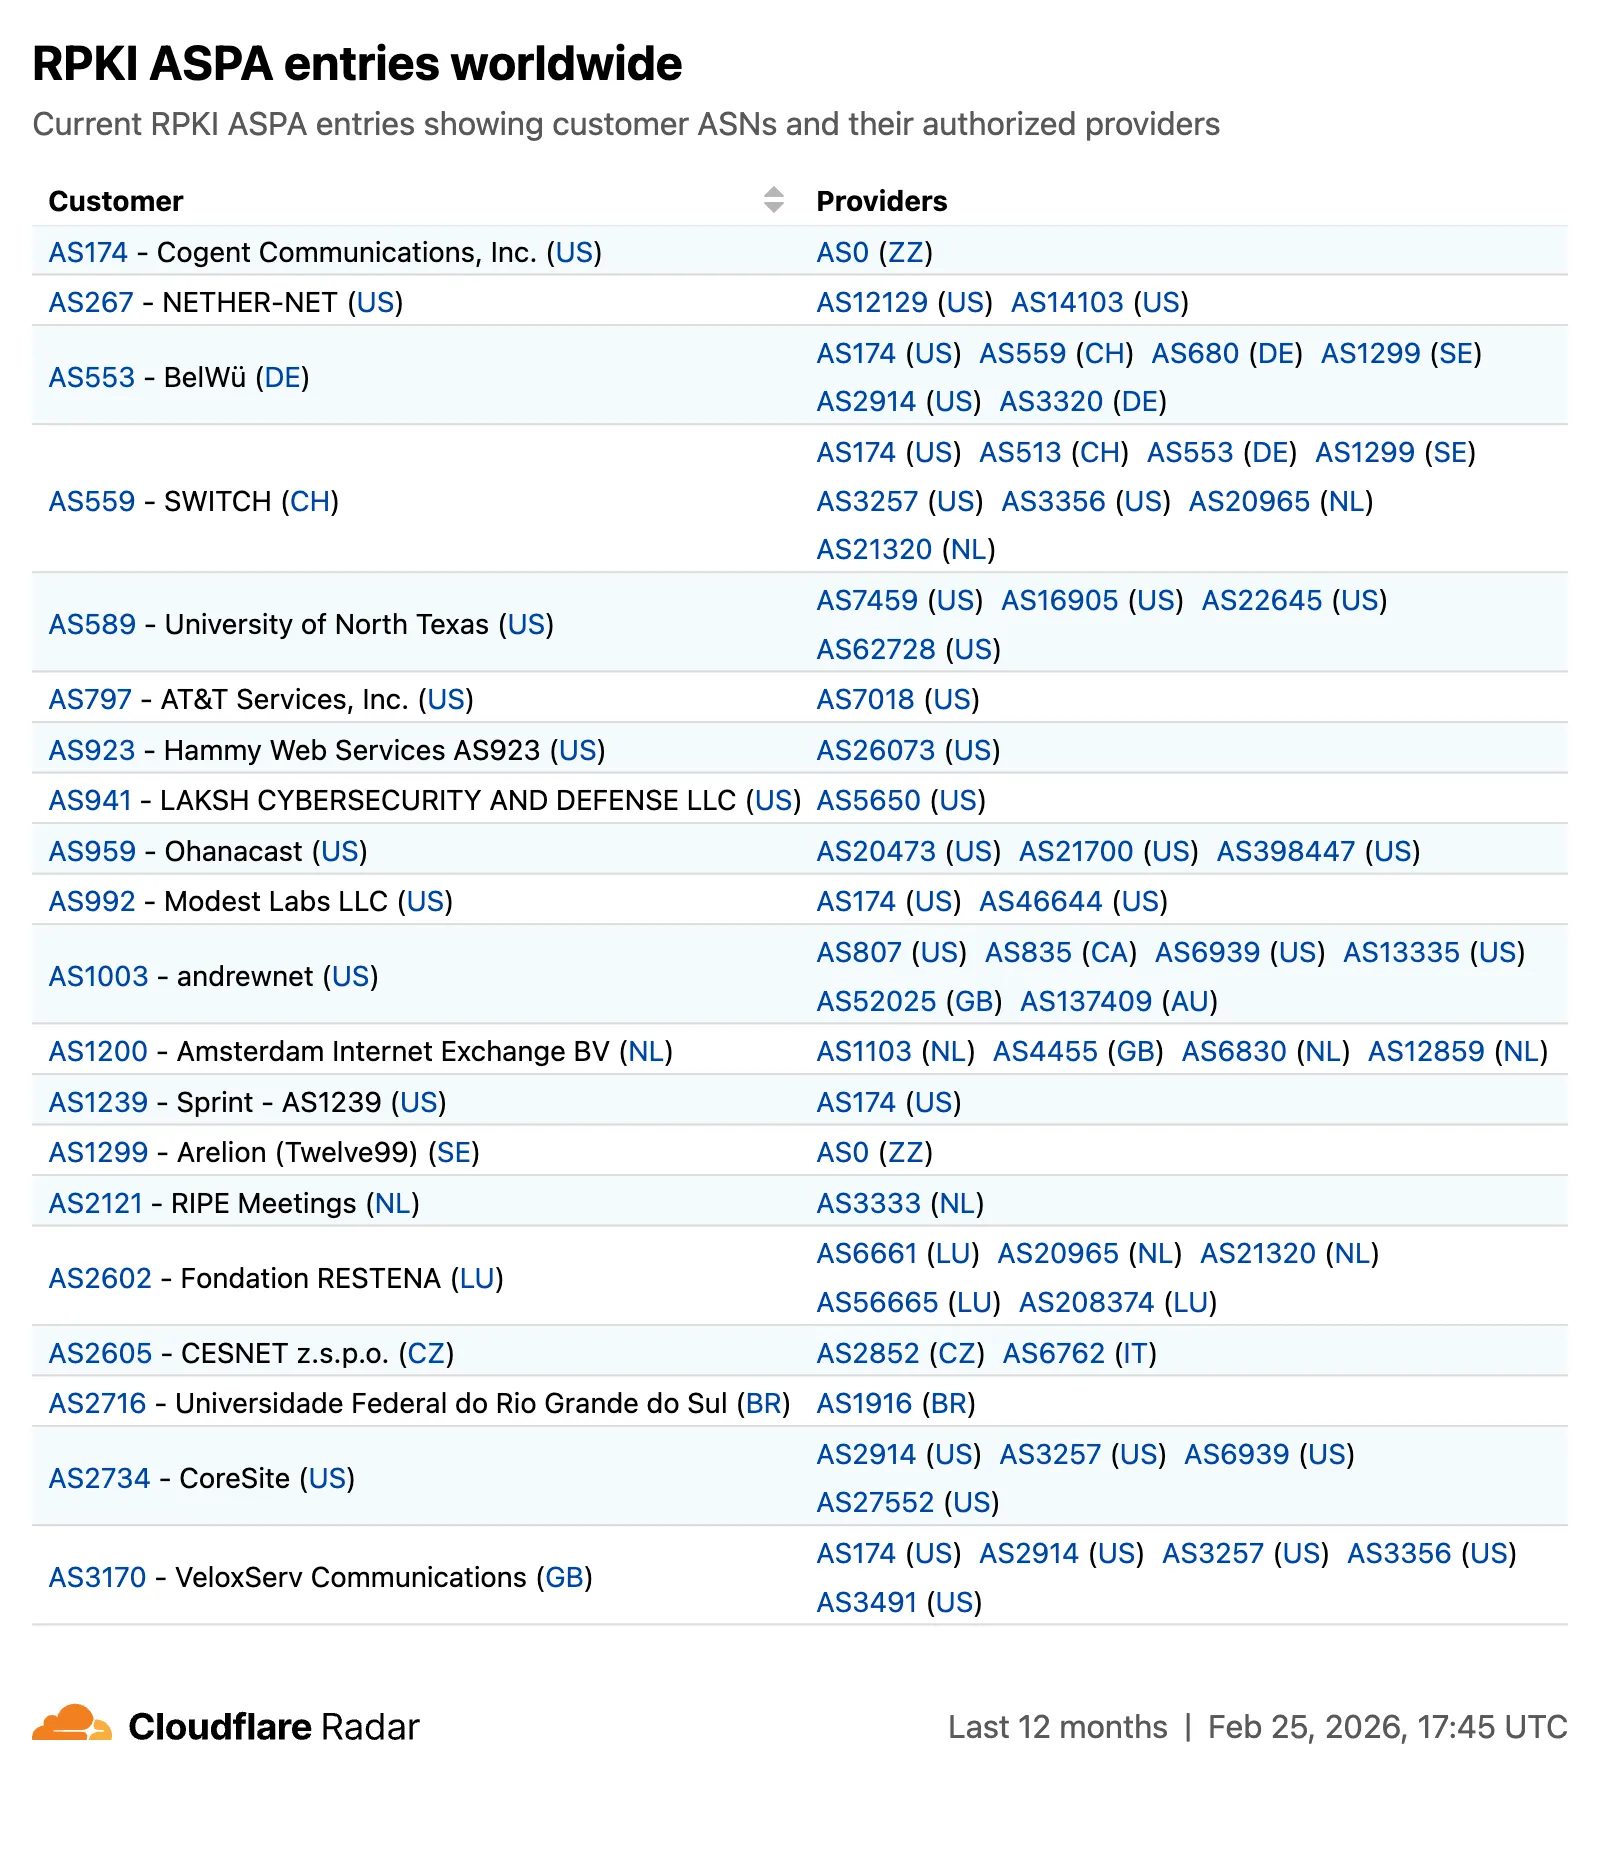
The global routing page also displays the most recent ASPA objects, searchable by ASN or AS name.
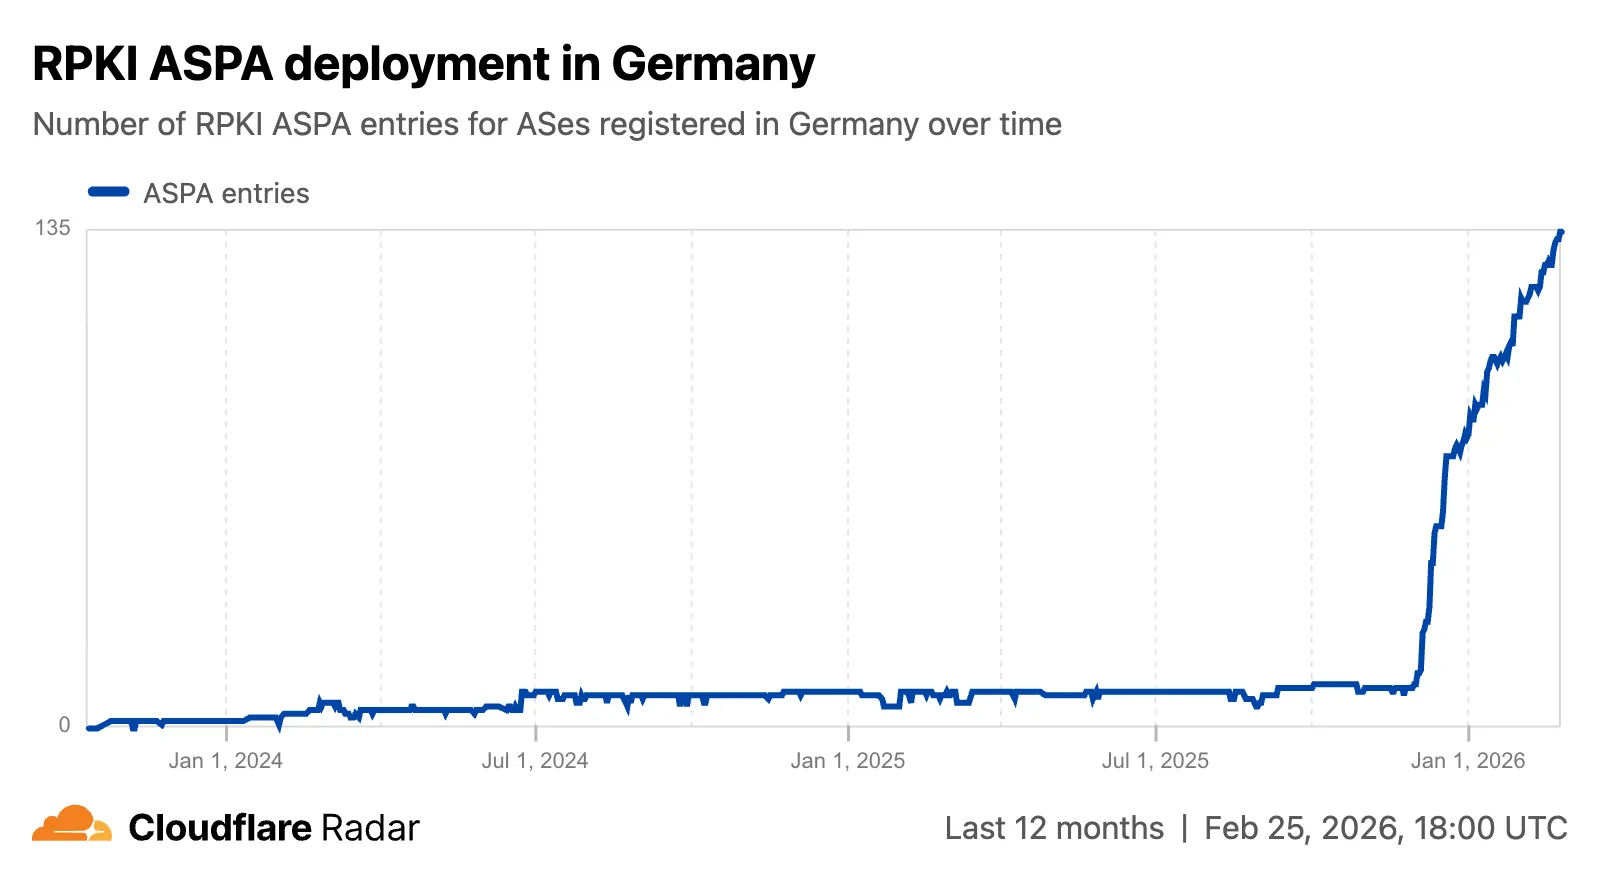
On country and region routing pages, a new widget shows the ASPA deployment rate for ASNs registered in the selected country or region.
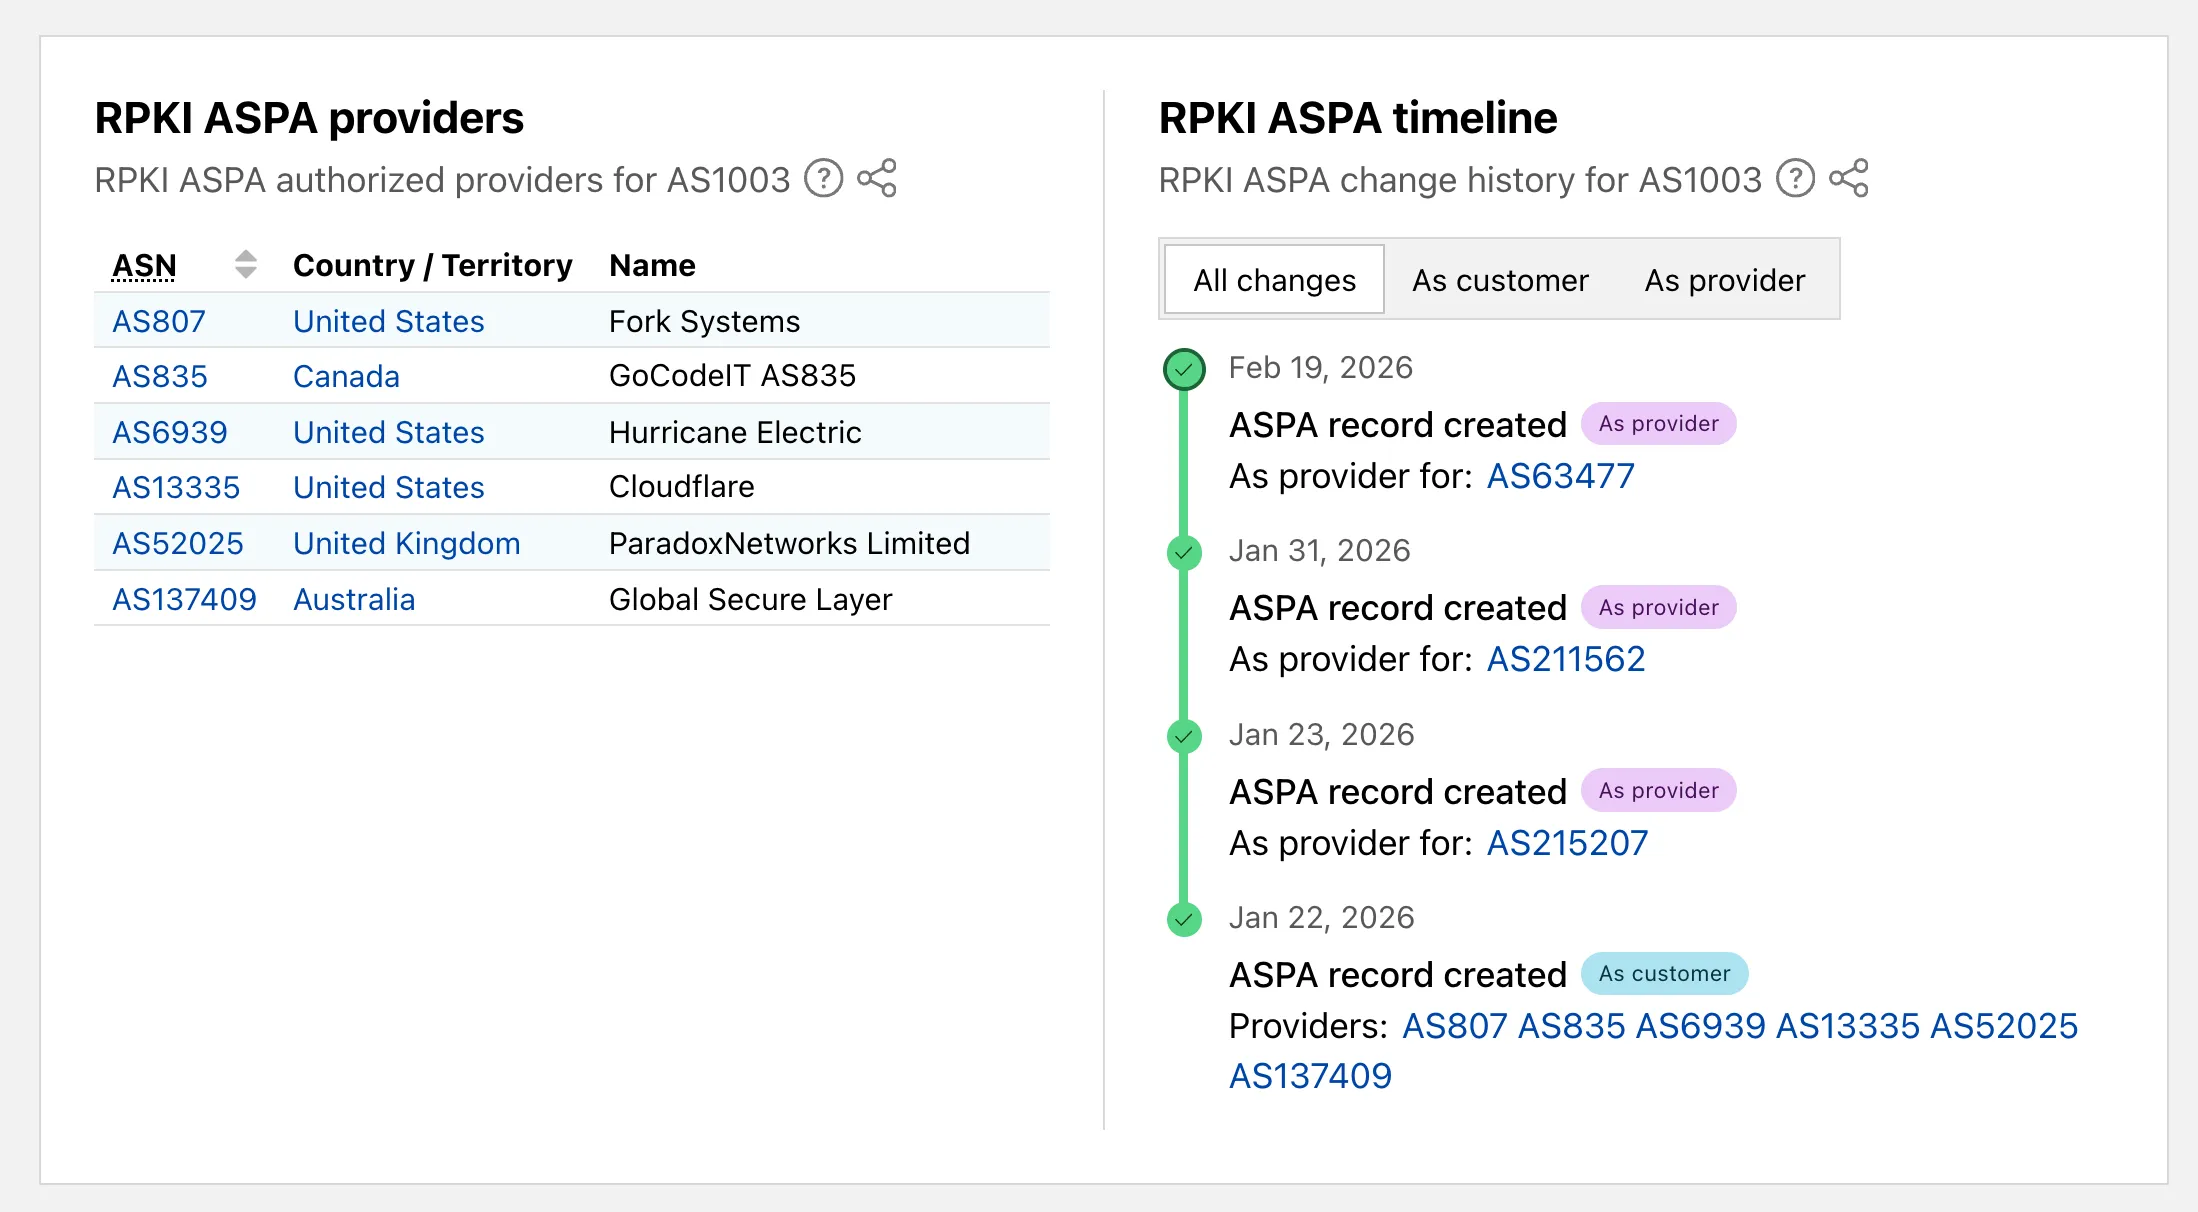
On AS routing pages, the connectivity table now includes checkmarks for ASPA-verified upstreams. All ASPA upstreams are listed in a dedicated table, and a timeline shows ASPA changes at daily granularity.
Check out the Radar routing page ↗ to explore the data.
TL;DR: You can now create and save custom configurations of the Threat Events dashboard, allowing you to instantly return to specific filtered views — such as industry-specific attacks or regional Sankey flows — without manual reconfiguration.
Threat intelligence is most effective when it is personalized. Previously, analysts had to manually re-apply complex filters (like combining specific industry datasets with geographic origins) every time they logged in. This update provides material value by:
- Analysts can now jump straight into "Known Ransomware Infrastructure" or "Retail Sector Targets" views with a single click, eliminating repetitive setup tasks
- Teams can ensure everyone is looking at the same data subsets by using standardized saved views, reducing the risk of missing critical patterns due to inconsistent filtering.
Cloudforce One subscribers can start saving their custom views now in Application Security > Threat Intelligence > Threat Events ↗.
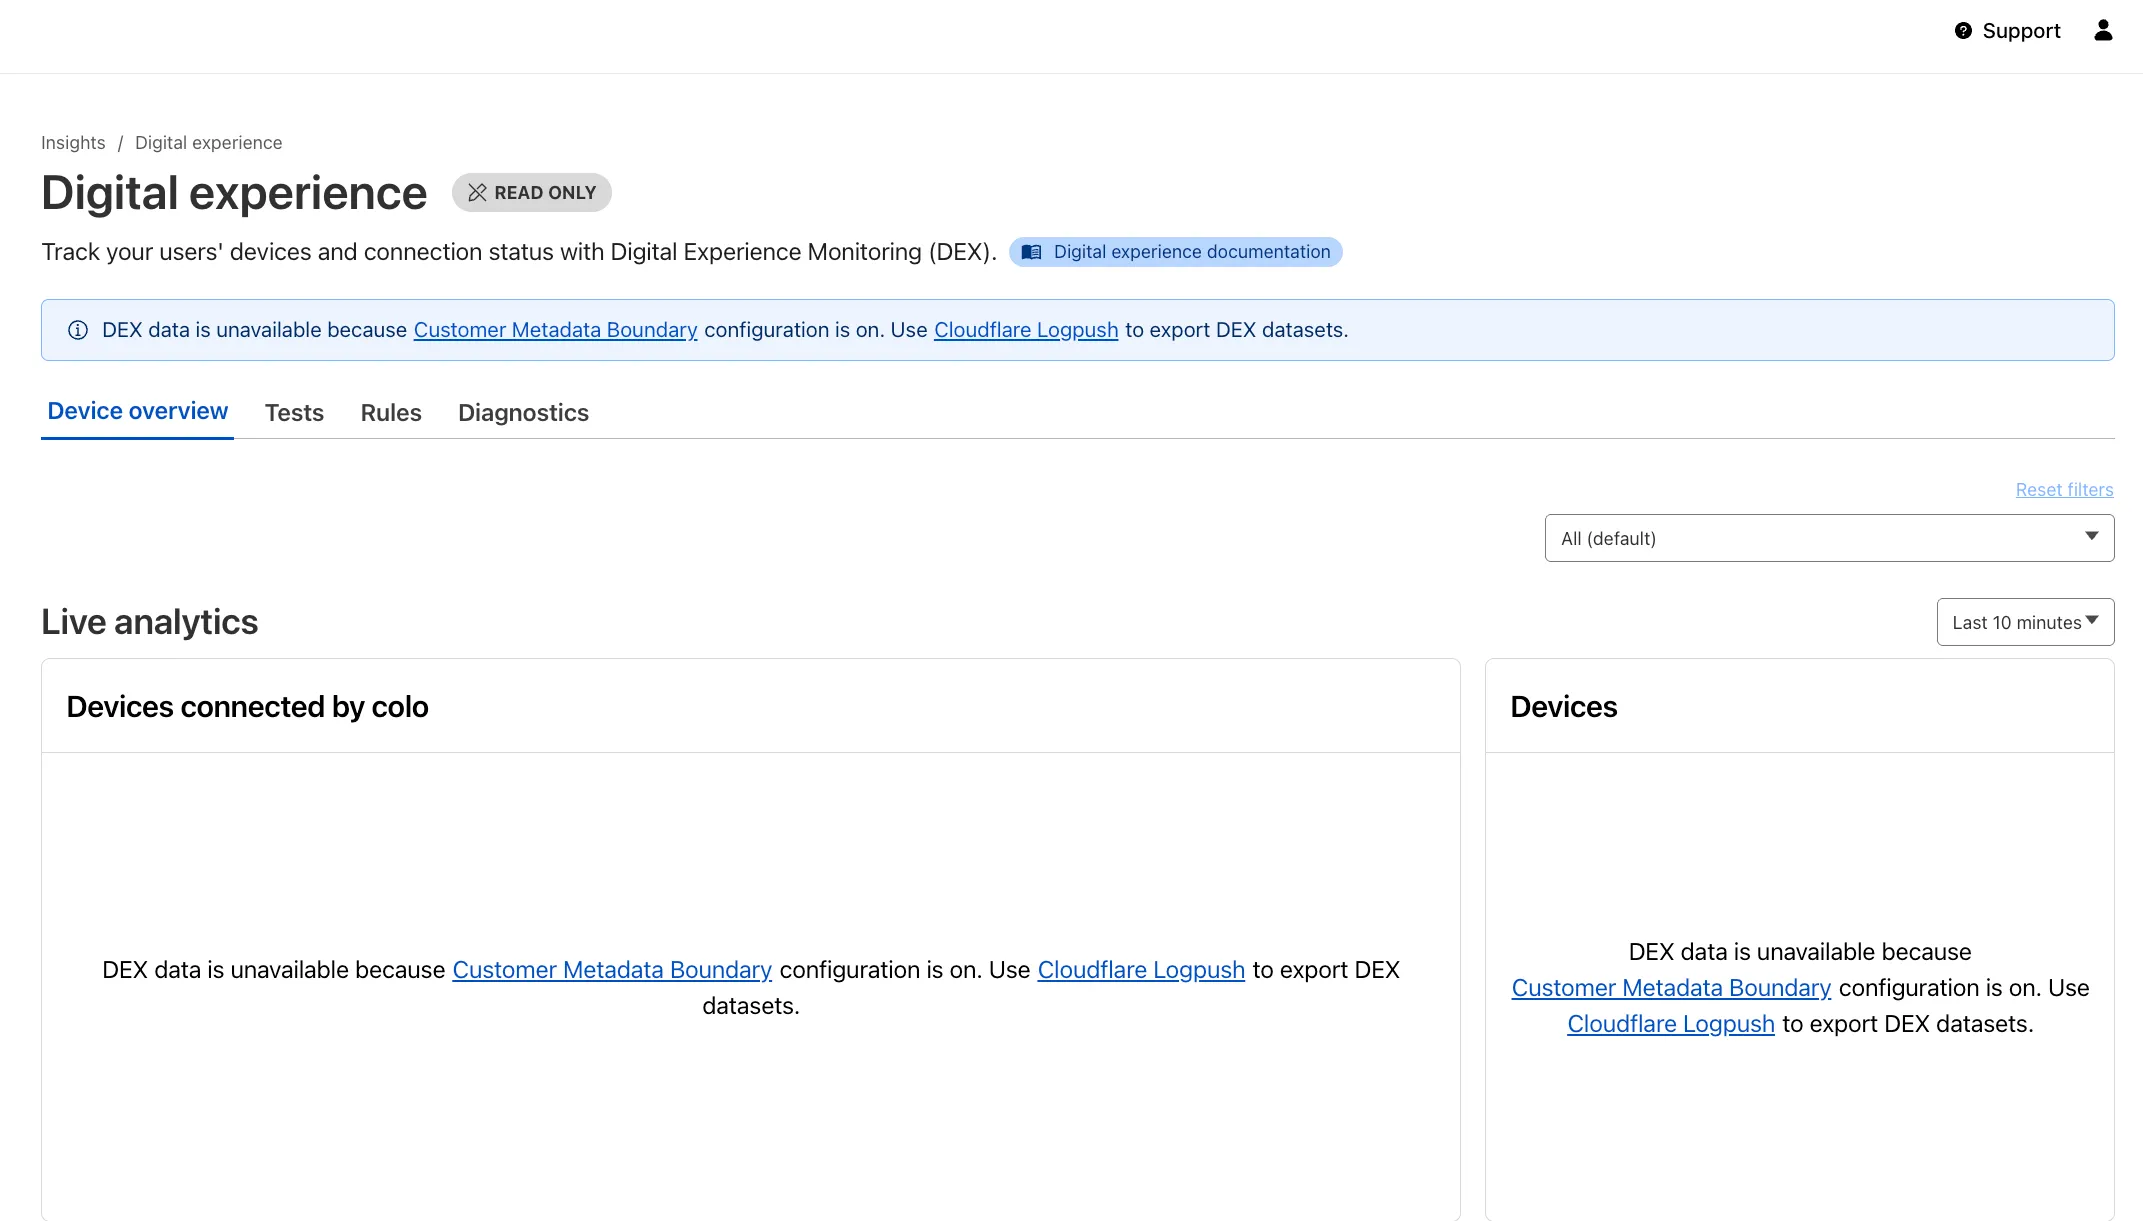
Digital Experience Monitoring (DEX) provides visibility into WARP device connectivity and performance to any internal or external application.
Now, all DEX logs are fully compatible with Cloudflare's Customer Metadata Boundary (CMB) setting for the 'EU' (European Union), which ensures that DEX logs will not be stored outside the 'EU' when the option is configured.
If a Cloudflare One customer using DEX enables CMB 'EU', they will not see any DEX data in the Cloudflare One dashboard. Customers can ingest DEX data via LogPush, and build their own analytics and dashboards.
If a customer enables CMB in their account, they will see the following message in the Digital Experience dashboard: "DEX data is unavailable because Customer Metadata Boundary configuration is on. Use Cloudflare LogPush to export DEX datasets."
We have introduced dynamic visualizations to the Threat Events dashboard to help you better understand the threat landscape and identify emerging patterns at a glance.
What's new:
- Sankey Diagrams: Trace the flow of attacks from country of origin to target country to identify which regions are being hit hardest and where the threat infrastructure resides.
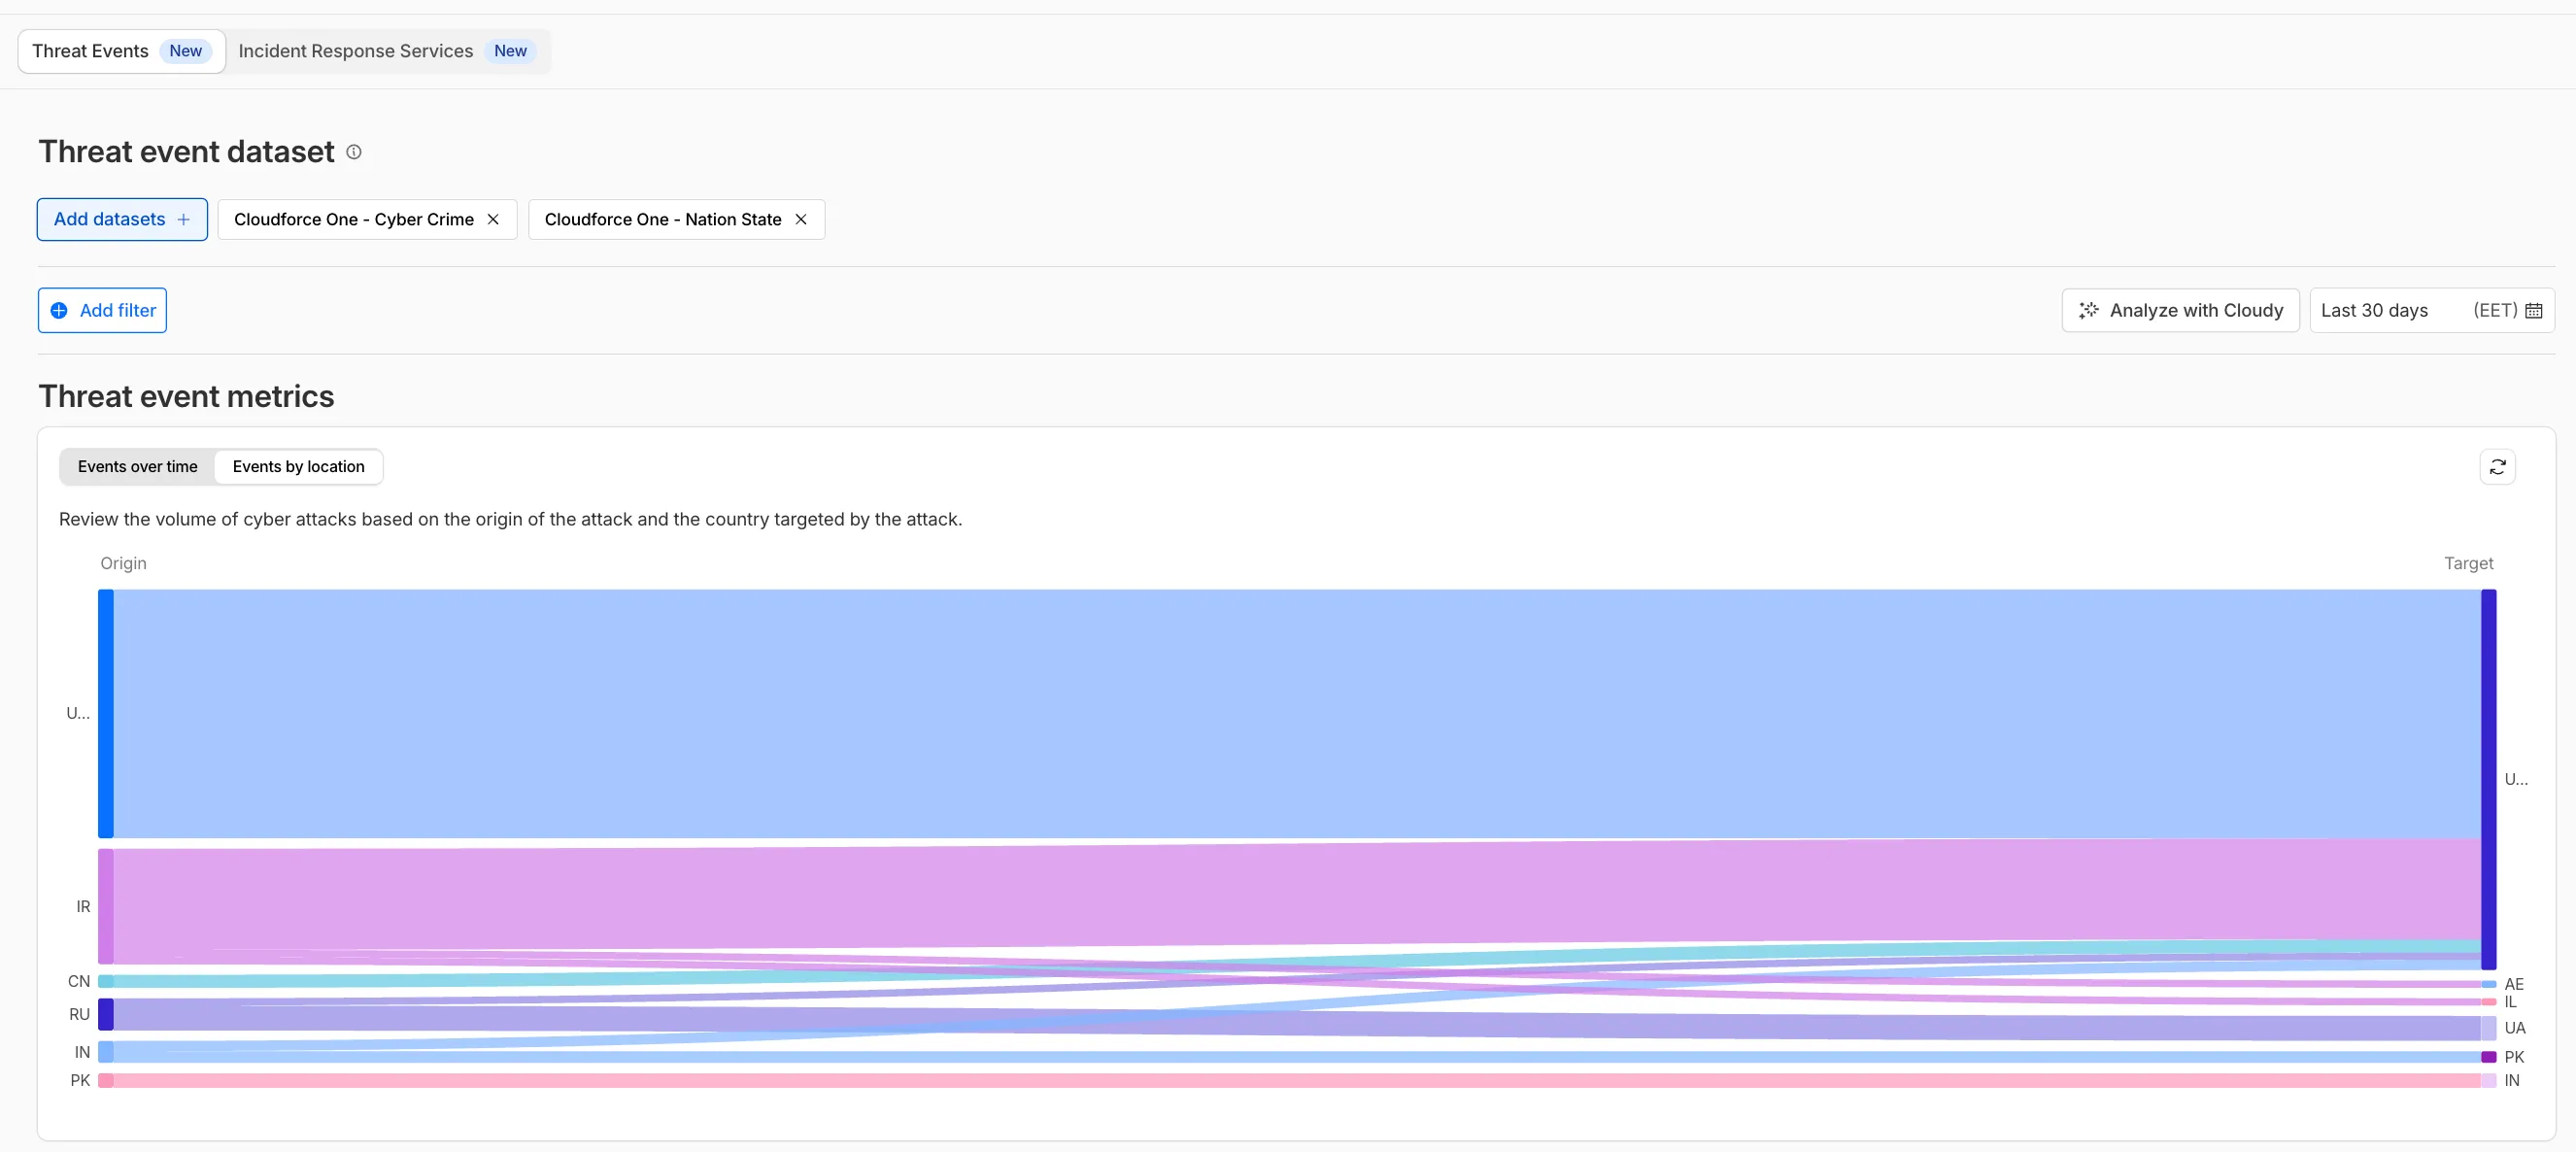
- Dataset Distribution over time: Instantly pivot your view to understand if a specific campaign is targeting your sector or if it is a broad-spectrum commodity attack.
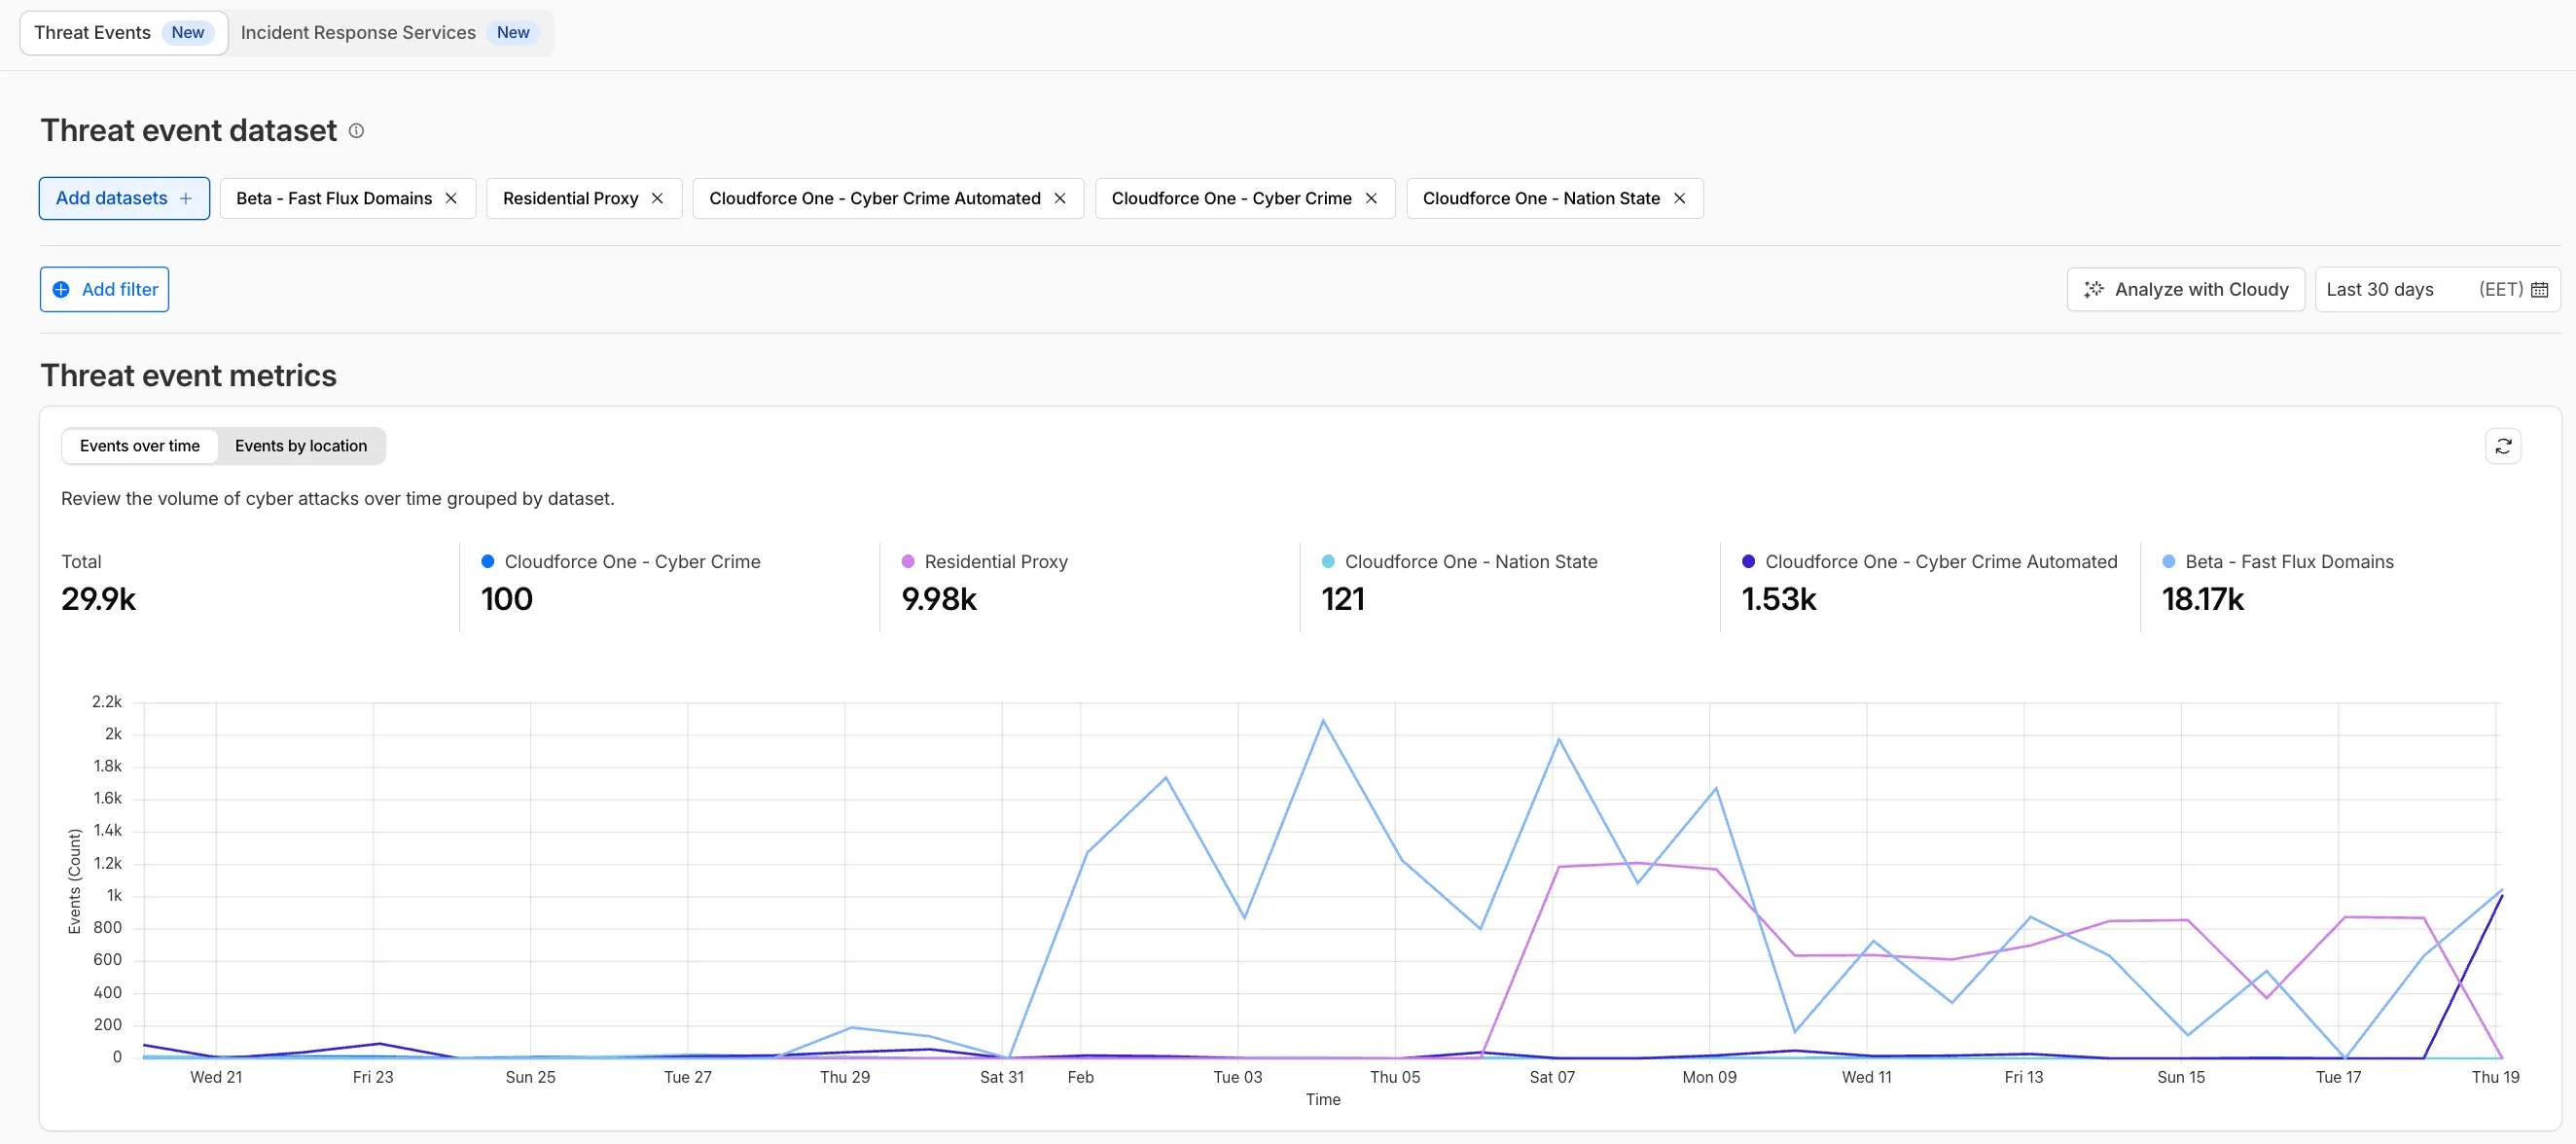
- Enhanced Filtering: Use these visual tools to filter and drill down into specific attack vectors directly from the charts.
Cloudforce One subscribers can explore these new views now in Application Security > Threat Intelligence > Threat Events ↗.
The Server-Timing header now includes a new
cfWorkermetric that measures time spent executing Cloudflare Workers, including any subrequests performed by the Worker. This helps developers accurately identify whether high Time to First Byte (TTFB) is caused by Worker processing or slow upstream dependencies.Previously, Worker execution time was included in the
edgemetric, making it harder to identify true edge performance. The newcfWorkermetric provides this visibility:Metric Description edgeTotal time spent on the Cloudflare edge, including Worker execution originTime spent fetching from the origin server cfWorkerTime spent in Worker execution, including subrequests but excluding origin fetch time Server-Timing: cdn-cache; desc=DYNAMIC, edge; dur=20, origin; dur=100, cfWorker; dur=7In this example, the edge took 20ms, the origin took 100ms, and the Worker added just 7ms of processing time.
The
cfWorkermetric is enabled by default if you have Real User Monitoring (RUM) enabled. Otherwise, you can enable it using Rules.This metric is particularly useful for:
- Performance debugging: Quickly determine if latency is caused by Worker code, external API calls within Workers, or slow origins.
- Optimization targeting: Identify which component of your request path needs optimization.
- Real User Monitoring (RUM): Access detailed timing breakdowns directly from response headers for client-side analytics.
For more information about Server-Timing headers, refer to the W3C Server Timing specification ↗.
We are updating naming related to some of our Networking products to better clarify their place in the Zero Trust and Secure Access Service Edge (SASE) journey.
We are retiring some older brand names in favor of names that describe exactly what the products do within your network. We are doing this to help customers build better, clearer mental models for comprehensive SASE architecture delivered on Cloudflare.
- Magic WAN → Cloudflare WAN
- Magic WAN IPsec → Cloudflare IPsec
- Magic WAN GRE → Cloudflare GRE
- Magic WAN Connector → Cloudflare One Appliance
- Magic Firewall → Cloudflare Network Firewall
- Magic Network Monitoring → Network Flow
- Magic Cloud Networking → Cloudflare One Multi-cloud Networking
No action is required by you — all functionality, existing configurations, and billing will remain exactly the same.
For more information, visit the Cloudflare One documentation.
Radar now includes content type insights for AI bot and crawler traffic. The new
content_typedimension and filter shows the distribution of content types returned to AI crawlers, grouped by MIME type category.The content type dimension and filter are available via the following API endpoints:
Content type categories:
- HTML - Web pages (
text/html) - Images - All image formats (
image/*) - JSON - JSON data and API responses (
application/json,*+json) - JavaScript - Scripts (
application/javascript,text/javascript) - CSS - Stylesheets (
text/css) - Plain Text - Unformatted text (
text/plain) - Fonts - Web fonts (
font/*,application/font-*) - XML - XML documents and feeds (
text/xml,application/xml,application/rss+xml,application/atom+xml) - YAML - Configuration files (
text/yaml,application/yaml) - Video - Video content and streaming (
video/*,application/ogg,*mpegurl) - Audio - Audio content (
audio/*) - Markdown - Markdown documents (
text/markdown) - Documents - PDFs, Office documents, ePub, CSV (
application/pdf,application/msword,text/csv) - Binary - Executables, archives, WebAssembly (
application/octet-stream,application/zip,application/wasm) - Serialization - Binary API formats (
application/protobuf,application/grpc,application/msgpack) - Other - All other content types
Additionally, individual bot information pages ↗ now display content type distribution for AI crawlers that exist in both the Verified Bots and AI Bots datasets.
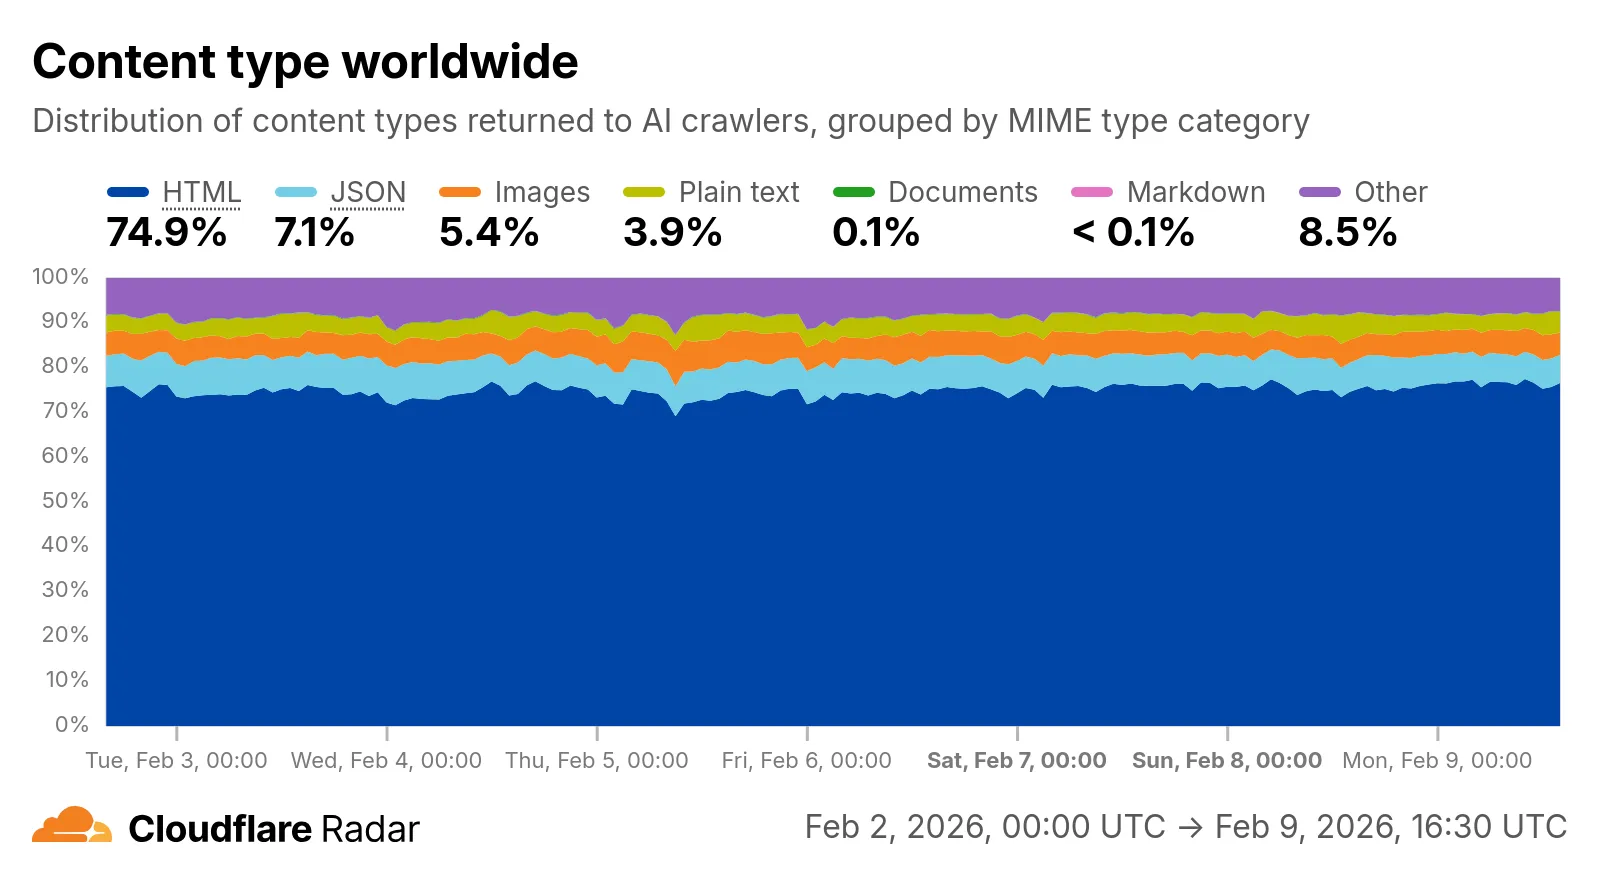
Check out the AI Insights page ↗ to explore the data.
- HTML - Web pages (
We have significantly upgraded our Logo Matching capabilities within Brand Protection. While previously limited to approximately 100% matches, users can now detect a wider range of brand assets through a redesigned matching model and UI.
- Configurable match thresholds: Users can set a minimum match score (starting at 75%) when creating a logo query to capture subtle variations or high-quality impersonations.
- Visual match scores: Allow users to see the exact percentage of the match directly in the results table, highlighted with color-coded lozenges to indicate severity.
- Direct logo previews: Available in the Cloudflare dashboard — similar to string matches — to verify infringements at a glance.
- Expose sophisticated impersonators who use slightly altered logos to bypass basic detection filters.
- Faster triage of the most relevant threats immediately using visual indicators, reducing the time spent manually reviewing matches.
Ready to protect your visual identity? Learn more in our Brand Protection documentation.
Log Explorer now supports multiple concurrent queries with the new Tabs feature. Work with multiple queries simultaneously and pivot between datasets to investigate malicious activity more effectively.
- Multiple tabs: Open and switch between multiple query tabs to compare results across different datasets.
- Quick filtering: Select the filter button from query results to add a value as a filter to your current query.
- Pivot to new tab: Use Cmd + click on the filter button to start a new query tab with that filter applied.
- Preserved progress: Your query progress is preserved on each tab if you navigate away and return.
For more information, refer to the Log Explorer documentation.
Identifying threat actors can be challenging, because naming conventions often vary across the security industry. To simplify your research, Cloudflare Threat Events now include an Also known as field, providing a list of common aliases and industry-standard names for the groups we track.
This new field is available in both the Cloudflare dashboard and via the API. In the dashboard, you can view these aliases by expanding the event details side panel (under the Attacker field) or by adding it as a column in your configurable table view.
- Easily map Cloudflare-tracked actors to the naming conventions used by other vendors without manual cross-referencing.
- Quickly identify if a detected threat actor matches a group your team is already monitoring via other intelligence feeds.
For more information on how to access this data, refer to the Threat Events API documentation ↗.
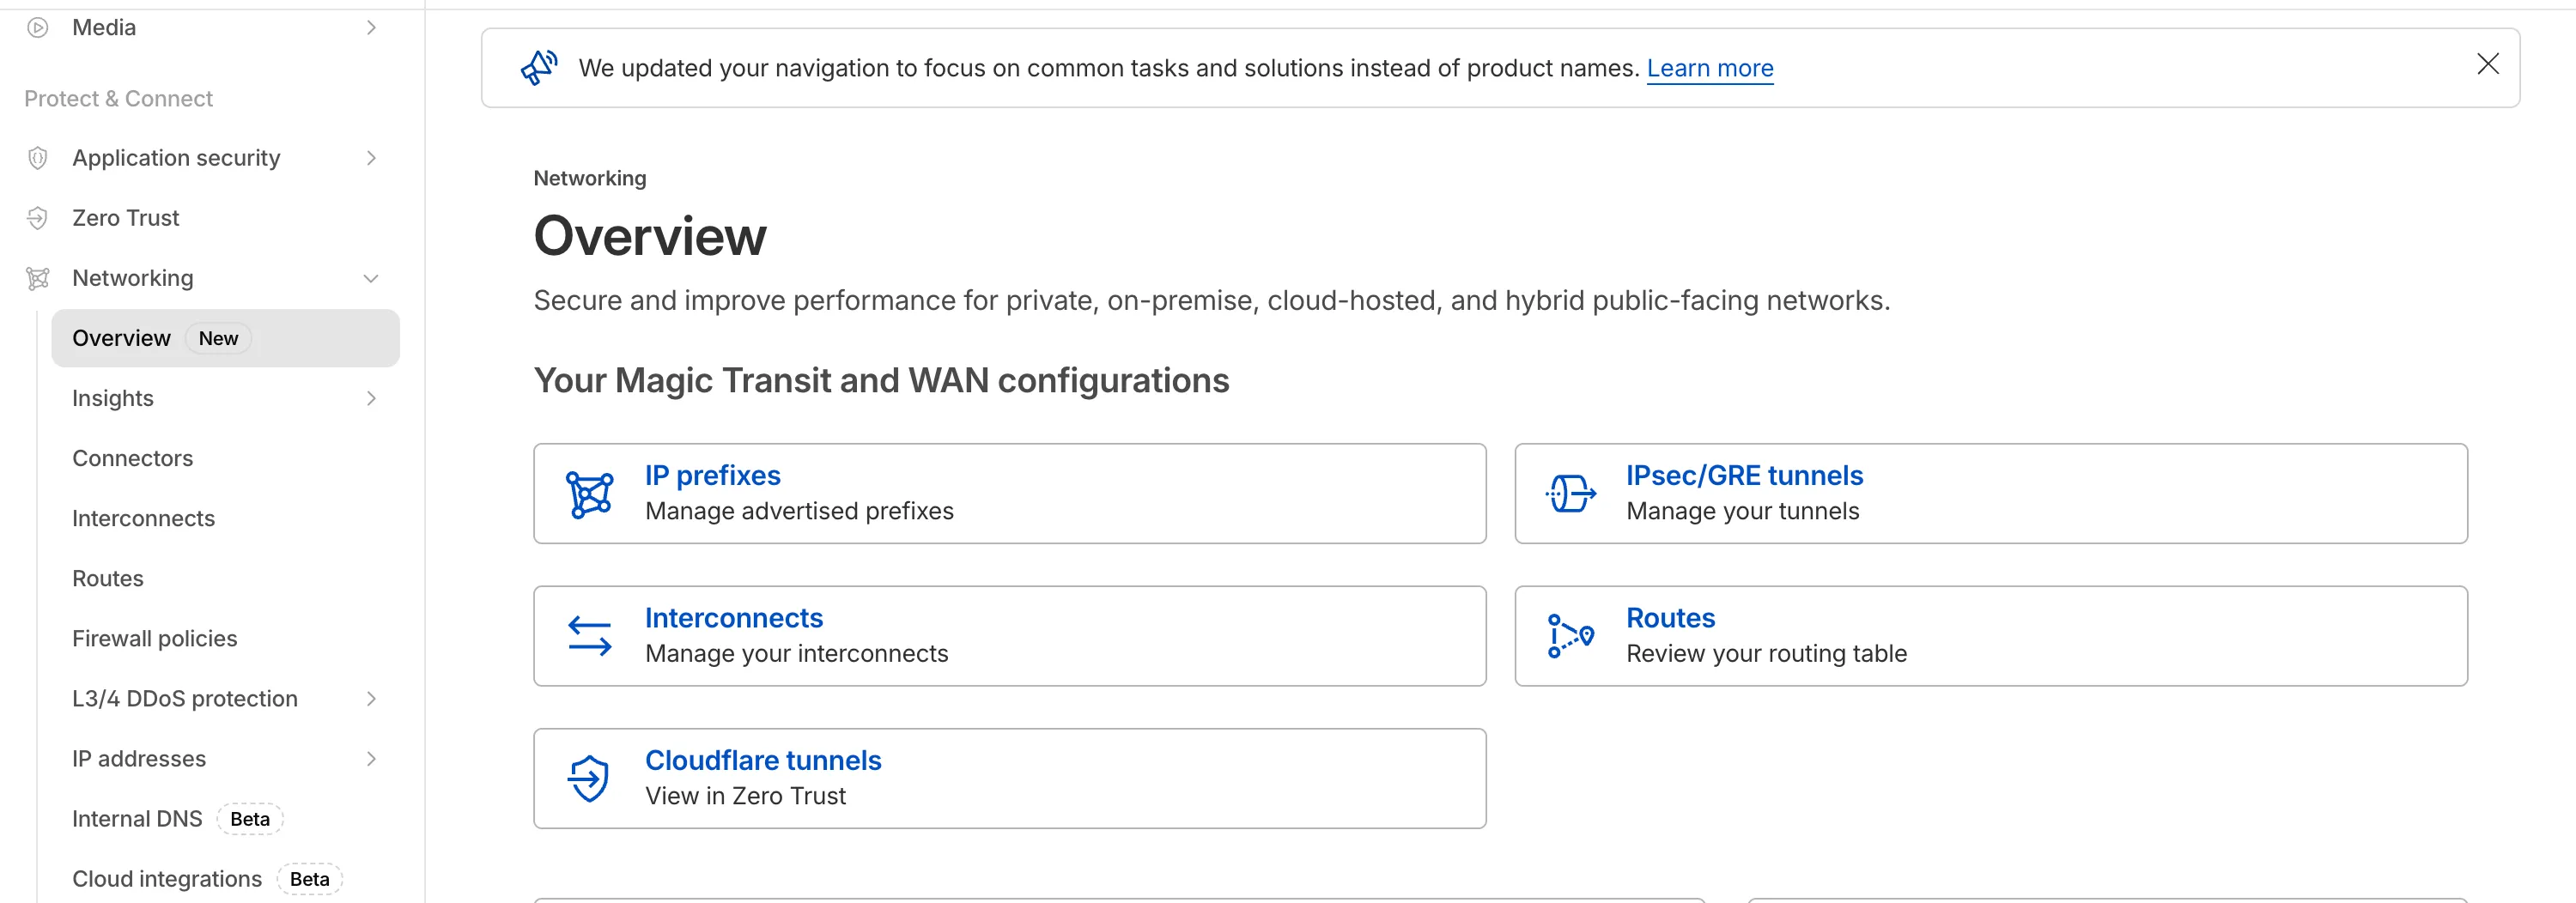
The Network Services menu structure in Cloudflare's dashboard has been updated to reflect solutions and capabilities instead of product names. This will make it easier for you to find what you need and better reflects how our services work together.
Your existing configurations will remain the same, and you will have access to all of the same features and functionality.
The changes visible in your dashboard may vary based on the products you use. Overall, changes relate to Magic Transit ↗, Magic WAN ↗, and Magic Firewall ↗.
Summary of changes:
- A new Overview page provides access to the most common tasks across Magic Transit and Magic WAN.
- Product names have been removed from top-level navigation.
- Magic Transit and Magic WAN configuration is now organized under Routes and Connectors. For example, you will find IP Prefixes under Routes, and your GRE/IPsec Tunnels under Connectors.
- Magic Firewall policies are now called Firewall Policies.
- Magic WAN Connectors and Connector On-Ramps are now referenced in the dashboard as Appliances and Appliance profiles. They can be found under Connectors > Appliances.
- Network analytics, network health, and real-time analytics are now available under Insights.
- Packet Captures are found under Insights > Diagnostics.
- You can manage your Sites from Insights > Network health.
- You can find Magic Network Monitoring under Insights > Network flow.
If you would like to provide feedback, complete this form ↗. You can also find these details in the January 7, 2026 email titled [FYI] Upcoming Network Services Dashboard Navigation Update.
We have expanded the reporting capabilities of the Cloudflare URL Scanner. In addition to existing JSON and HAR exports, users can now generate and download a PDF report directly from the Cloudflare dashboard. This update streamlines how security analysts can share findings with stakeholders who may not have access to the Cloudflare dashboard or specialized tools to parse JSON and HAR files.
Key Benefits:
- Consolidate scan results, including screenshots, security signatures, and metadata, into a single, portable document
- Easily share professional-grade summaries with non-technical stakeholders or legal teams for faster incident response
What’s new:
- PDF Export Button: A new download option is available in the URL Scanner results page within the Cloudflare dashboard
- Unified Documentation: Access all scan details—from high-level summaries to specific security flags—in one offline-friendly file
To get started with the URL Scanner and explore our reporting capabilities, visit the URL Scanner API documentation ↗.
We are excited to announce that Cloudflare Threat Events now supports the STIX2 (Structured Threat Information Expression) format. This was a highly requested feature designed to streamline how security teams consume and act upon our threat intelligence.
By adopting this industry-standard format, you can now integrate Cloudflare's threat events data more effectively into your existing security ecosystem.
-
Eliminate the need for custom parsers, as STIX2 allows for "out of the box" ingestion into major Threat Intel Platforms (TIPs), SIEMs, and SOAR tools.
-
STIX2 provides a standardized way to represent relationships between indicators, sightings, and threat actors, giving your analysts a clearer picture of the threat landscape.
For technical details on how to query events using this format, please refer to our Threat Events API Documentation ↗.
-
You can now use the
HAVINGclause andLIKEpattern matching operators in Workers Analytics Engine ↗.Workers Analytics Engine allows you to ingest and store high-cardinality data at scale and query your data through a simple SQL API.
The
HAVINGclause complements theWHEREclause by enabling you to filter groups based on aggregate values. WhileWHEREfilters rows before aggregation,HAVINGfilters groups after aggregation is complete.You can use
HAVINGto filter groups where the average exceeds a threshold:SELECTblob1 AS probe_name,avg(double1) AS average_tempFROM temperature_readingsGROUP BY probe_nameHAVING average_temp > 10You can also filter groups based on aggregates such as the number of items in the group:
SELECTblob1 AS probe_name,count() AS num_readingsFROM temperature_readingsGROUP BY probe_nameHAVING num_readings > 100The new pattern matching operators enable you to search for strings that match specific patterns using wildcard characters:
LIKE- case-sensitive pattern matchingNOT LIKE- case-sensitive pattern exclusionILIKE- case-insensitive pattern matchingNOT ILIKE- case-insensitive pattern exclusion
Pattern matching supports two wildcard characters:
%(matches zero or more characters) and_(matches exactly one character).You can match strings starting with a prefix:
SELECT *FROM logsWHERE blob1 LIKE 'error%'You can also match file extensions (case-insensitive):
SELECT *FROM requestsWHERE blob2 ILIKE '%.jpg'Another example is excluding strings containing specific text:
SELECT *FROM eventsWHERE blob3 NOT ILIKE '%debug%'Learn more about the
HAVINGclause or pattern matching operators in the Workers Analytics Engine SQL reference documentation.
The cached/uncached classification logic used in Zone Overview analytics has been updated to improve accuracy.
Previously, requests were classified as "cached" based on an overly broad condition that included blocked 403 responses, Snippets requests, and other non-cache request types. This caused inflated cache hit ratios — in some cases showing near-100% cached — and affected approximately 15% of requests classified as cached in rollups.
The condition has been removed from the Zone Overview page. Cached/uncached classification now aligns with the heuristics used in HTTP Analytics, so only requests genuinely served from cache are counted as cached.
What changed:
- Zone Overview — Cache ratios now reflect actual cache performance.
- HTTP Analytics — No change. HTTP Analytics already used the correct classification logic.
- Historical data — This fix applies to new requests only. Previously logged data is not retroactively updated.
Cloudflare Logpush now supports SentinelOne as a native destination.
Logs from Cloudflare can be sent to SentinelOne AI SIEM ↗ via Logpush. The destination can be configured through the Logpush UI in the Cloudflare dashboard or by using the Logpush API.
For more information, refer to the Destination Configuration documentation.
Radar introduces HTTP Origins insights, providing visibility into the status of traffic between Cloudflare's global network and cloud-based origin infrastructure.
The new
OriginsAPI provides provides the following endpoints:/origins- Lists all origins (cloud providers and associated regions)./origins/{origin}- Retrieves information about a specific origin (cloud provider)./origins/timeseries- Retrieves normalized time series data for a specific origin, including the following metrics:REQUESTS: Number of requestsCONNECTION_FAILURES: Number of connection failuresRESPONSE_HEADER_RECEIVE_DURATION: Duration of the response header receiveTCP_HANDSHAKE_DURATION: Duration of the TCP handshakeTCP_RTT: TCP round trip timeTLS_HANDSHAKE_DURATION: Duration of the TLS handshake
/origins/summary- Retrieves HTTP requests to origins summarized by a dimension./origins/timeseries_groups- Retrieves timeseries data for HTTP requests to origins grouped by a dimension.
The following dimensions are available for the
summaryandtimeseries_groupsendpoints:region: Origin regionsuccess_rate: Success rate of requests (2XX versus 5XX response codes)percentile: Percentiles of metrics listed above
Additionally, the
AnnotationsandTraffic AnomaliesAPIs have been extended to support origin outages and anomalies, enabling automated detection and alerting for origin infrastructure issues.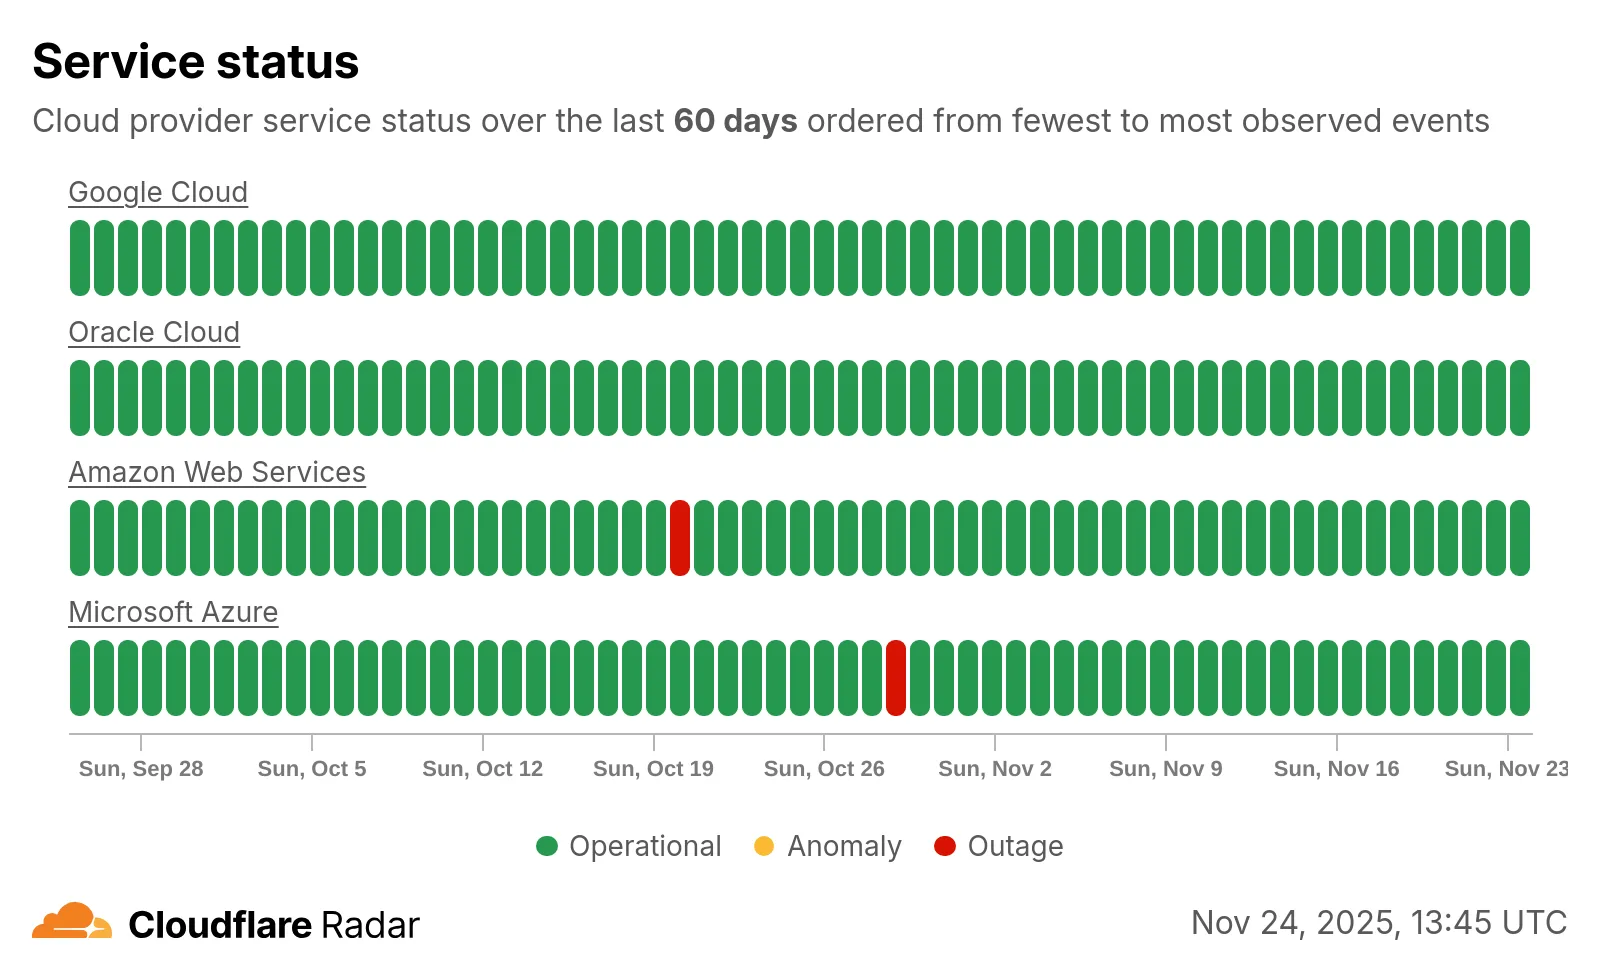
Check out the new Radar page ↗.
The threat events platform now has threat insights available for some relevant parent events. Threat intelligence analyst users can access these insights for their threat hunting activity. Insights are also highlighted in the Cloudflare dashboard by a small
lightning iconand the insights can refer to multiple, connected events, potentially part of the same attack or campaign and associated with the same threat actor.For more information, refer to Analyze threat events.
We've resolved a bug in Log Explorer that caused inconsistencies between the custom SQL date field filters and the date picker dropdown. Previously, users attempting to filter logs based on a custom date field via a SQL query sometimes encountered unexpected results or mismatching dates when using the interactive date picker.
This fix ensures that the custom SQL date field filters now align correctly with the selection made in the date picker dropdown, providing a reliable and predictable filtering experience for your log data. This is particularly important for users creating custom log views based on time-sensitive fields.
We've significantly enhanced Log Explorer by adding support for 14 additional Cloudflare product datasets.
This expansion enables Operations and Security Engineers to gain deeper visibility and telemetry across a wider range of Cloudflare services. By integrating these new datasets, users can now access full context to efficiently investigate security incidents, troubleshoot application performance issues, and correlate logged events across different layers (like application and network) within a single interface. This capability is crucial for a complete and cohesive understanding of event flows across your Cloudflare environment.
The newly supported datasets include:
Dns_logsNel_reportsPage_shield_eventsSpectrum_eventsZaraz_events
Audit LogsAudit_logs_v2Biso_user_actionsDNS firewall logsEmail_security_alertsMagic Firewall IDSNetwork AnalyticsSinkhole HTTPipsec_logs
You can now use Log Explorer to query and filter with each of these datasets. For example, you can identify an IP address exhibiting suspicious behavior in the
FW_eventlogs, and then instantly pivot to theNetwork Analyticslogs orAccesslogs to see its network-level traffic profile or if it bypassed a corporate policy.To learn more and get started, refer to the Log Explorer documentation and the Cloudflare Logs documentation.
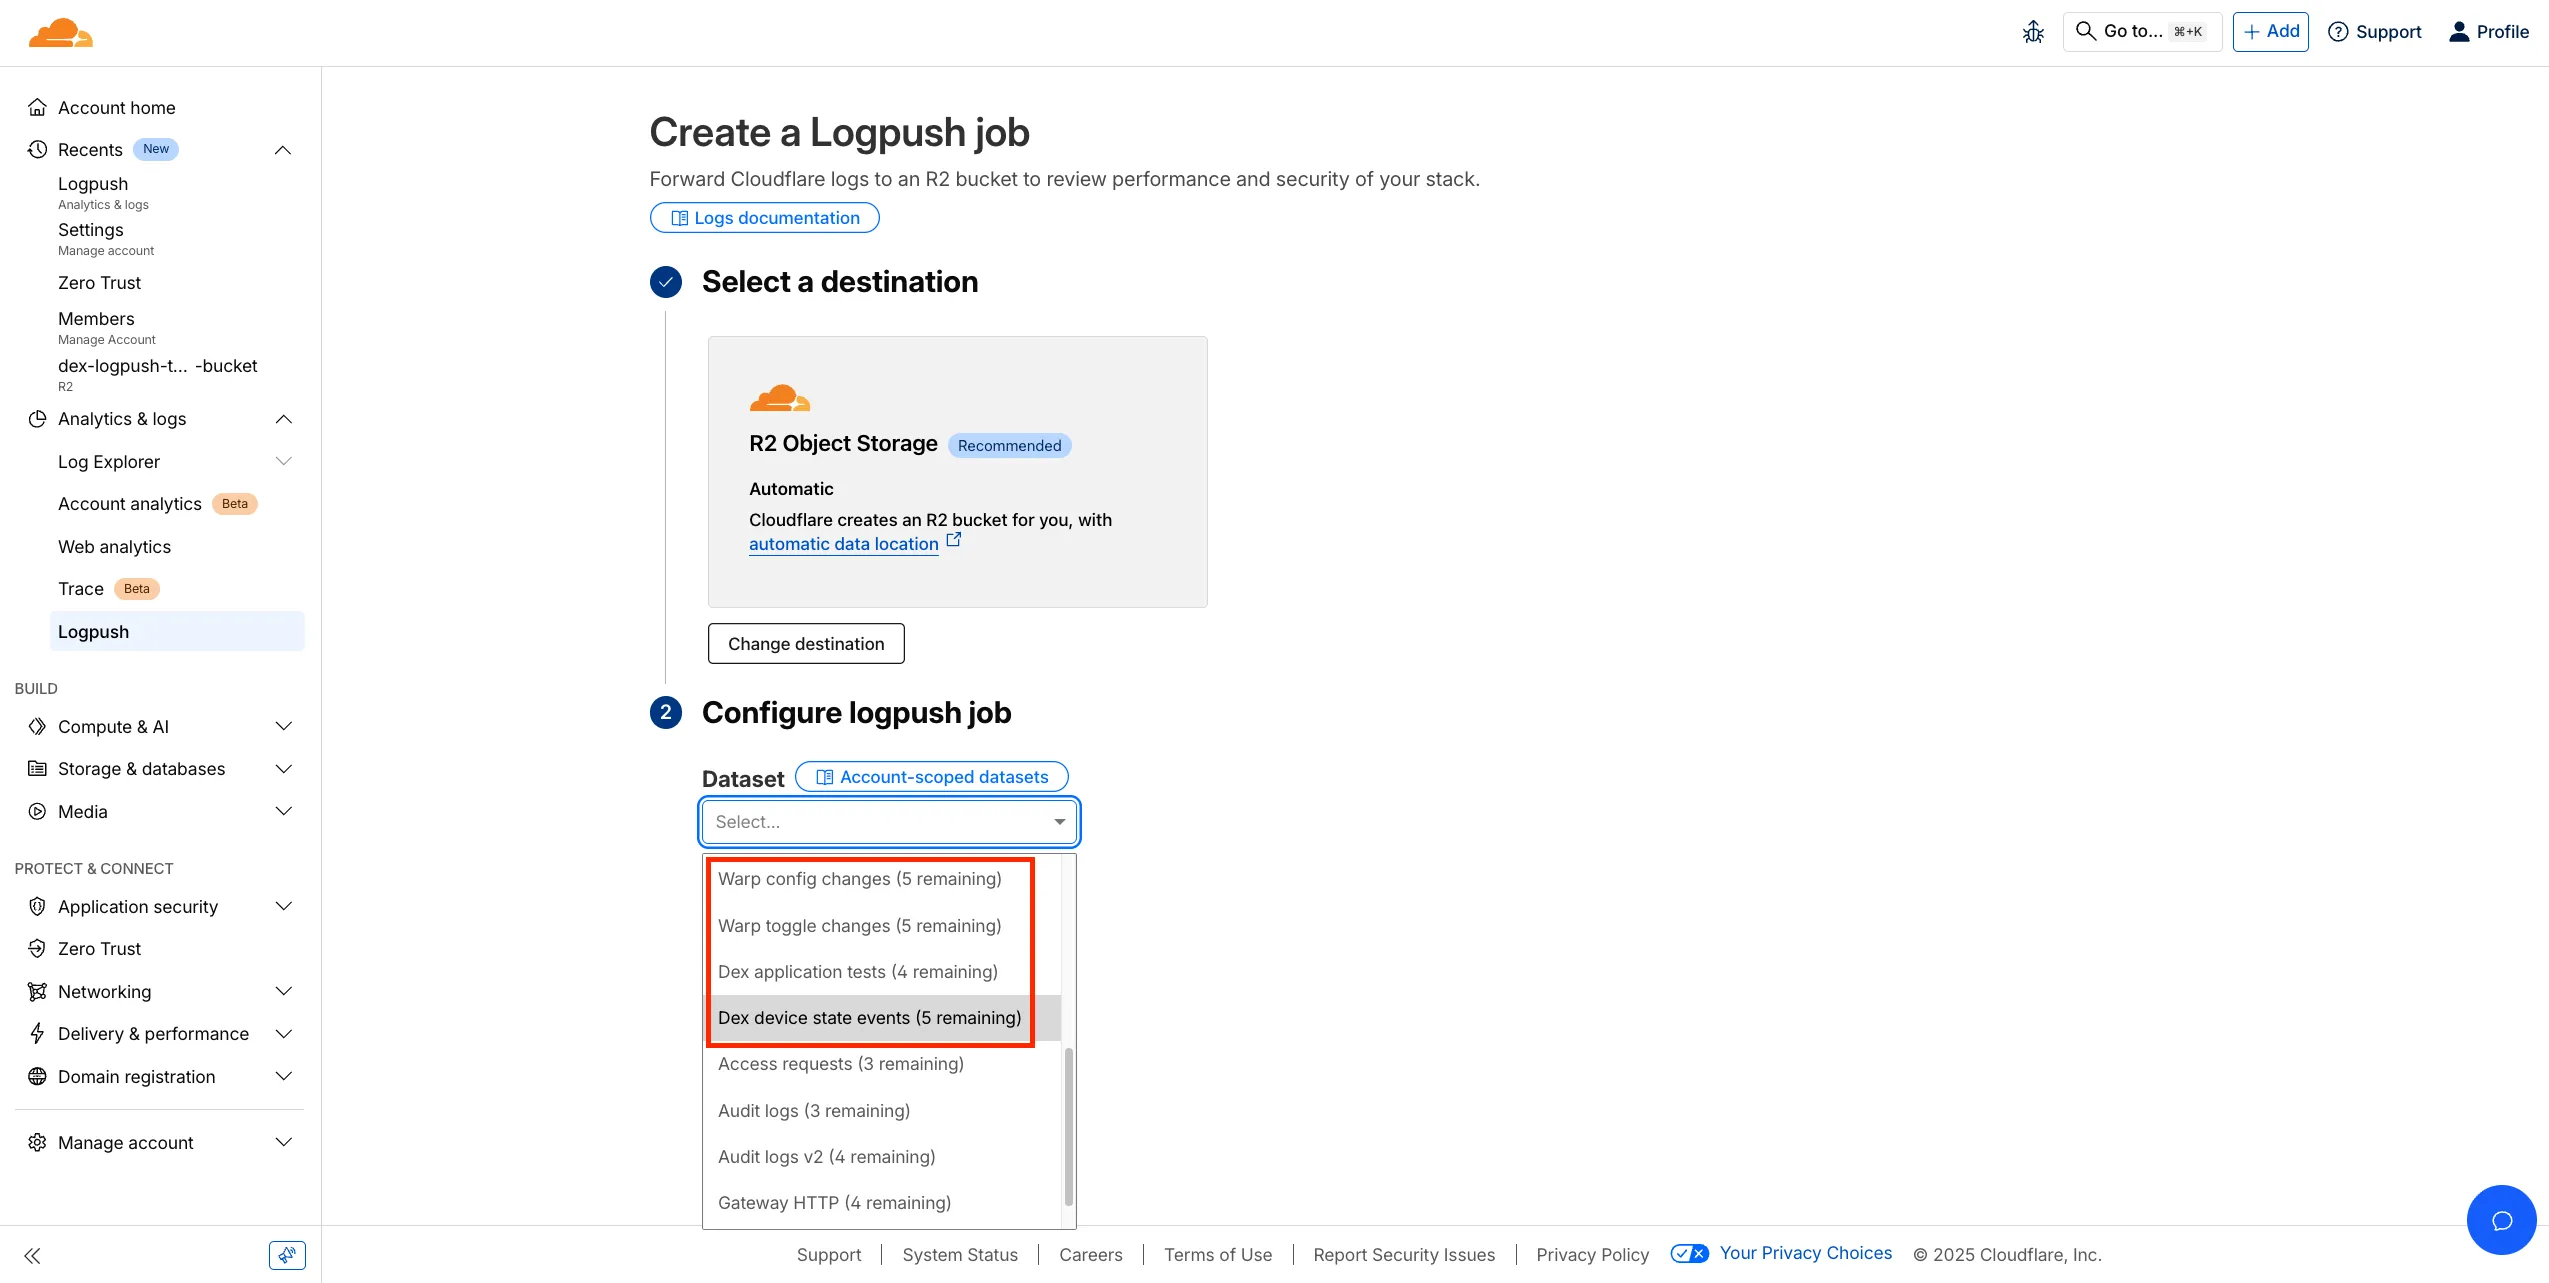
Digital Experience Monitoring (DEX) provides visibility into WARP device metrics, connectivity, and network performance across your Cloudflare SASE deployment.
We've released four new WARP and DEX device data sets that can be exported via Cloudflare Logpush. These Logpush data sets can be exported to R2, a cloud bucket, or a SIEM to build a customized logging and analytics experience.
To create a new DEX or WARP Logpush job, customers can go to the account level of the Cloudflare dashboard > Analytics & Logs > Logpush to get started.
You can now perform more powerful queries directly in Workers Analytics Engine ↗ with a major expansion of our SQL function library.
Workers Analytics Engine allows you to ingest and store high-cardinality data at scale (such as custom analytics) and query your data through a simple SQL API.
Today, we've expanded Workers Analytics Engine's SQL capabilities with several new functions:
countIf()- count the number of rows which satisfy a provided conditionsumIf()- calculate a sum from rows which satisfy a provided conditionavgIf()- calculate an average from rows which satisfy a provided condition
New date and time functions: ↗
toYear()toMonth()toDayOfMonth()toDayOfWeek()toHour()toMinute()toSecond()toStartOfYear()toStartOfMonth()toStartOfWeek()toStartOfDay()toStartOfHour()toStartOfFifteenMinutes()toStartOfTenMinutes()toStartOfFiveMinutes()toStartOfMinute()today()toYYYYMM()
Whether you're building usage-based billing systems, customer analytics dashboards, or other custom analytics, these functions let you get the most out of your data. Get started with Workers Analytics Engine and explore all available functions in our SQL reference documentation.
We're excited to announce a quality-of-life improvement for Log Explorer users. You can now resize the custom SQL query window to accommodate longer and more complex queries.
Previously, if you were writing a long custom SQL query, the fixed-size window required excessive scrolling to view the full query. This update allows you to easily drag the bottom edge of the query window to make it taller. This means you can view your entire custom query at once, improving the efficiency and experience of writing and debugging complex queries.
To learn more and get started, refer to the Log Explorer documentation.
We’re excited to introduce Logpush Health Dashboards, giving customers real-time visibility into the status, reliability, and performance of their Logpush jobs. Health dashboards make it easier to detect delivery issues, monitor job stability, and track performance across destinations. The dashboards are divided into two sections:
-
Upload Health: See how much data was successfully uploaded, where drops occurred, and how your jobs are performing overall. This includes data completeness, success rate, and upload volume.
-
Upload Reliability – Diagnose issues impacting stability, retries, or latency, and monitor key metrics such as retry counts, upload duration, and destination availability.
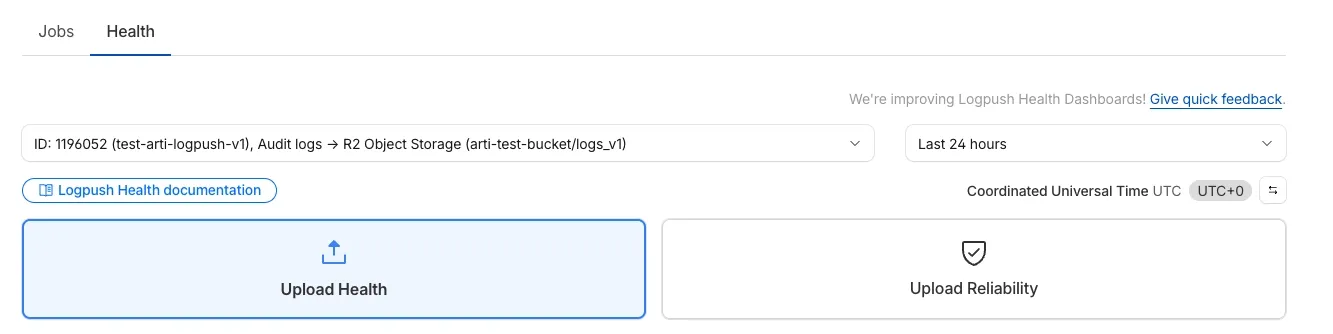
Health Dashboards can be accessed from the Logpush page in the Cloudflare dashboard at the account or zone level, under the Health tab. For more details, refer to our Logpush Health Dashboards documentation, which includes a comprehensive troubleshooting guide to help interpret and resolve common issues.
-
Permissions for managing Logpush jobs related to Zero Trust datasets (Access, Gateway, and DEX) have been updated to improve data security and enforce appropriate access controls.
To view, create, update, or delete Logpush jobs for Zero Trust datasets, users must now have both of the following permissions:
- Logs Edit
- Zero Trust: PII Read