Main dashboard
The following sections are a guide on the different sections of the main Network Analytics dashboard.
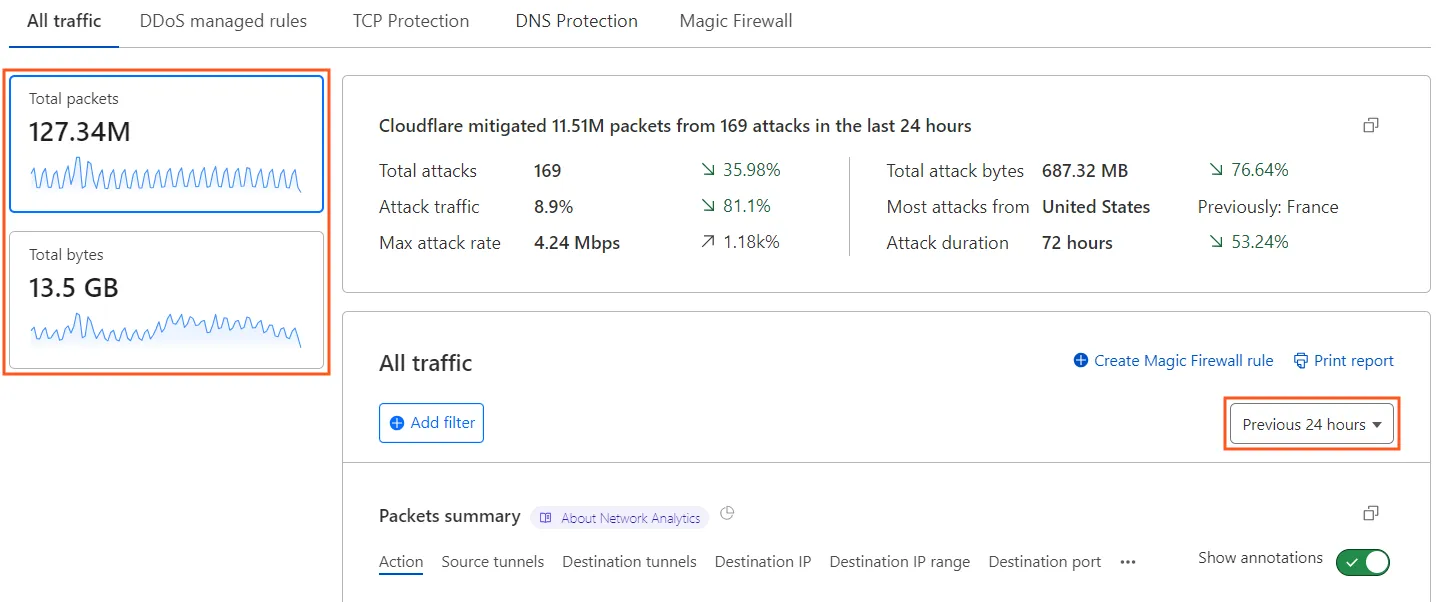
The All traffic tab displays global information about layer 3/4 traffic, DNS traffic, and DDoS attacks. The dashboard has additional tabs with specific information (and specific filters) for different mitigation systems.
The following table contains a summary of what is shown in each tab:
| Tab name | For Magic Transit users | For Spectrum users |
|---|---|---|
| All traffic | Traffic dropped by DDoS managed rules, Advanced TCP Protection, Advanced DNS Protection, and Cloudflare Network Firewall, and traffic passed to the origin server. | Traffic dropped and passed by DDoS managed rules. |
| DDoS managed rules | Traffic dropped and passed by DDoS managed rules. | Traffic dropped and passed by DDoS managed rules. |
| TCP Protection | Traffic dropped and passed by the Advanced TCP Protection system. Does not include traffic dropped by DDoS managed rules. | N/A |
| DNS Protection | Traffic dropped and passed by the Advanced DNS Protection system. Does not include traffic dropped by DDoS managed rules. | N/A |
| Cloudflare Network Firewall | Traffic dropped by Cloudflare Network Firewall and traffic passed to the origin server. Does not include traffic dropped by DDoS managed rules, Advanced TCP Protection, or Advanced DNS Protection. | N/A |
Use these tabs to better understand the decisions made by each mitigation system, and which rules are being applied to mitigate attacks.
The side panels in the Network Analytics page provide a summary of activity over the period selected in the time frame drop-down list.
Note: Labels in this image may reflect a previous product name.
Selecting one of the metrics in the sidebar will define the base unit (packets or bits/bytes) for the data displayed in the dashboard.
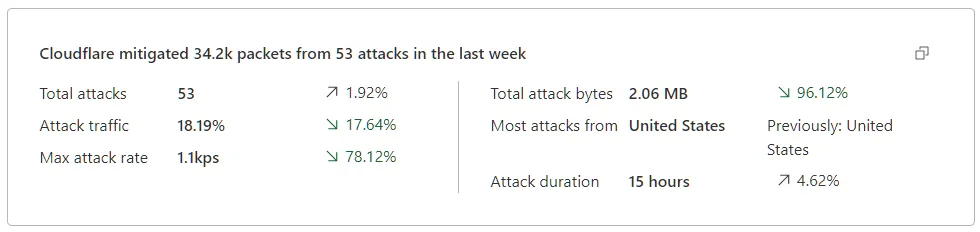
The executive summary provides top insights and trends about DDoS attacks targeting your network, including the amount of attacks, percentage of attacks traffic mitigated relative to your traffic, largest attack rates, total mitigated attack bytes, top source, and estimated duration of the attacks.
These insights are adaptive based on the selected time frame and the Packets or Bytes metrics selector. The insights are also accompanied by the trends relative to the selected time period, visualized as period-over-period change in percentage and indicator arrows.
The executive summary also features a one-liner summary at the top, informing you about recent and ongoing attacks.
The total number of attacks is based on unique attack IDs of mitigations issued by the Network-layer DDoS Attack Protection managed ruleset.
Since the mitigation system may generate several mitigation rules (and therefore several attack IDs) for a single attack, the actual number of attacks may seem higher in some cases.
To obtain the metadata of recently mitigated DDoS attacks, query the dosdAttackAnalyticsGroups GraphQL node.
In the main dashboard card you can apply filters to the displayed data.
You can filter by the following parameters:
- Mitigation action taken by Cloudflare
- Mitigation system that performed the action
- Source IP, port, ASN, tunnel
- Direction
- Destination IP, port, IP range (description or CIDR of provisioned prefixes), tunnel
- Source Cloudflare data center and data center country of where the traffic was observed
- Packet size
- TCP flag
- TTL
Note that the IP Range filter currently has a limitation that only supports filtering /24 IPv4 Ranges and /64 IPv6 Ranges.
Dashboard tabs for specific mitigation systems (DDoS managed rules, Advanced TCP Protection, or Cloudflare Network Firewall) may have additional filter parameters.
The available values in the Direction filter have the following meaning, from the point of view of a specific customer's network:
- Ingress: Incoming traffic from the public Internet (ingress) to the customer's network via Cloudflare's network (for example, through Magic Transit);
- Egress: Outgoing traffic leaving the customer's network through Cloudflare's network to the public Internet (for example, through Magic Transit deployed with the egress option);
- Lateral: Traffic that stayed within the customer's network, routed through Cloudflare's network (for example, traffic between customer office branches or data centers routed through Cloudflare WAN).
Displays a plot of the traffic (in terms of bits or packets) in the selected time range according to the values of a given dimension. By default, Network Analytics displays data broken down by Action.
You can choose one of the following dimensions:
- Action
- Destination IP
- Destination IP range
- Destination port
- Destination tunnels
- Mitigation system
- Source ASN
- Data center country
- Source data center
- Source IP
- Source port
- Source tunnels
- Packet size
- Protocol
- TCP flag
Dashboard tabs for specific mitigation systems (DDoS managed rules, Advanced TCP Protection, or Cloudflare Network Firewall) may have additional dimensions.
The Mitigation System Distribution card displays the amount of traffic (in terms of packets or bits) that was mitigated by each mitigation system.
The Network Analytics Packet sample log shows up to 100 log events — including both allowed and dropped packets — in the currently selected time range, paginated with 10 results per page per time range view (the GraphQL Analytics API does not have this limitation).
Expand each row to display event details, including the full packet headers and metadata.
Dashboard tabs for specific mitigation systems (DDoS managed rules, Advanced TCP Protection, or Cloudflare Network Firewall) may have additional fields in the expanded event details.
Displays the top source Cloudflare data centers ↗ where the displayed traffic was ingested. The same card can also display the country associated with these top source data centers.
To switch between Data center country and Source data center information, use the dropdown in the card.
The different panels in Top insights display the top items in each dimension. To filter by a given value or exclude a value from displayed data, hover the value stats and select Filter or Exclude.
To set the number of items to display for each dimension, open the drop-down list associated with the view and select the desired number of items.
The TCP Flag panel displays the TCP flags set for all the traffic currently displayed in the dashboard, including both allowed and mitigated traffic.