Graylog
This tutorial explains how to analyze Cloudflare Logs ↗ using Graylog ↗.
If you haven't used Cloudflare Logs before, visit our Logs documentation for more details. Contact your Cloudflare Customer Account Team to enable logs for your account.
Before sending your Cloudflare log data to Graylog, make sure that you:
- Have an existing Graylog installation. Both single-node and cluster configurations are supported
- Have a Cloudflare Enterprise account with Cloudflare Logs enabled
- Configure Logpush
Before getting Cloudflare logs into Graylog:
- Configure Cloudflare Logpush to push logs with all desired fields to an AWS S3 bucket of your choice.
- Download the latest Graylog Integration for Cloudflare ↗.
- Decompress the zip file.
Once decompressed, the integration package includes:
- graylog-s3-lambda.jar
- content-packs/cloudflare/cloudflare-logpush-content-pack.json
- content-packs/cloudflare/threat-lookup.csv
- Navigate to the Lambda service page in the AWS web console.
- Create a new Lambda function and specify a function name of your choice and the Java-8 runtime.
- Create or specify an execution role with the following permissions. You can also further restrict the resource permissions as desired for your specific set-up.
{ "Version": "2012-10-17", "Statement": [ { "Sid": "Policy", "Effect": "Allow", "Action": [ "logs:CreateLogGroup" "s3:GetObject", "logs:CreateLogStream", "logs:PutLogEvents" ], "Resource": [ "arn:aws:logs:your-region:your-account-number:*", "arn:aws:s3:your-region::cloudflare-bucket-name/*" ] } ]}Note: If your Graylog cluster is running in a VPC, you may need to add the AWSLambdaVPCAccessExecutionRole managed role to allow the Lambda function to route traffic to the VPC.
-
Once you've created the Lambda function, upload the function code graylog-s3-lambda.jar downloaded in Task 1. Specify the following method for the Handler: org.graylog.integrations.s3.GraylogS3Function::handleRequest.
-
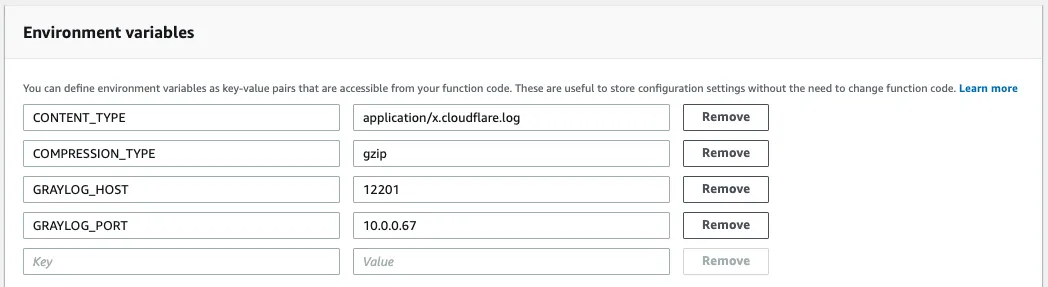
Specify at least the following required environment variables to configure the Lambda function for your Graylog cluster:
-
CONTENT_TYPE (required) - application/x.cloudflare.log value to indicate that the Lambda function will process Cloudflare logs.
-
COMPRESSION_TYPE (required ) - gzip since Cloudflare logs are gzip compressed.
-
GRAYLOG_HOST (required) - hostname or IP address of the Graylog host or cluster load balancer.
-
GRAYLOG_PORT (optional - defaults to 12201) - The Graylog service port.
-
CONNECT_TIMEOUT (optional - defaults to 10000) - The number of milliseconds to wait for the connection to be established.
-
LOG_LEVEL (optional - defaults to INFO) - The level of detail to include in the CloudWatch logs generated from the Lambda function. Supported values are OFF, ERROR, WARN, INFO, DEBUG, TRACE, and ALL. Increase the logging level to help with troubleshooting. See Defining Custom Log Levels in Code ↗ for more information.
-
CLOUDFLARE_LOGPUSH_MESSAGE_FIELDS (optional - defaults to all) - The fields to parse from the message. Specify as a comma-separated list of field names.
-
CLOUDFLARE_LOGPUSH_MESSAGE_SUMMARY_FIELDS (optional - defaults to ClientRequestHost, ClientRequestPath, OriginIP, ClientSrcPort, EdgeServerIP, EdgeResponseBytes) - The fields to include in the message summary that appears above the parsed fields at the top of each message in Graylog. Specify as a comma-separated list of field names.
Note: More configuration variables are available to fine-tune the function configuration in the Graylog Lambda S3 README ↗ file.
-
-
Create an AWS S3 Trigger for the Lambda function so that the function can process each Cloudflare log field that is written. Specify the same S3 bucket from Task 1 and choose the All object create events option. Any other desired file filters can be applied here.
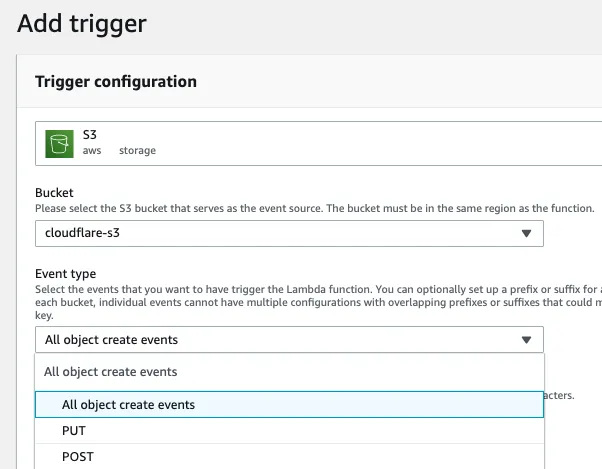
-
If your Graylog cluster is located within a VPC, you will need to configure your Lambda function to access resources in a VPC ↗. You may also need to create a VPC endpoint for the AWS S3 service ↗. This allows the Lambda function to access S3 directly when running in a VPC.
Importing the Cloudflare Logpush content pack into Graylog loads the necessary configuration to receive Cloudflare logs and installs the Cloudflare dashboards.
The following components install with the content pack:
- Cloudflare dashboards (Task 4).
- A Cloudflare GELF (TCP) input that allows Graylog to receive Cloudflare logs.
- A Cloudflare message stream ↗.
- Pipeline ↗ rules that help to process and parse Cloudflare log fields.
To import the content pack:
-
Locate the cloudflare-logpush-content-pack.json file that you downloaded and extracted in Task 1.
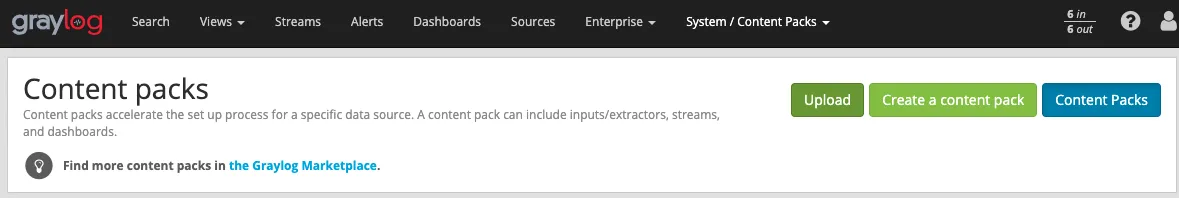
-
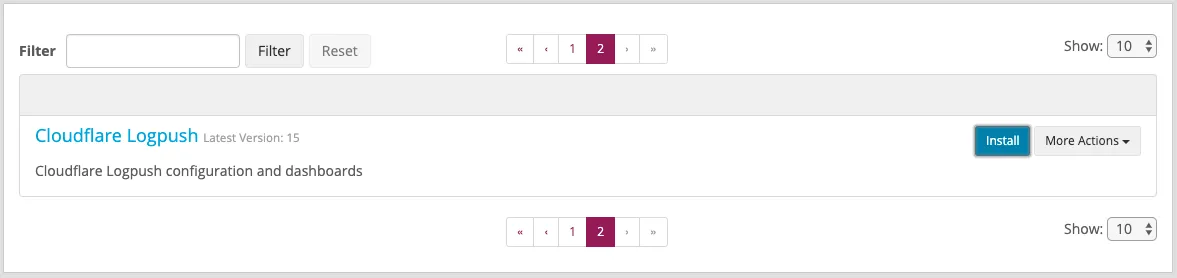
In Graylog, go to System > Content Packs and click Upload in the top right. Once uploaded, the Cloudflare Logpush content pack will appear in the list of uploaded content packs.
-
Click Install.
-
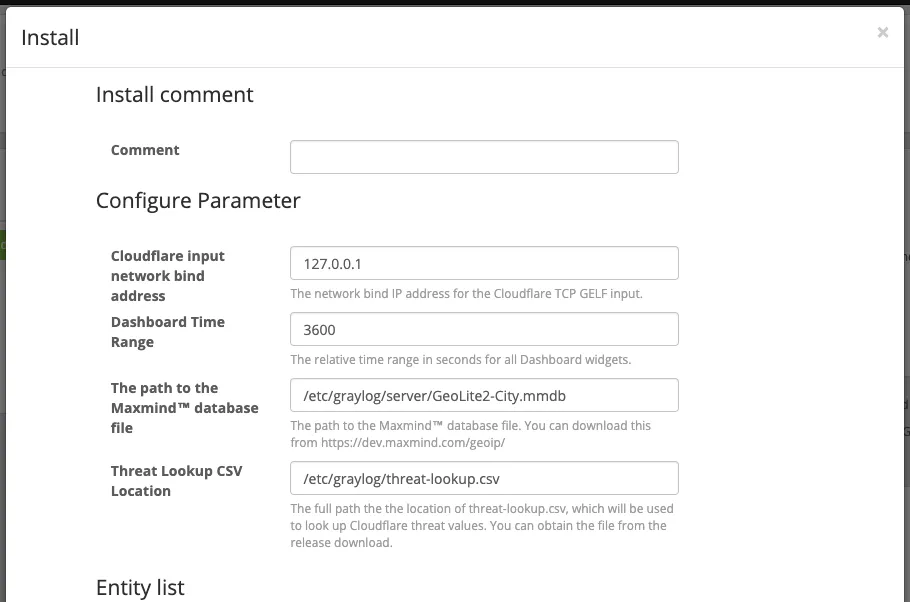
In the Install dialog, enter an optional install comment, and verify that the correct values are entered for all configuration parameters.
- A path is required for the MaxMind™️ database, available at https://dev.maxmind.com/geoip/ ↗.
- A path is also required for the Threat Lookup CSV file, extracted in Task 1.
-
Once installed, your Graylog cluster will be ready to receive Cloudflare logs from the Lambda function.
Refer to the Graylog Lambda S3 README ↗ for additional information and troubleshooting tips.
You can view your dashboard in the Graylog Cloudflare integration page ↗. The dashboards include:
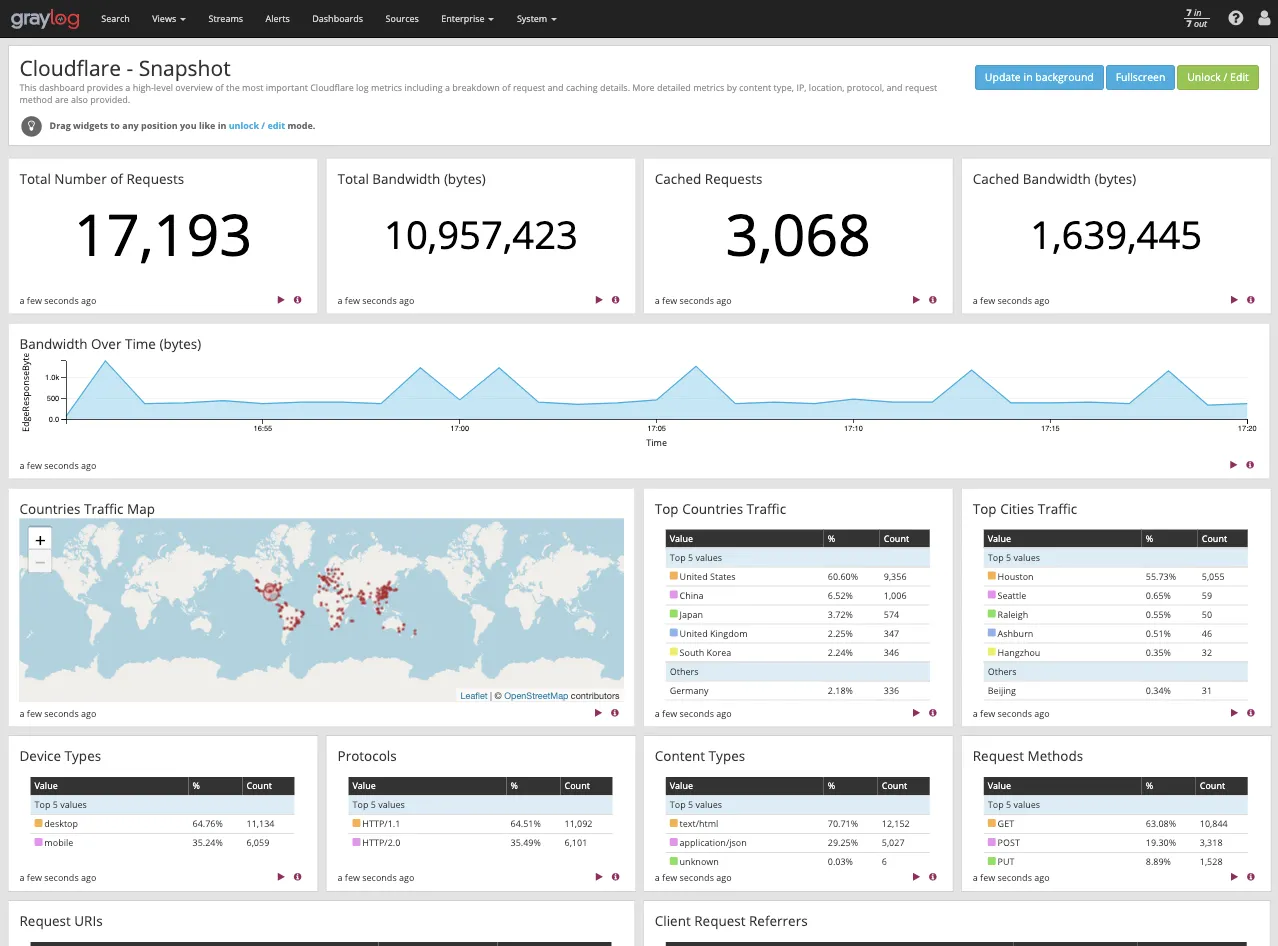
This is an at-a-glance overview of the most important metrics from your websites and applications on the Cloudflare network. You can use dashboard filters to further slice and dice the information for granular analysis of events and trends.
Use this dashboard to:
- Monitor the most important web traffic metrics of your websites and applications on the Cloudflare network
- View which countries and IPs your traffic is coming from, and analyze the breakdown between mobile and desktop traffic, protocol, methods, and content types
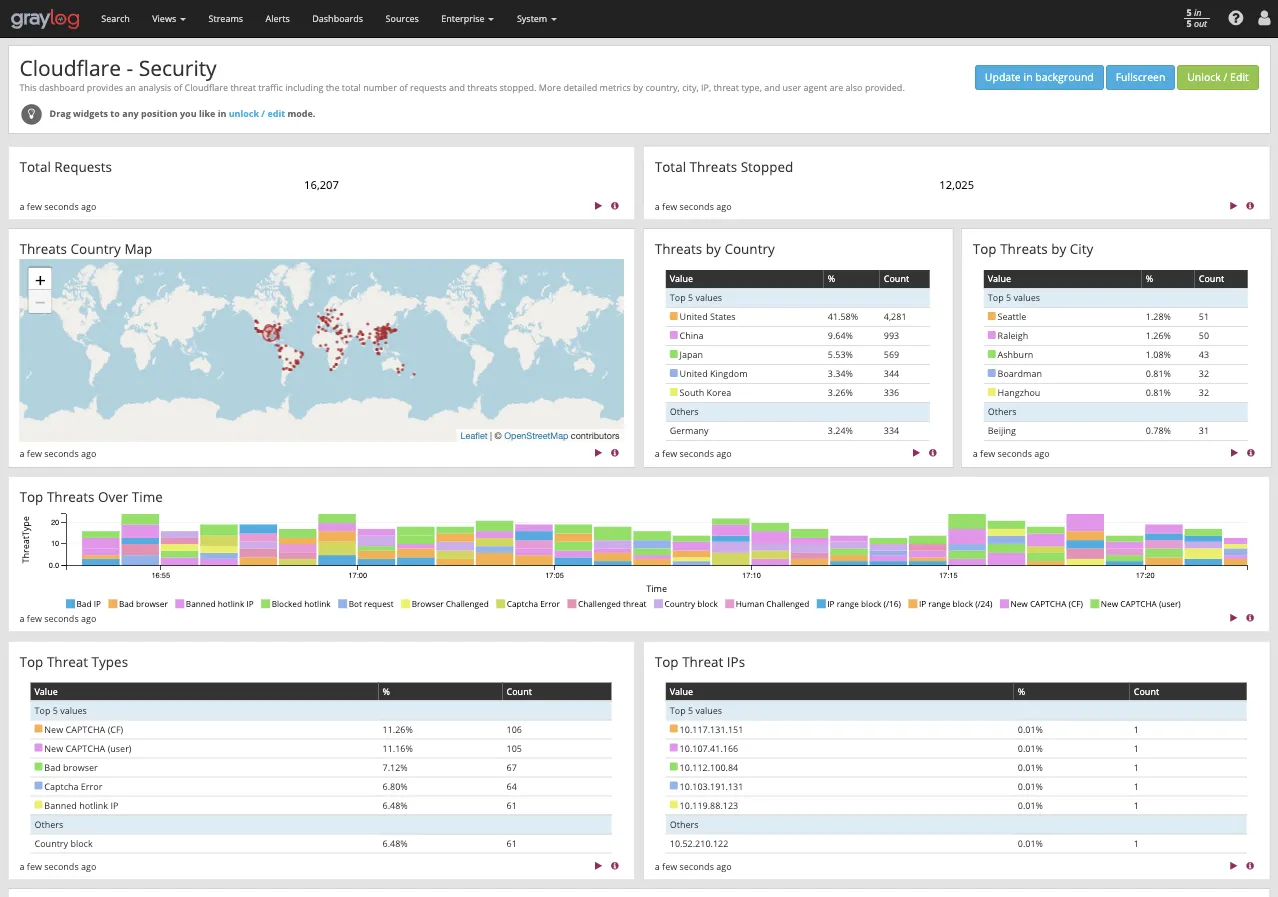
This overview provides insights into threats to your websites and applications, including number of threats stopped,threats over time, top threat countries, and more.
Use this dashboard to:
- Monitor the most important security and threat metrics for your websites and applications
- Fine-tune and configure your IP firewall
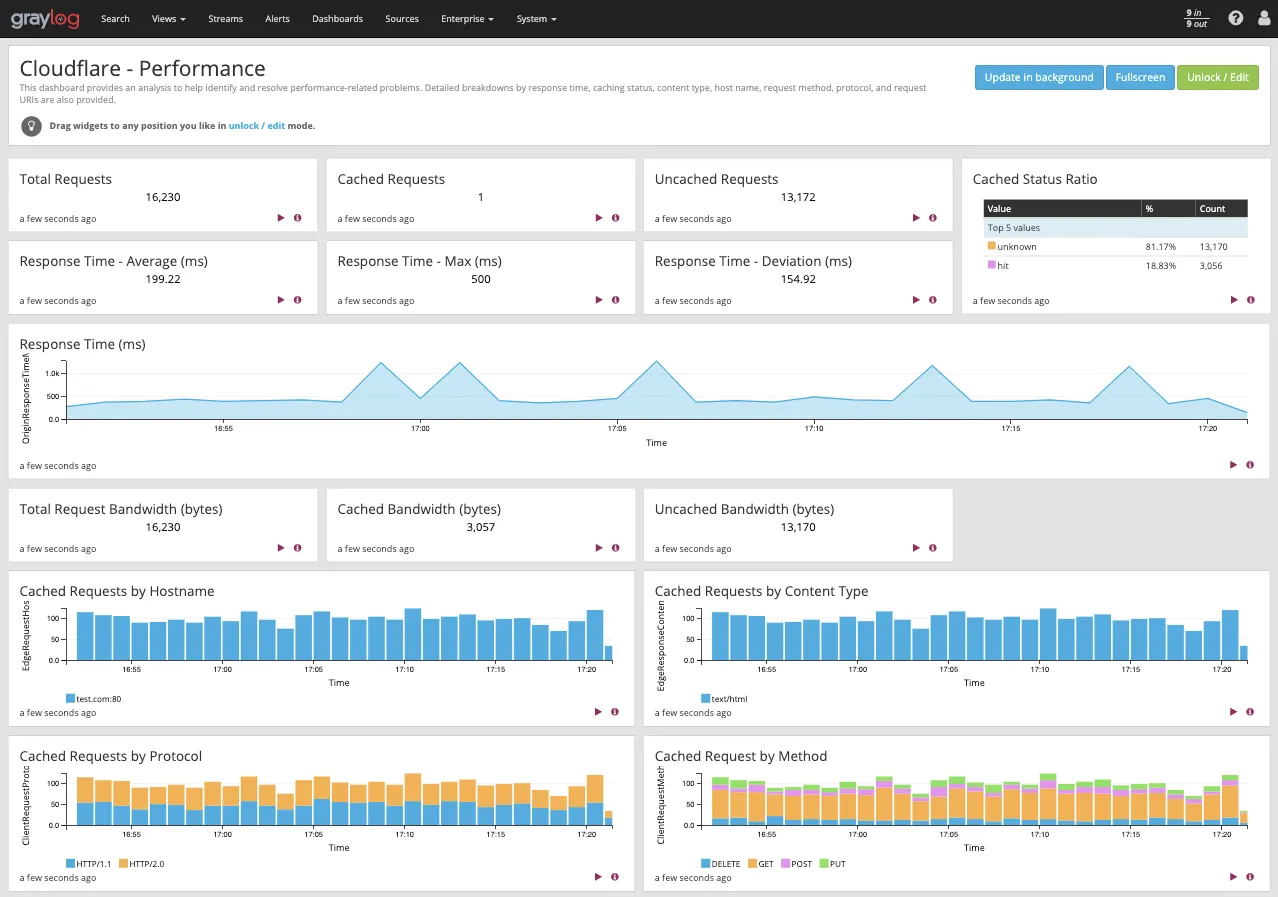
This dashboard helps to identify and address performance issues and caching misconfigurations. Metrics include total vs. cached bandwidth, saved bandwidth, total requests, cache ratio, top uncached requests, and more.
Use this dashboard to:
- Monitor caching behavior and identify misconfigurations
- Improve configuration and caching ratio
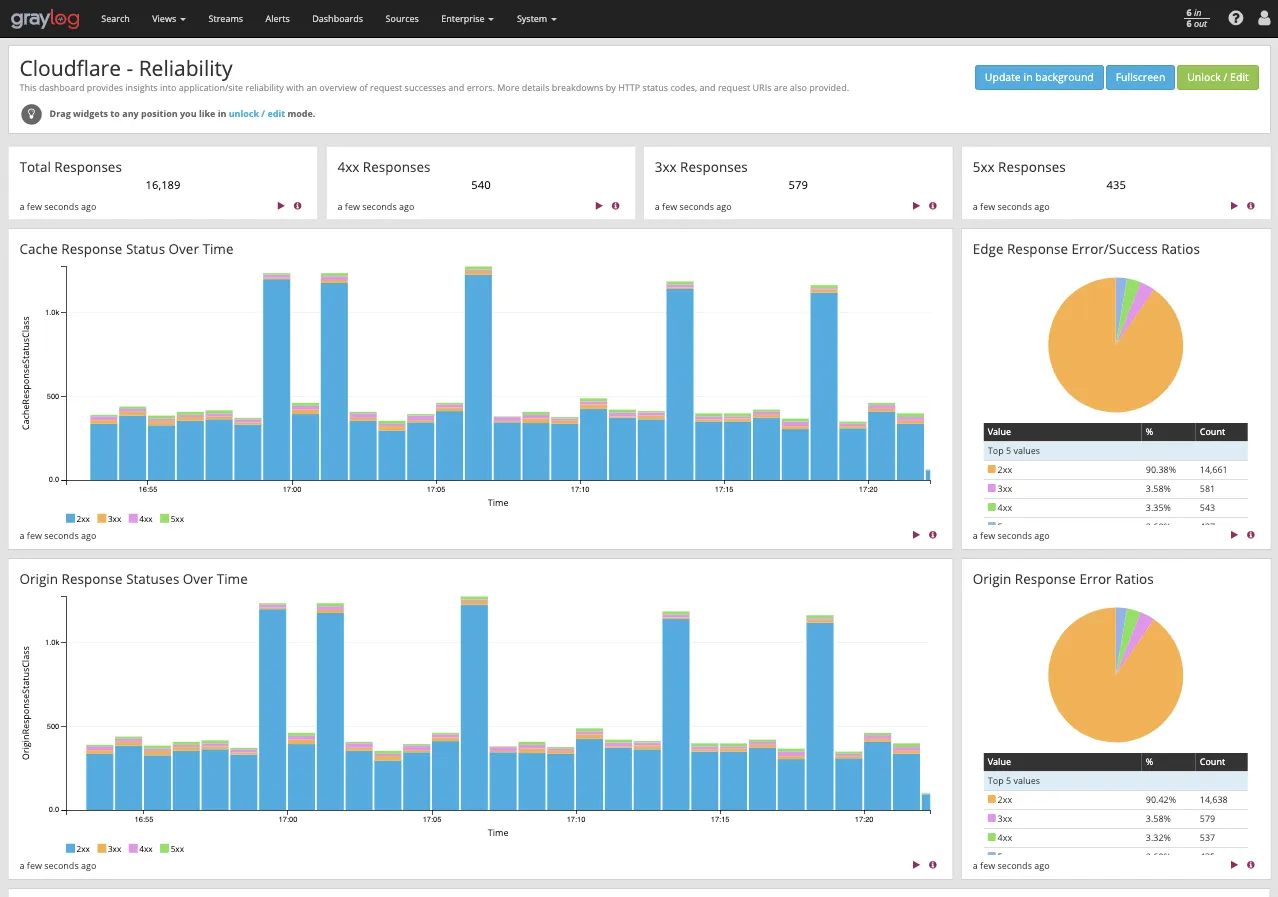
This dashboard provides insights on the availability of your websites and applications. Metrics include origin response error ratio, origin response status over time, percentage of 3xx/4xx/5xx errors over time, and more.
Use this dashboard to:
- Investigate errors on your websites and applications by viewing edge and origin response status codes
- Further analyze errors based on status codes by countries, client IPs, hostnames, and other metrics
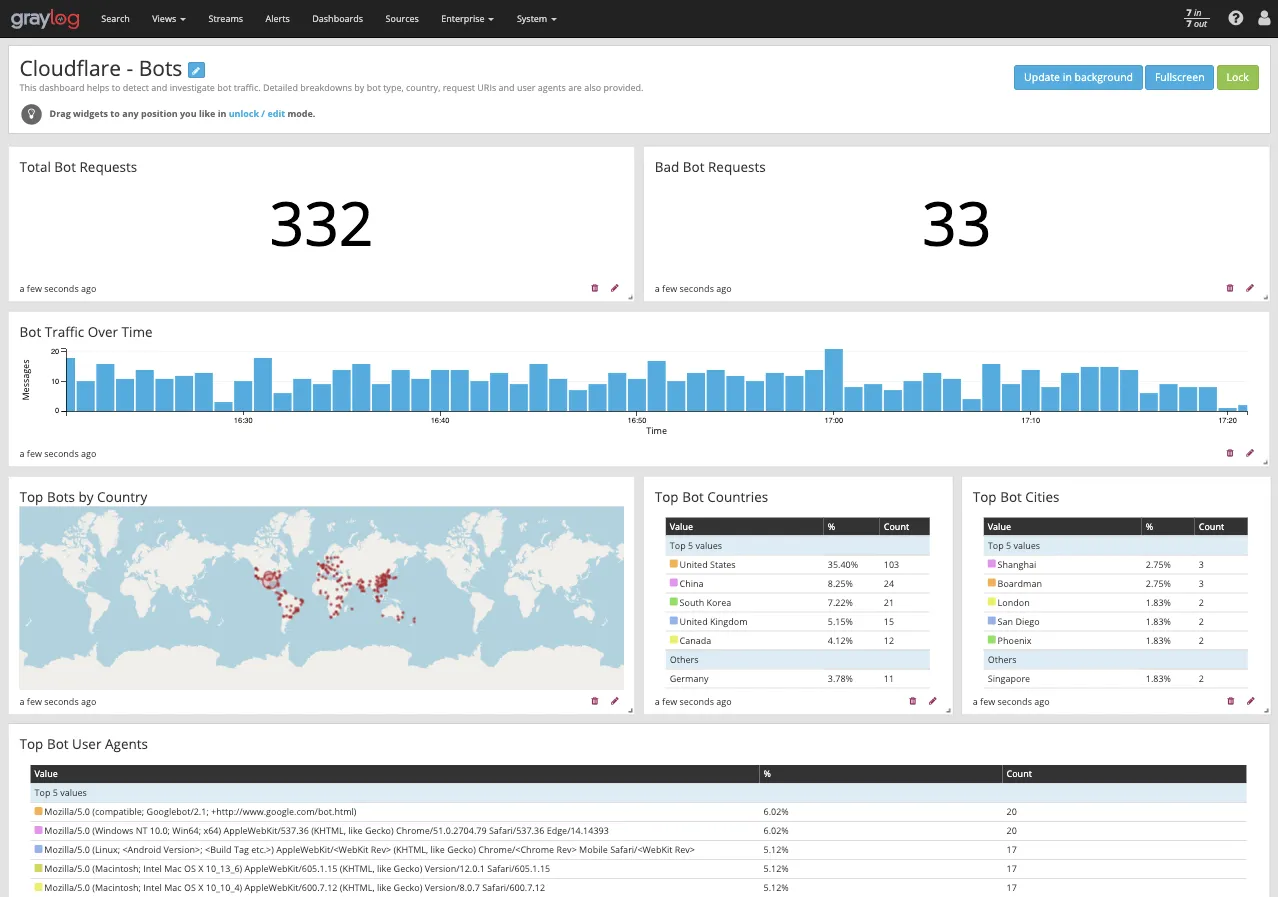
Use this dashboard to detect and mitigate bad bots so that you can prevent credential stuffing, spam registration, content scraping, click fraud, inventory hoarding, and other malicious activities.
Use this dashboard to:
- Investigate bot activity on your website and prevent content scraping, checkout fraud, spam registration, and other malicious activities.
- Use insight to tune Cloudflare to prevent bots from excessive usage and abuse across websites, applications, and API endpoints.