To perform a broad analysis of layer 3/4 traffic and DDoS attacks, use the All traffic tab.
To focus on a specific mitigation system, select one of the other available tabs. The tabs displayed in the dashboard depend on your Cloudflare services.
To toggle your view of the data, select the Total packets or Total bytes side panels.
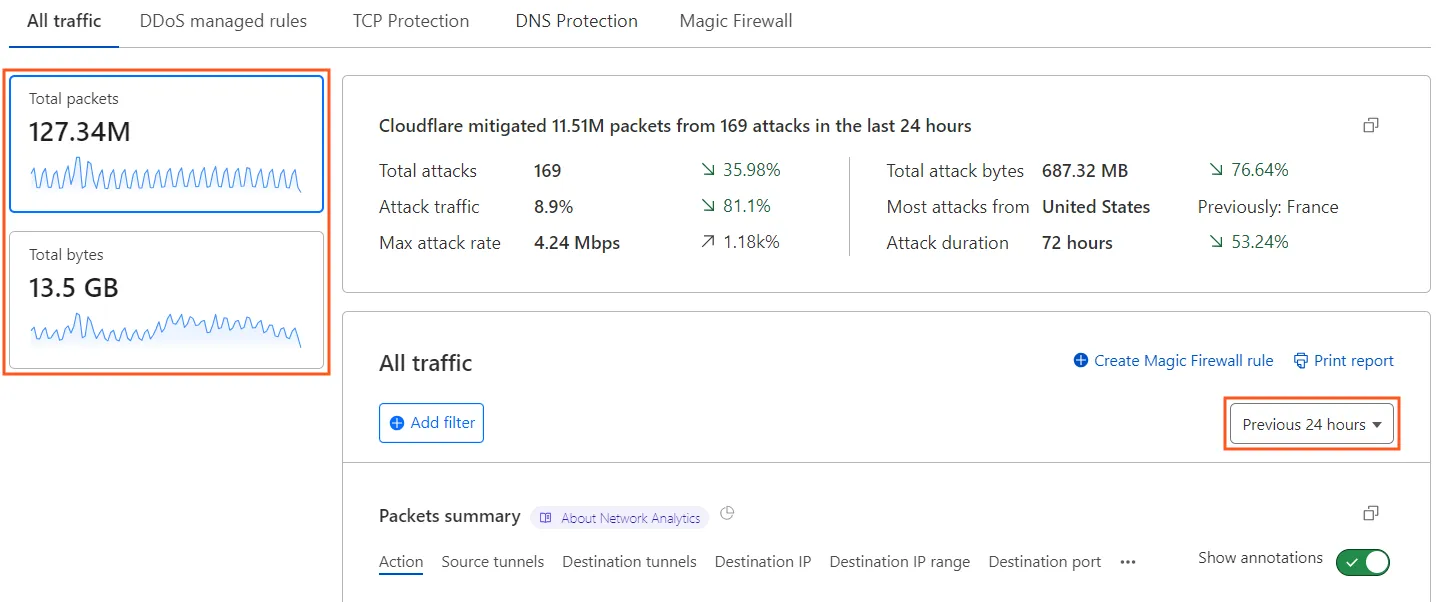
Note: Labels in this image may reflect a previous product name.
The selected metric will determine the base units (packets or bits/bytes) used in the several dashboard analytics panels.
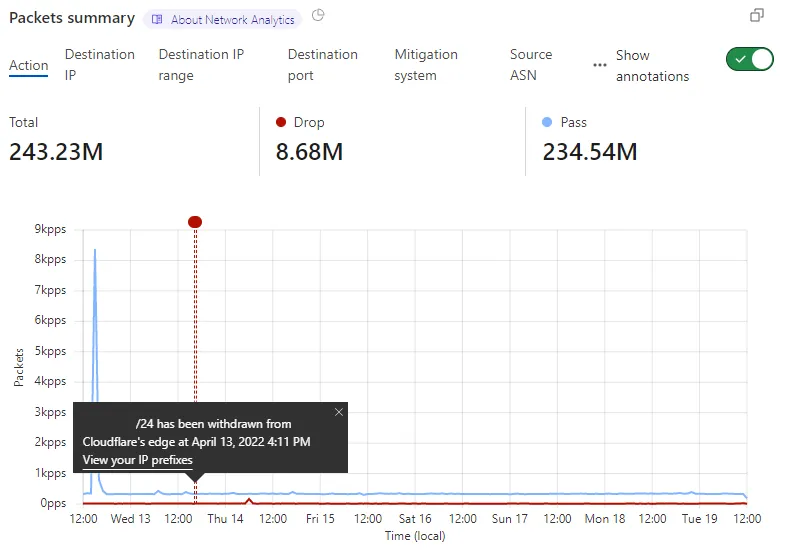
Under Packets summary or Bits summary, select one of the available dimensions to view the data along that dimension. The default dimension is Action.
You can apply multiple filters and exclusions to adjust the scope of the data displayed in Network Analytics. Filters affect all the data displayed in the dashboard.
There are two ways to filter Network Analytics data: select Add filter or select one of the stat filters.
Select Add filter to open the New filter popover. Specify a field, an operator, and a value to complete your filter expression. Select Apply to update the view.
To filter based on the type of data associated with one of the Network Analytics stats, use the Filter and Exclude buttons that display when you hover over the stat.
Select Create Network Firewall rule to create a Network Firewall rule that will block all traffic matching the selected filters in Network Analytics.
Note that some filters will not be added to the new Network Firewall rule definition. However, you can further configure the rule in Network Firewall.
Enable the Show annotations toggle to show or hide annotations for advertised/withdrawn IP prefix events in the Network Analytics view. Select each annotation to get more details.
Network DDoS managed rules and Advanced DDoS Protection systems provide a log or monitoring mode that does not drop traffic. These log and monitoring mode events are based on Verdict and Outcome/Action fields.
To filter for these traffic events:
-
In the Cloudflare dashboard, go to the Network Analytics page.
Go to Network analytics ↗ -
Go to DDoS managed rules tab.
-
Select Add filter.
- Set
Verdict equals drop. - Set
Action equals pass.
- Set
-
Select Apply.
By setting verdict to drop and outcome as pass, we are filtering for traffic that was marked as a detection (that is, verdict was drop) but was not dropped (for example, outcome was pass).