New Relic
This tutorial explains how to analyze Cloudflare metrics using the New Relic One Cloudflare Quickstart ↗.
Before sending your Cloudflare log data to New Relic, make sure that you:
- Have a Cloudflare Enterprise account with Cloudflare Logs enabled.
- Have a New Relic account.
- Configure Logpush to New Relic.
- Log in to New Relic.
- Click the Instant Observability button (top right).
- Search for Cloudflare Network Logs.
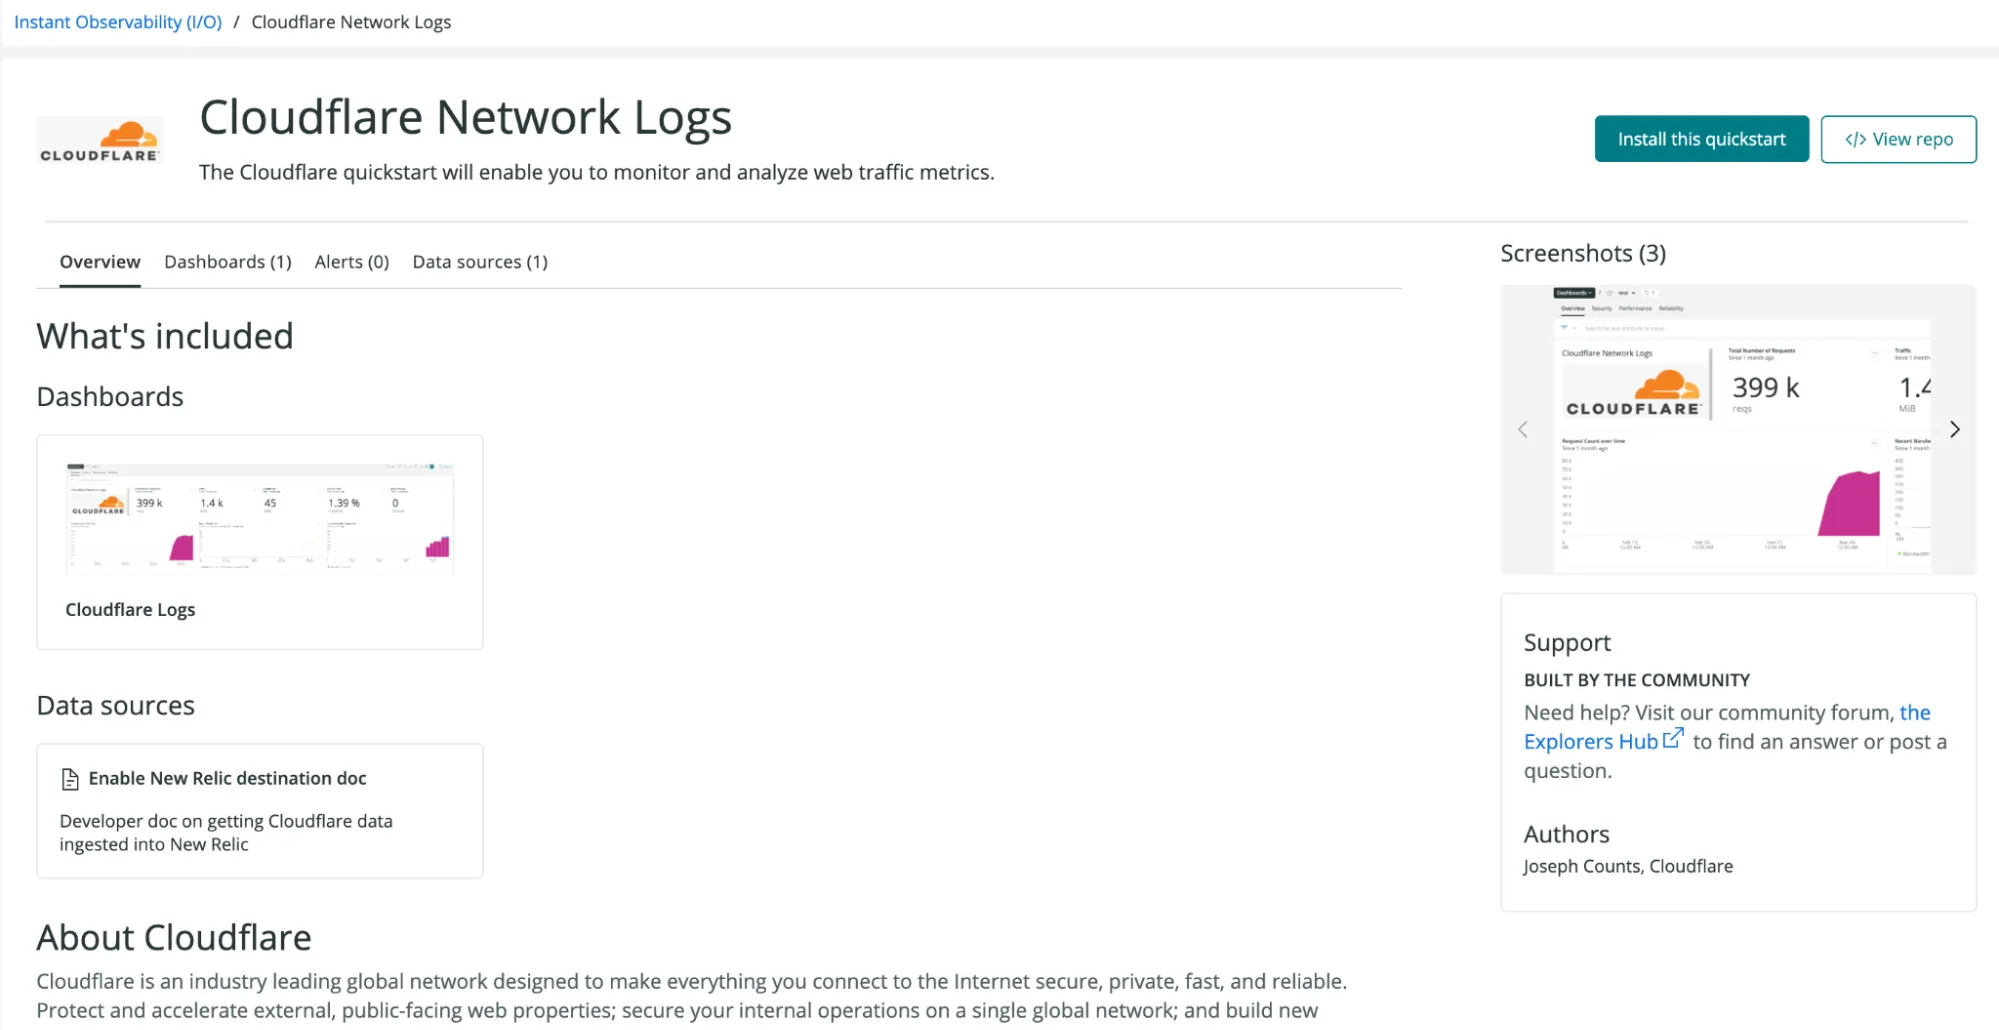
- Click Install this quickstart.
- Follow the steps to deploy.
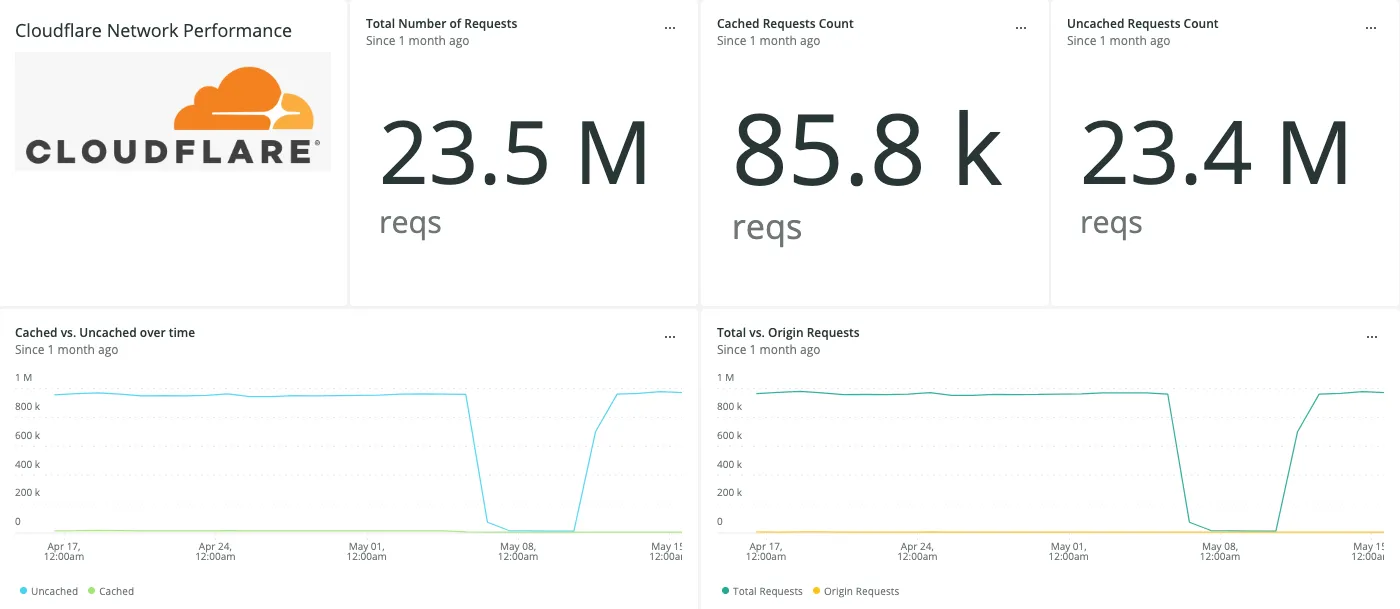
You can view your dashboards on the New Relic dashboard page. The dashboards include the following information:
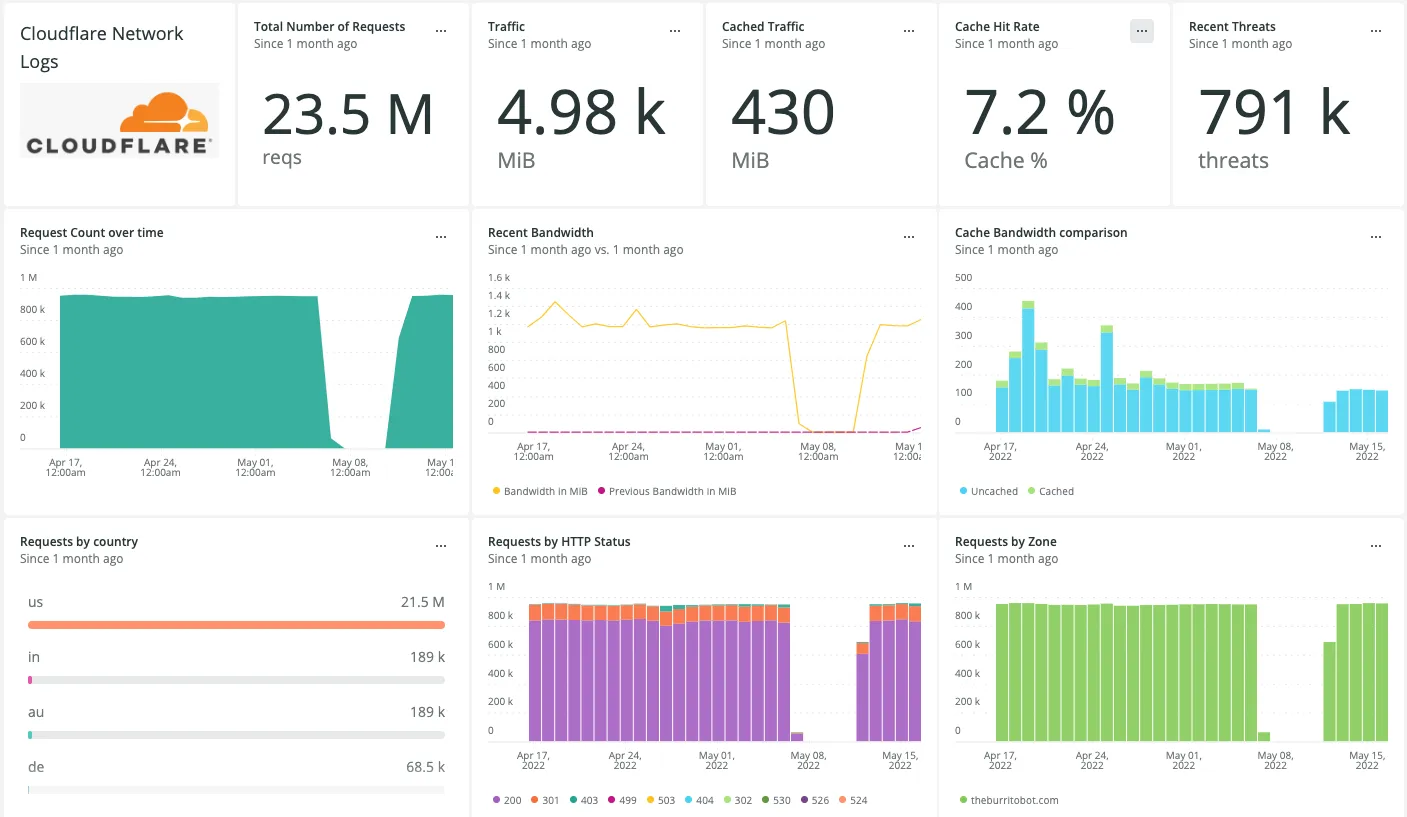
Get a quick overview of the most important metrics from your websites and applications on the Cloudflare network.
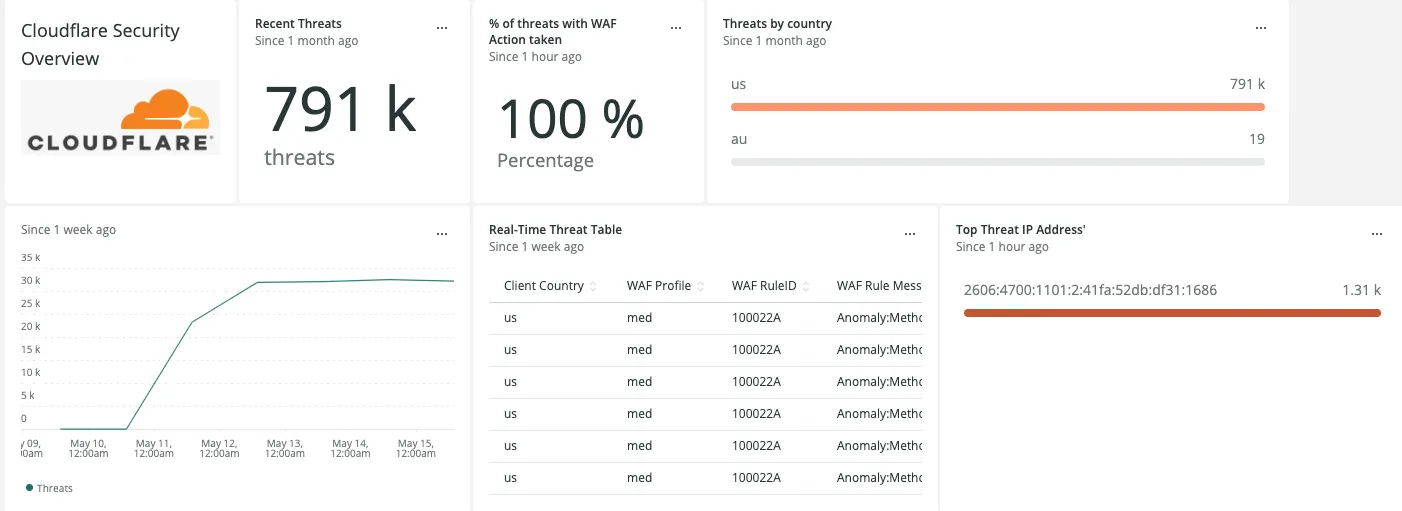
Get insights on threats to your websites and applications, including number of threats taken action on by the Web Application Firewall (WAF), threats over time, top threat countries, and more.
Identify and address performance issues and caching misconfigurations. Metrics include total requests, total versus cached requests, total versus origin requests.
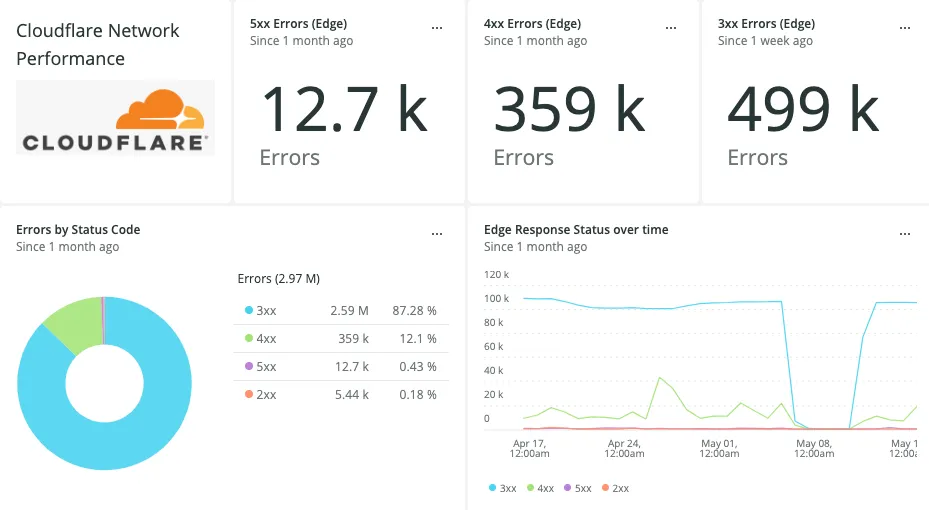
Get insights on the availability of your websites and Applications. Metrics include, edge response status over time, percentage of 3xx/4xx/5xx errors over time, and more.