Capture GraphQL queries with Chrome DevTools
Using Chrome DevTools ↗, you can capture the queries running behind the Cloudflare Dashboard analytics. In this example, we will focus on the Network Analytics dataset, but the same process can be applied to any other analytics available in your dashboard.
-
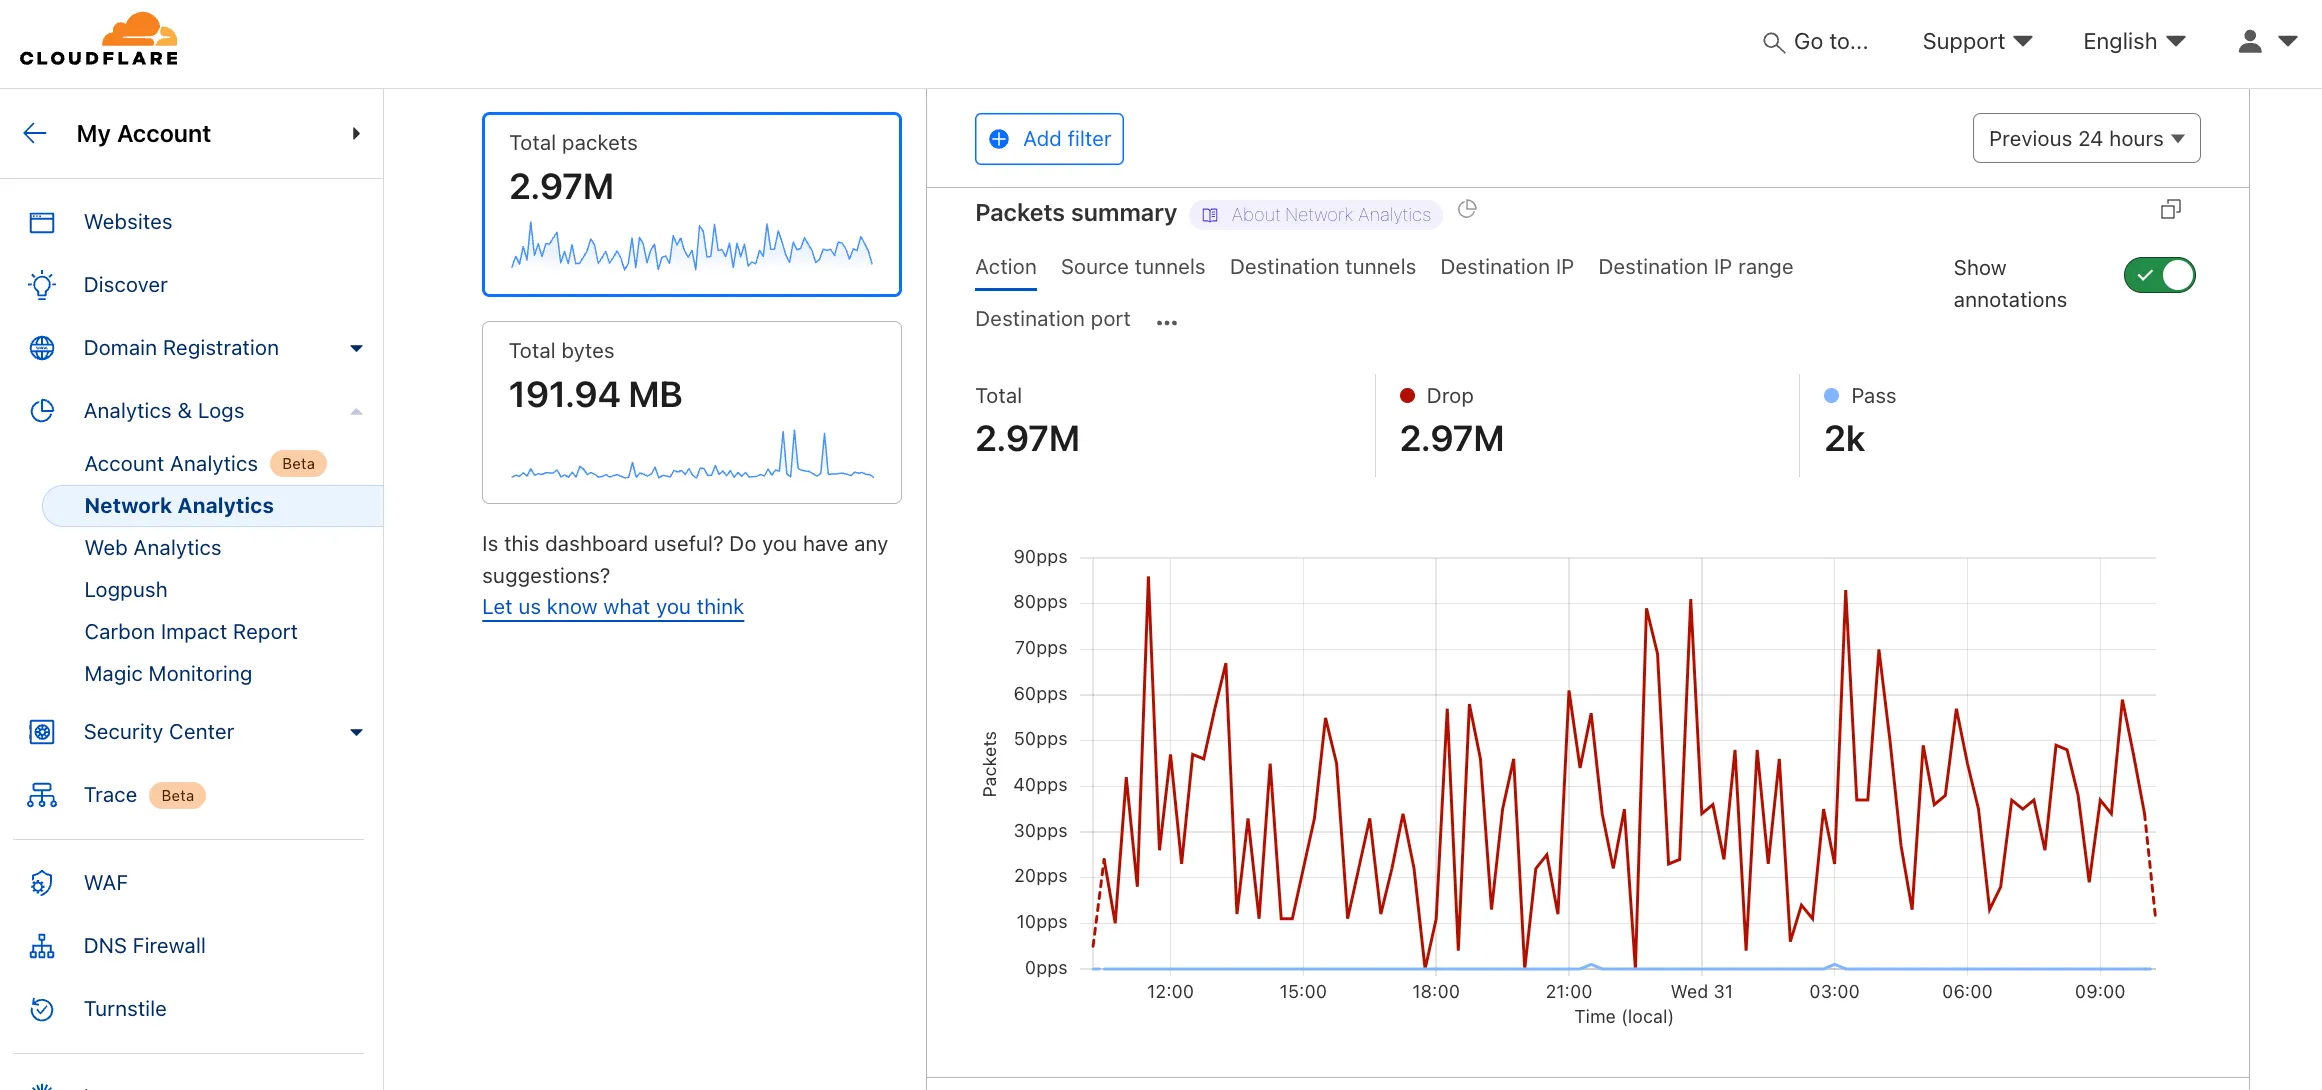
In the Cloudflare dashboard, go to the Network Analytics page or any other analytics dashboard you are interested in seeing the GraphQL queries in.
Go to Network analytics
- Open the Chrome Developer Tools ↗ and select Inspect.
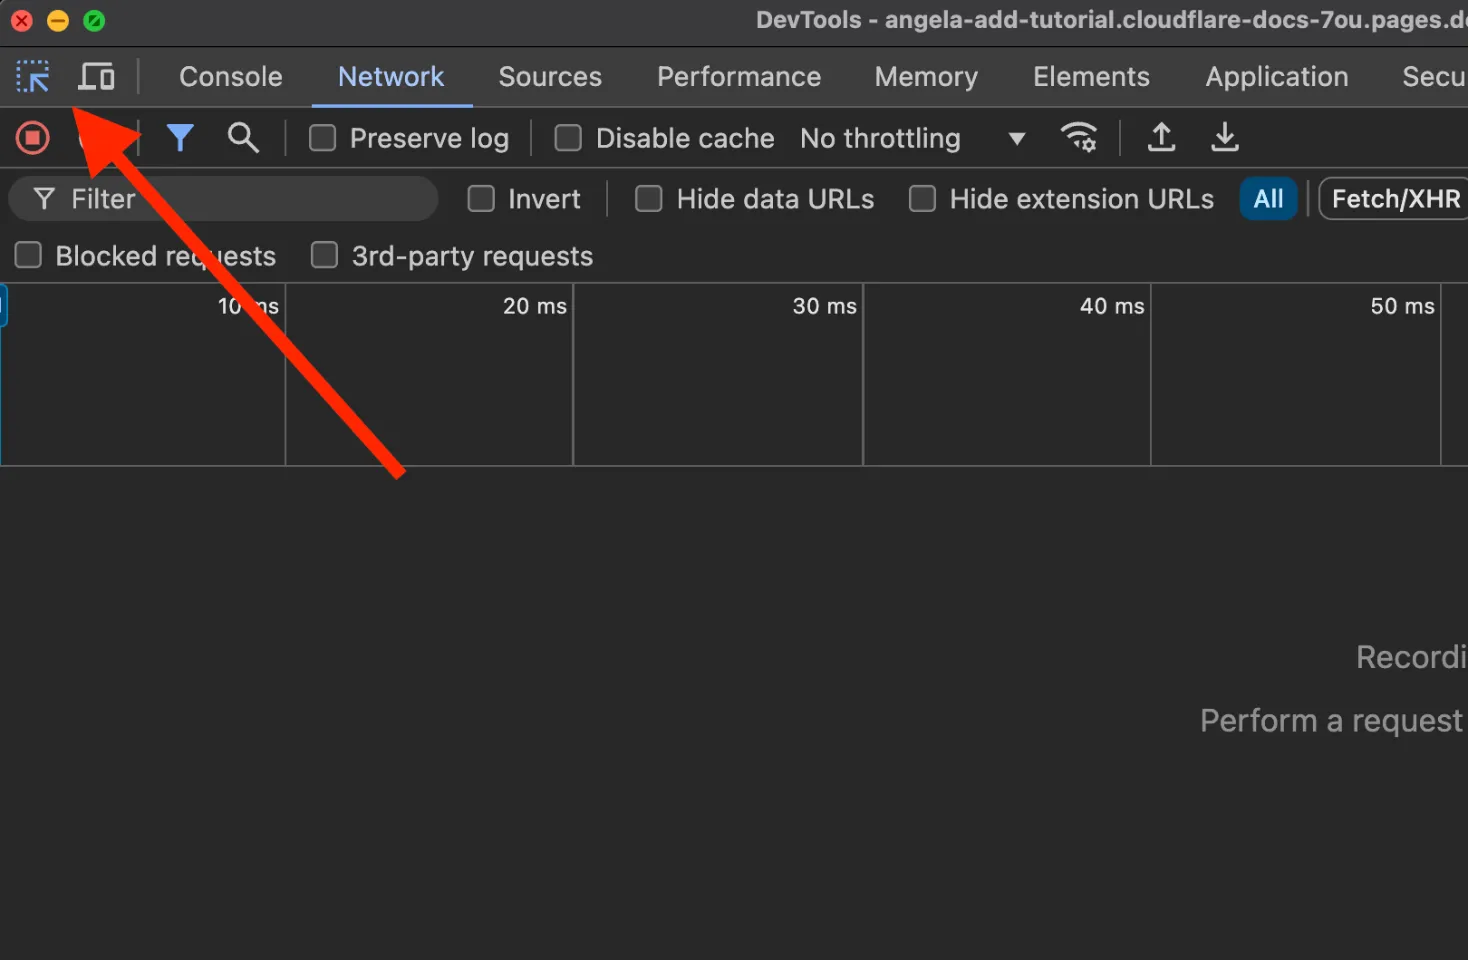
- Select the Network tab in the Developer Tools panel.
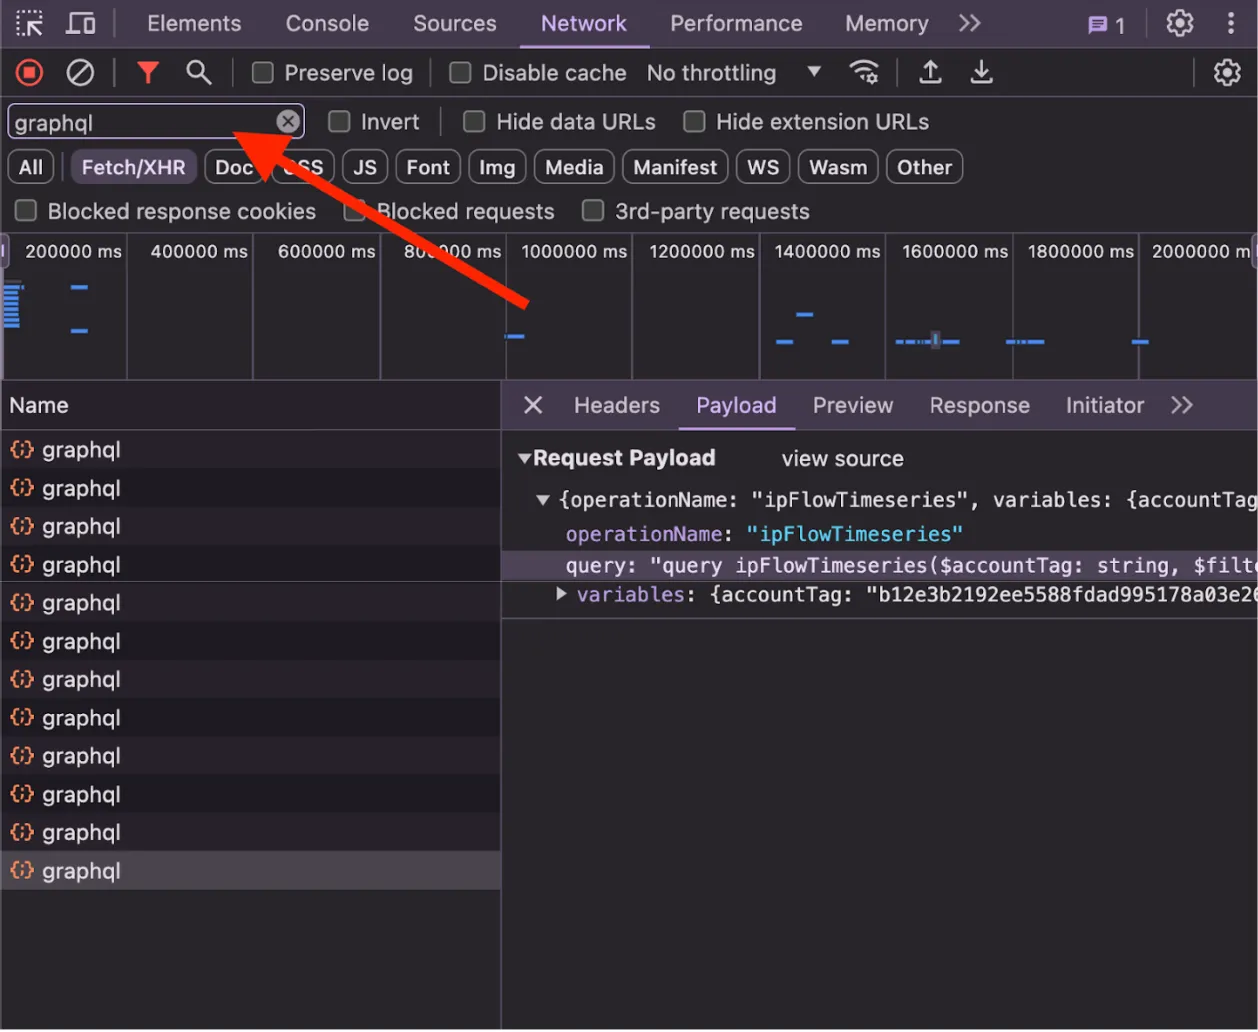
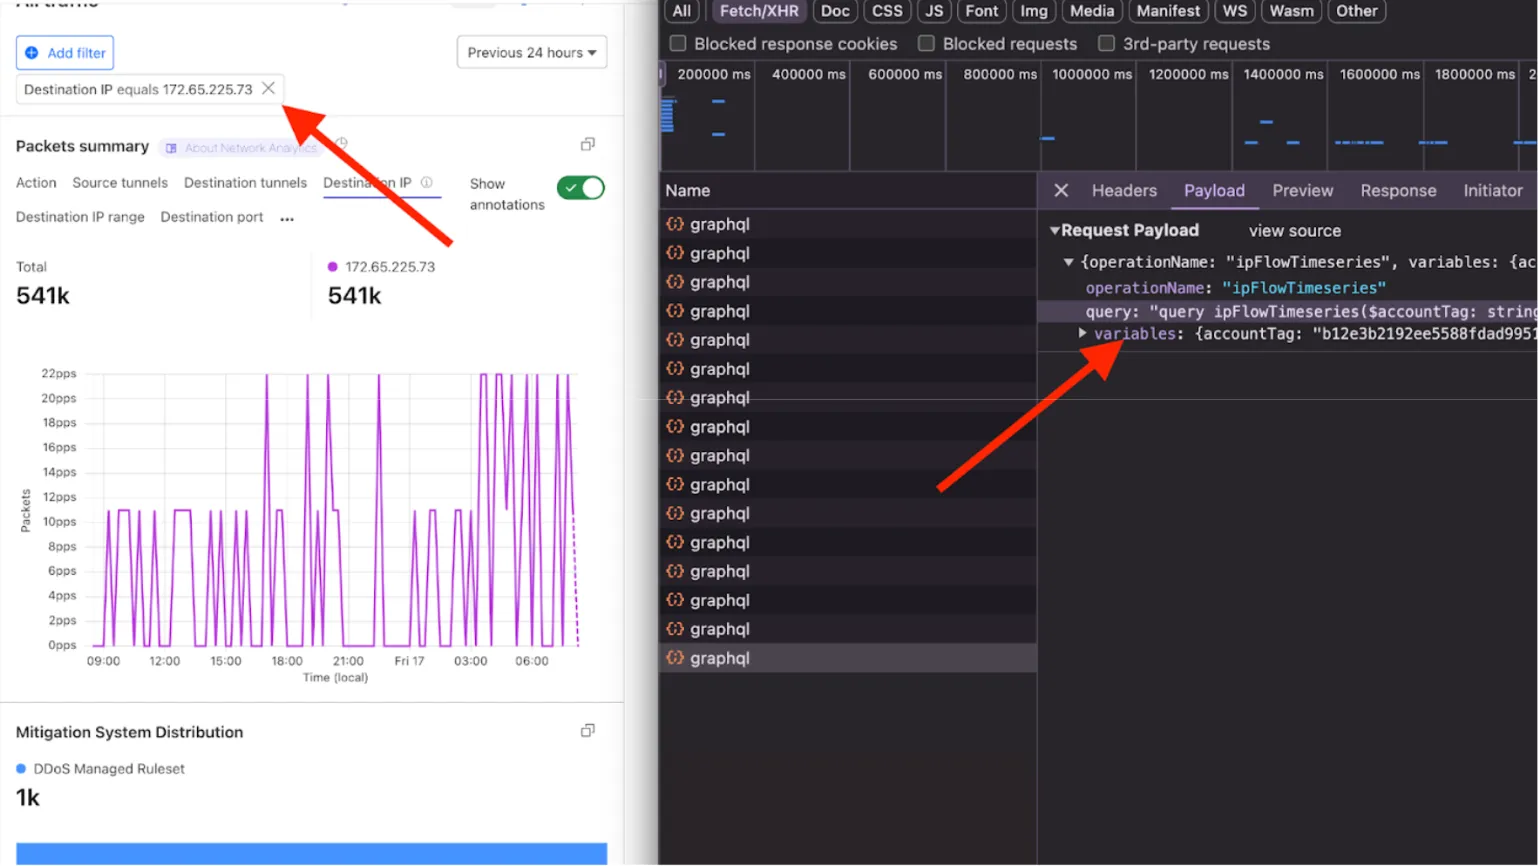
- In the filter bar, type
graphqlto filter out the GraphQL requests. If no requests appear, try reloading the page. As the page reloads, several network requests will populate the Network tab. Look for requests that containgraphqlin the name.
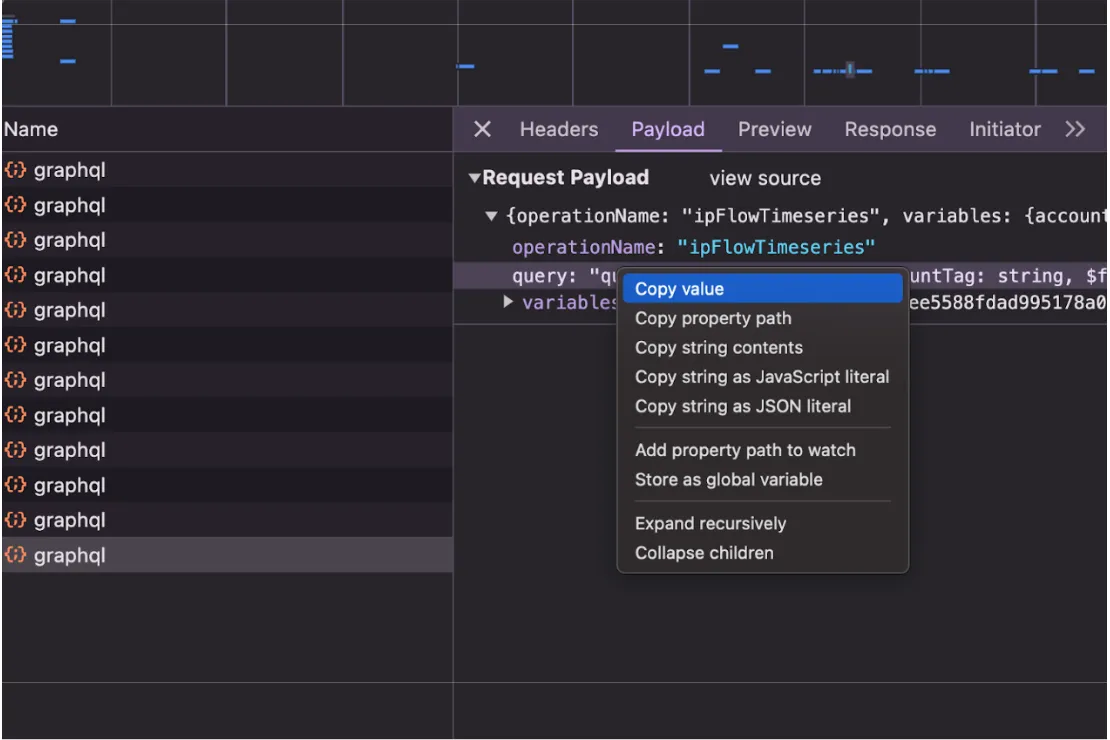
- Select one of the GraphQL requests to open its details and go to the Payload tab. There you will find the GraphQL query. Select the query line and then Copy value to capture the query.
- If you want to capture a new query, adjust the filters in the Network analytics dashboard and a new query will appear in the GraphQL requests.
You can now use this query as the basis for your API call. Refer to the Get started section for more information.