Changelog
New updates and improvements at Cloudflare.

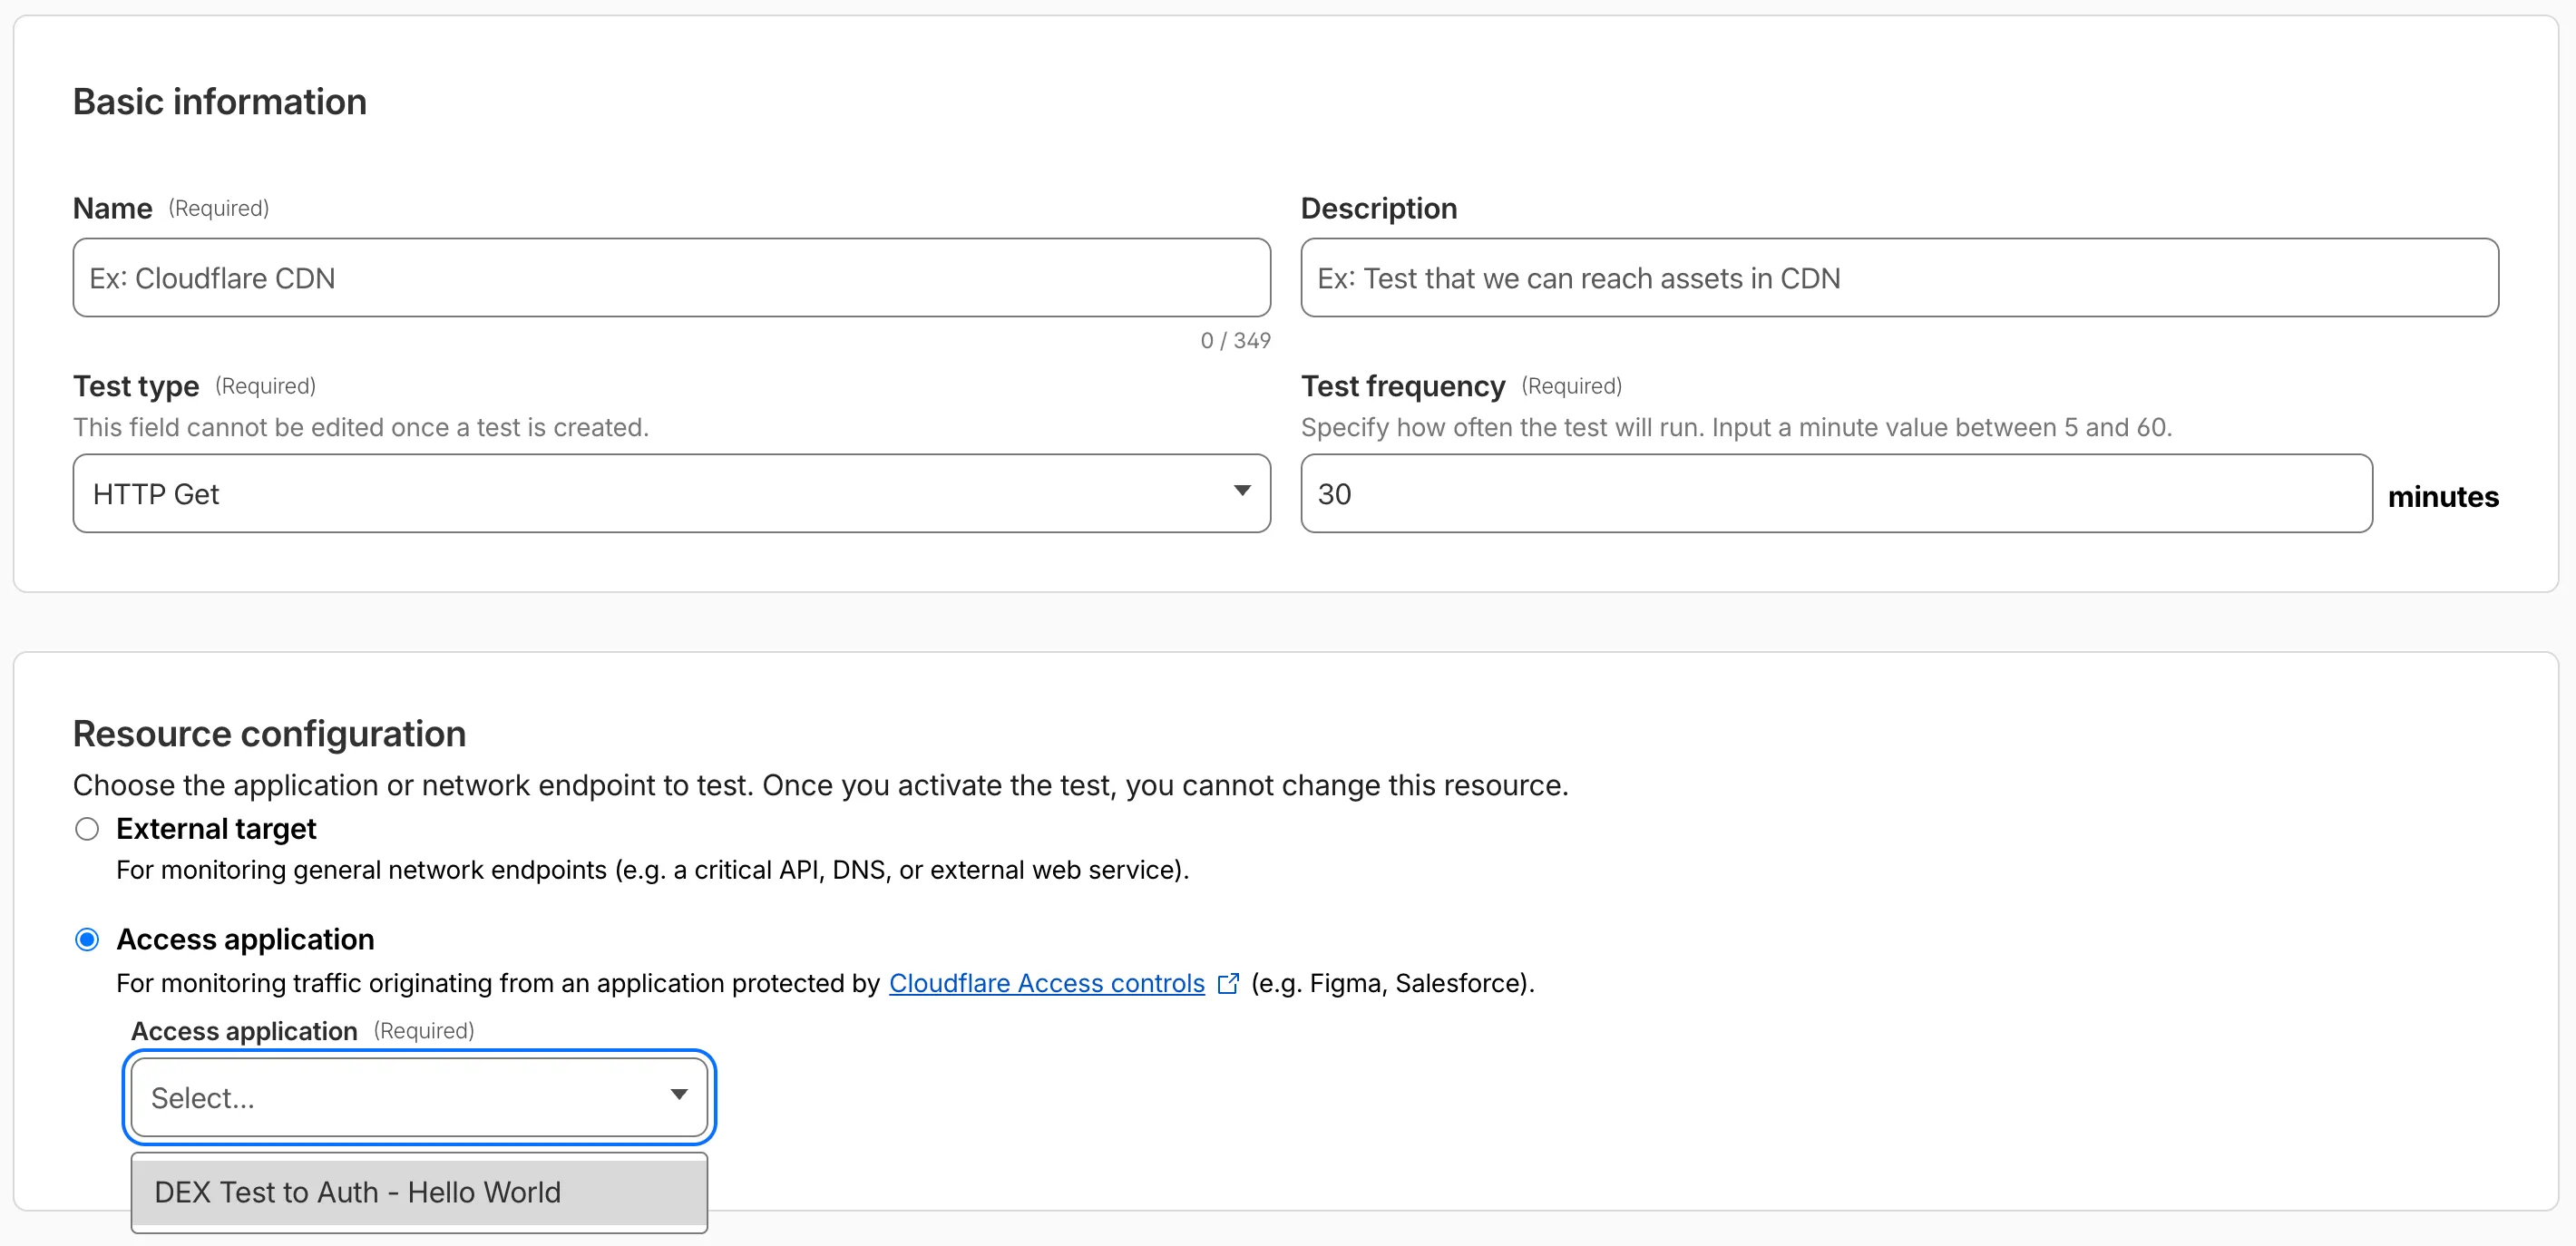
Digital experience tests now support testing applications protected by Cloudflare Access or third-party authentication. All authentication secrets are managed via Cloudflare Secret Store.
Digital experience tests also have enhanced configuration options including:
- New HTTP methods (DELETE, PATCH, POST, PUT)
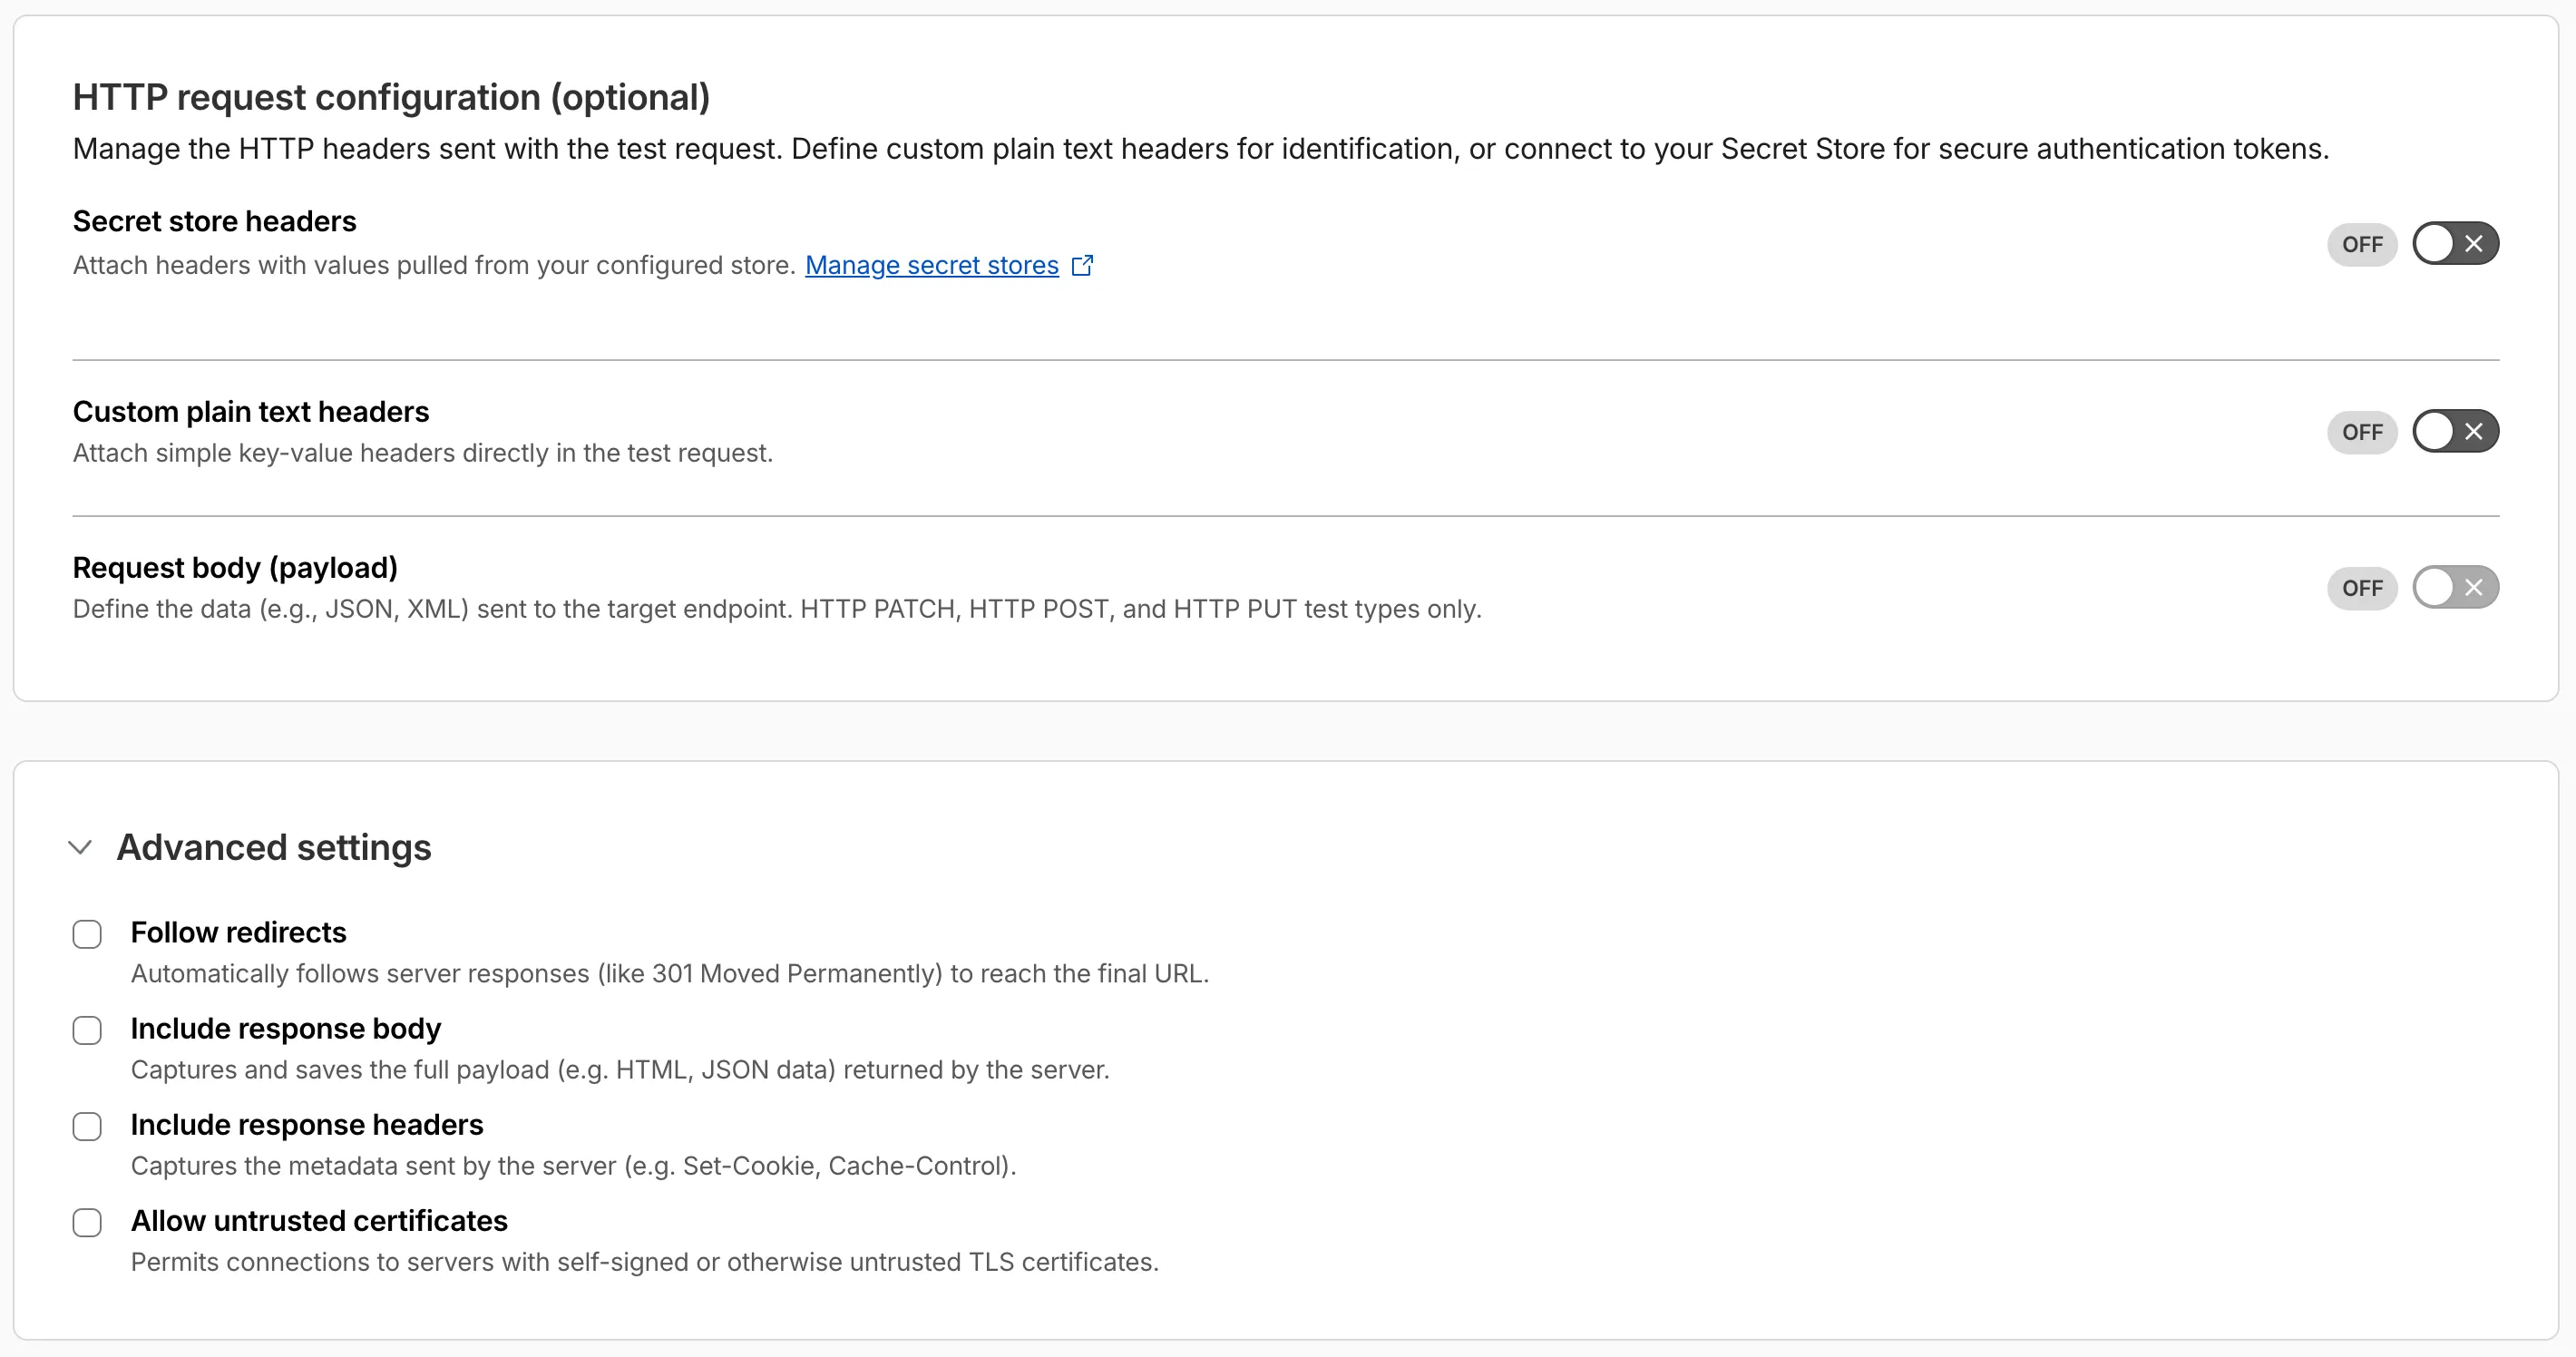
- Secret Store headers, custom plain text headers, and custom request bodies
- Advanced settings: follow redirects, response bodies, response headers, and allow untrusted certificates
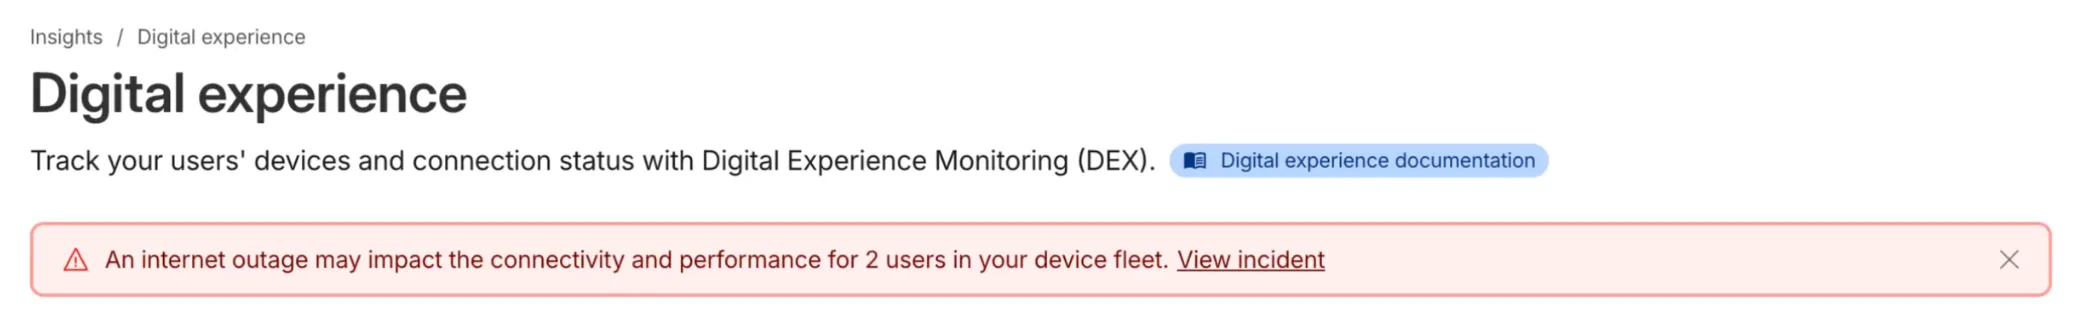
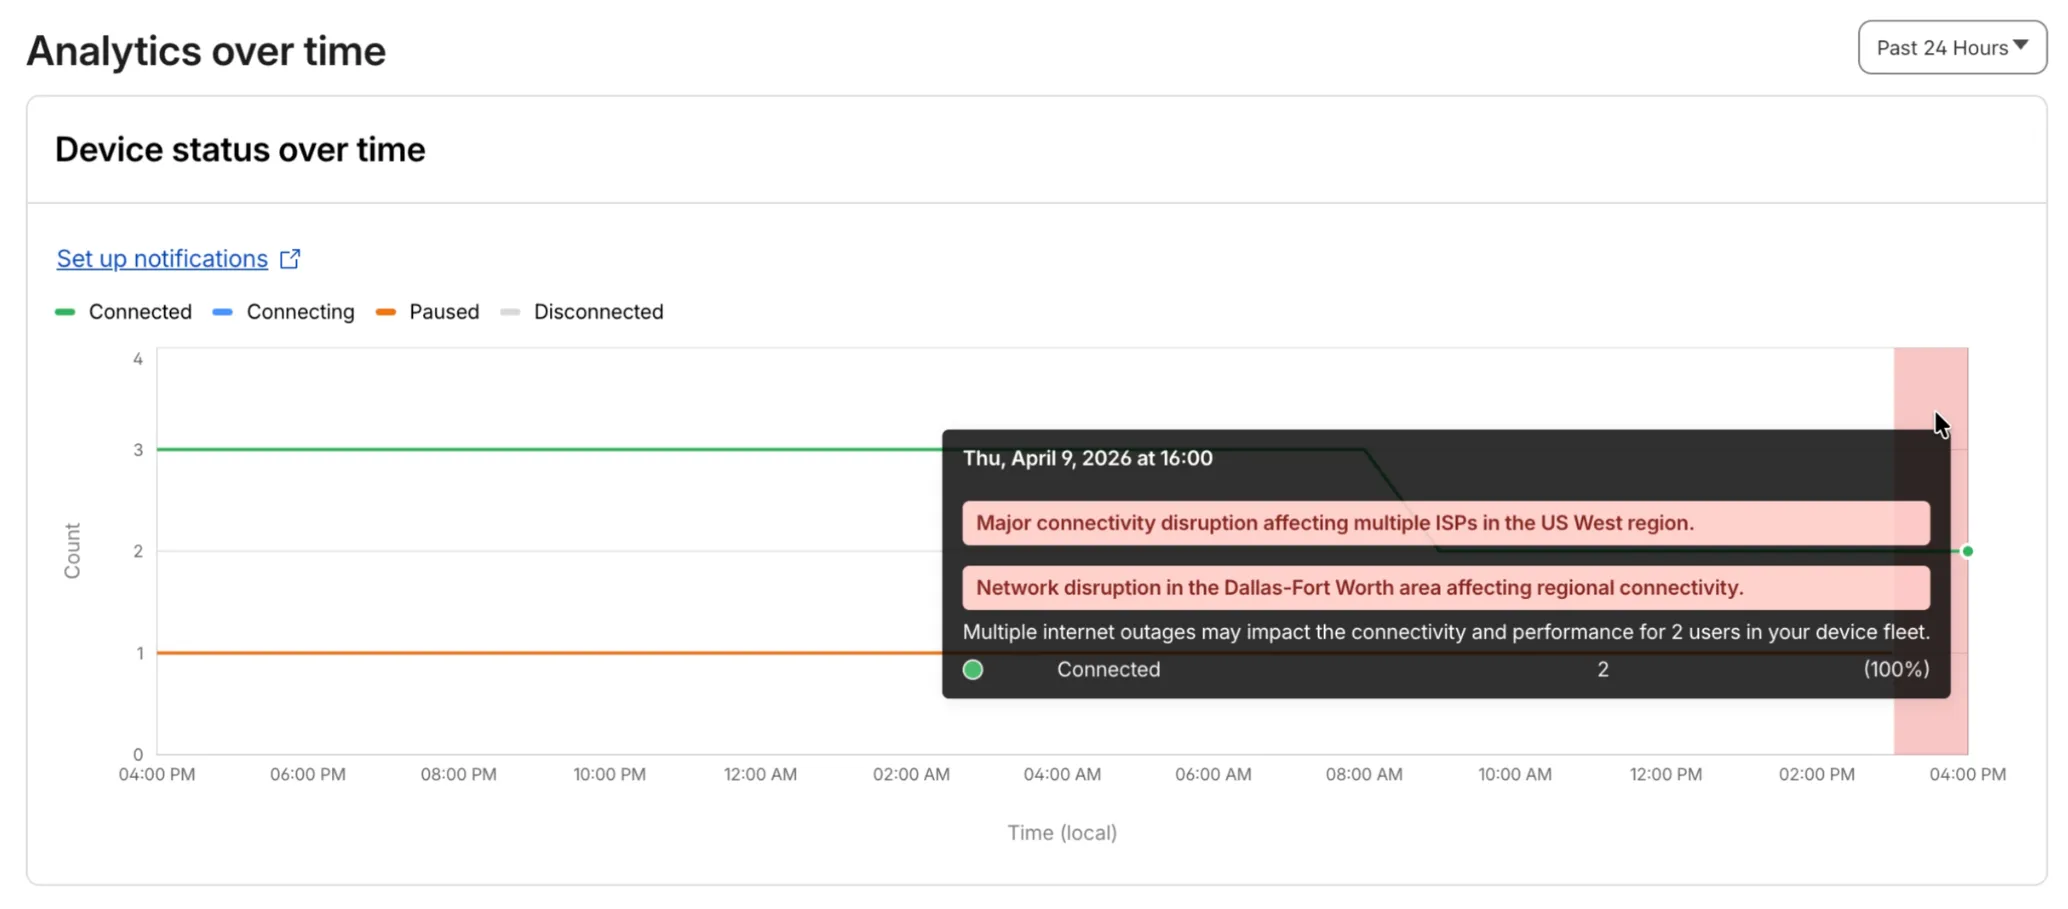
Digital Experience will display a dashboard notification when an Internet outage or traffic anomaly may impact a Cloudflare One Client device based on its geographic location or network connection.
This Internet outage and traffic anomaly data is pulled from Cloudflare Radar ↗. All Internet outage and traffic anomaly observations can be viewed in the Radar Outage Center ↗.
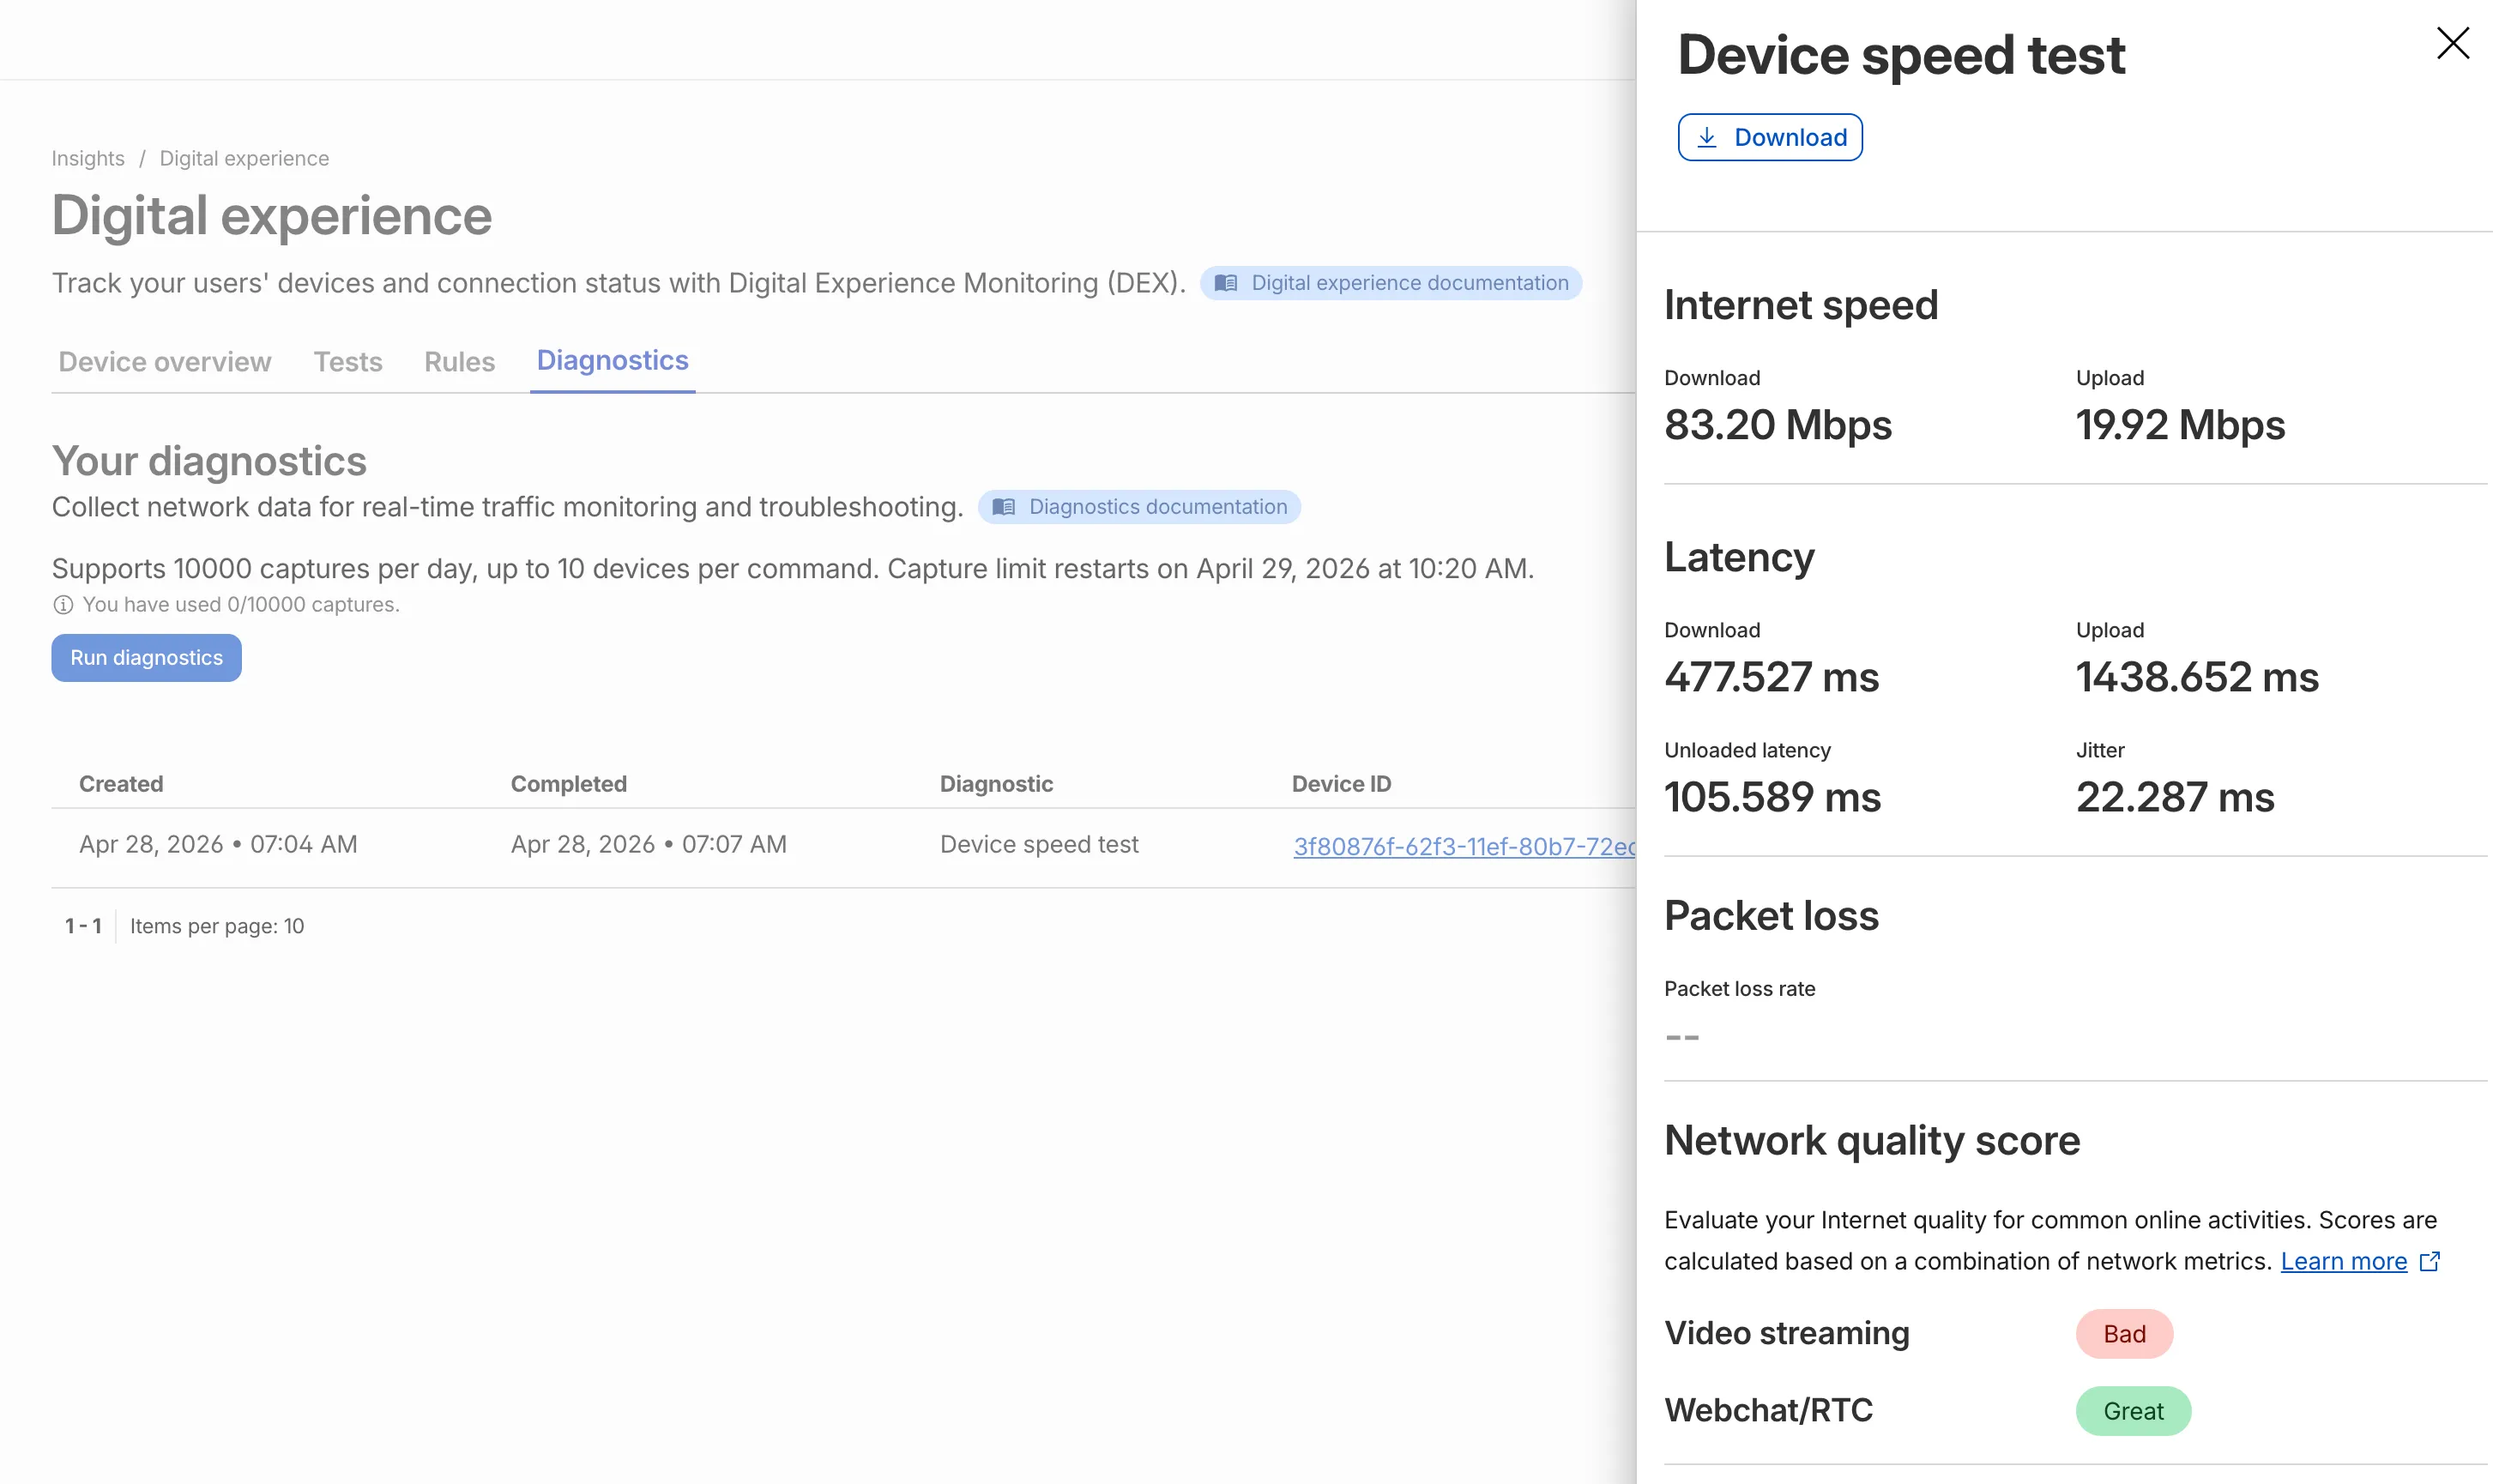
IT teams can now remotely run speed tests from the Cloudflare One Client to Cloudflare's network edge.
Each speed test includes the following metrics:
- Internet speed: download and upload throughput
- Latency: download, upload, unloaded latency, and jitter
- Network quality score: video streaming, webchat/real-time communication (RTC)
In the Cloudflare dashboard ↗, go to Zero Trust > Insights > Digital experience > Diagnostics and select Run diagnostics to use the feature today.
The last seen timestamp for Cloudflare One Client devices is now more consistent across the dashboard. IT teams will see more consistent information about the most recent client event between a device and Cloudflare's network.
Digital Experience Monitoring (DEX) provides visibility into WARP device connectivity and performance to any internal or external application.
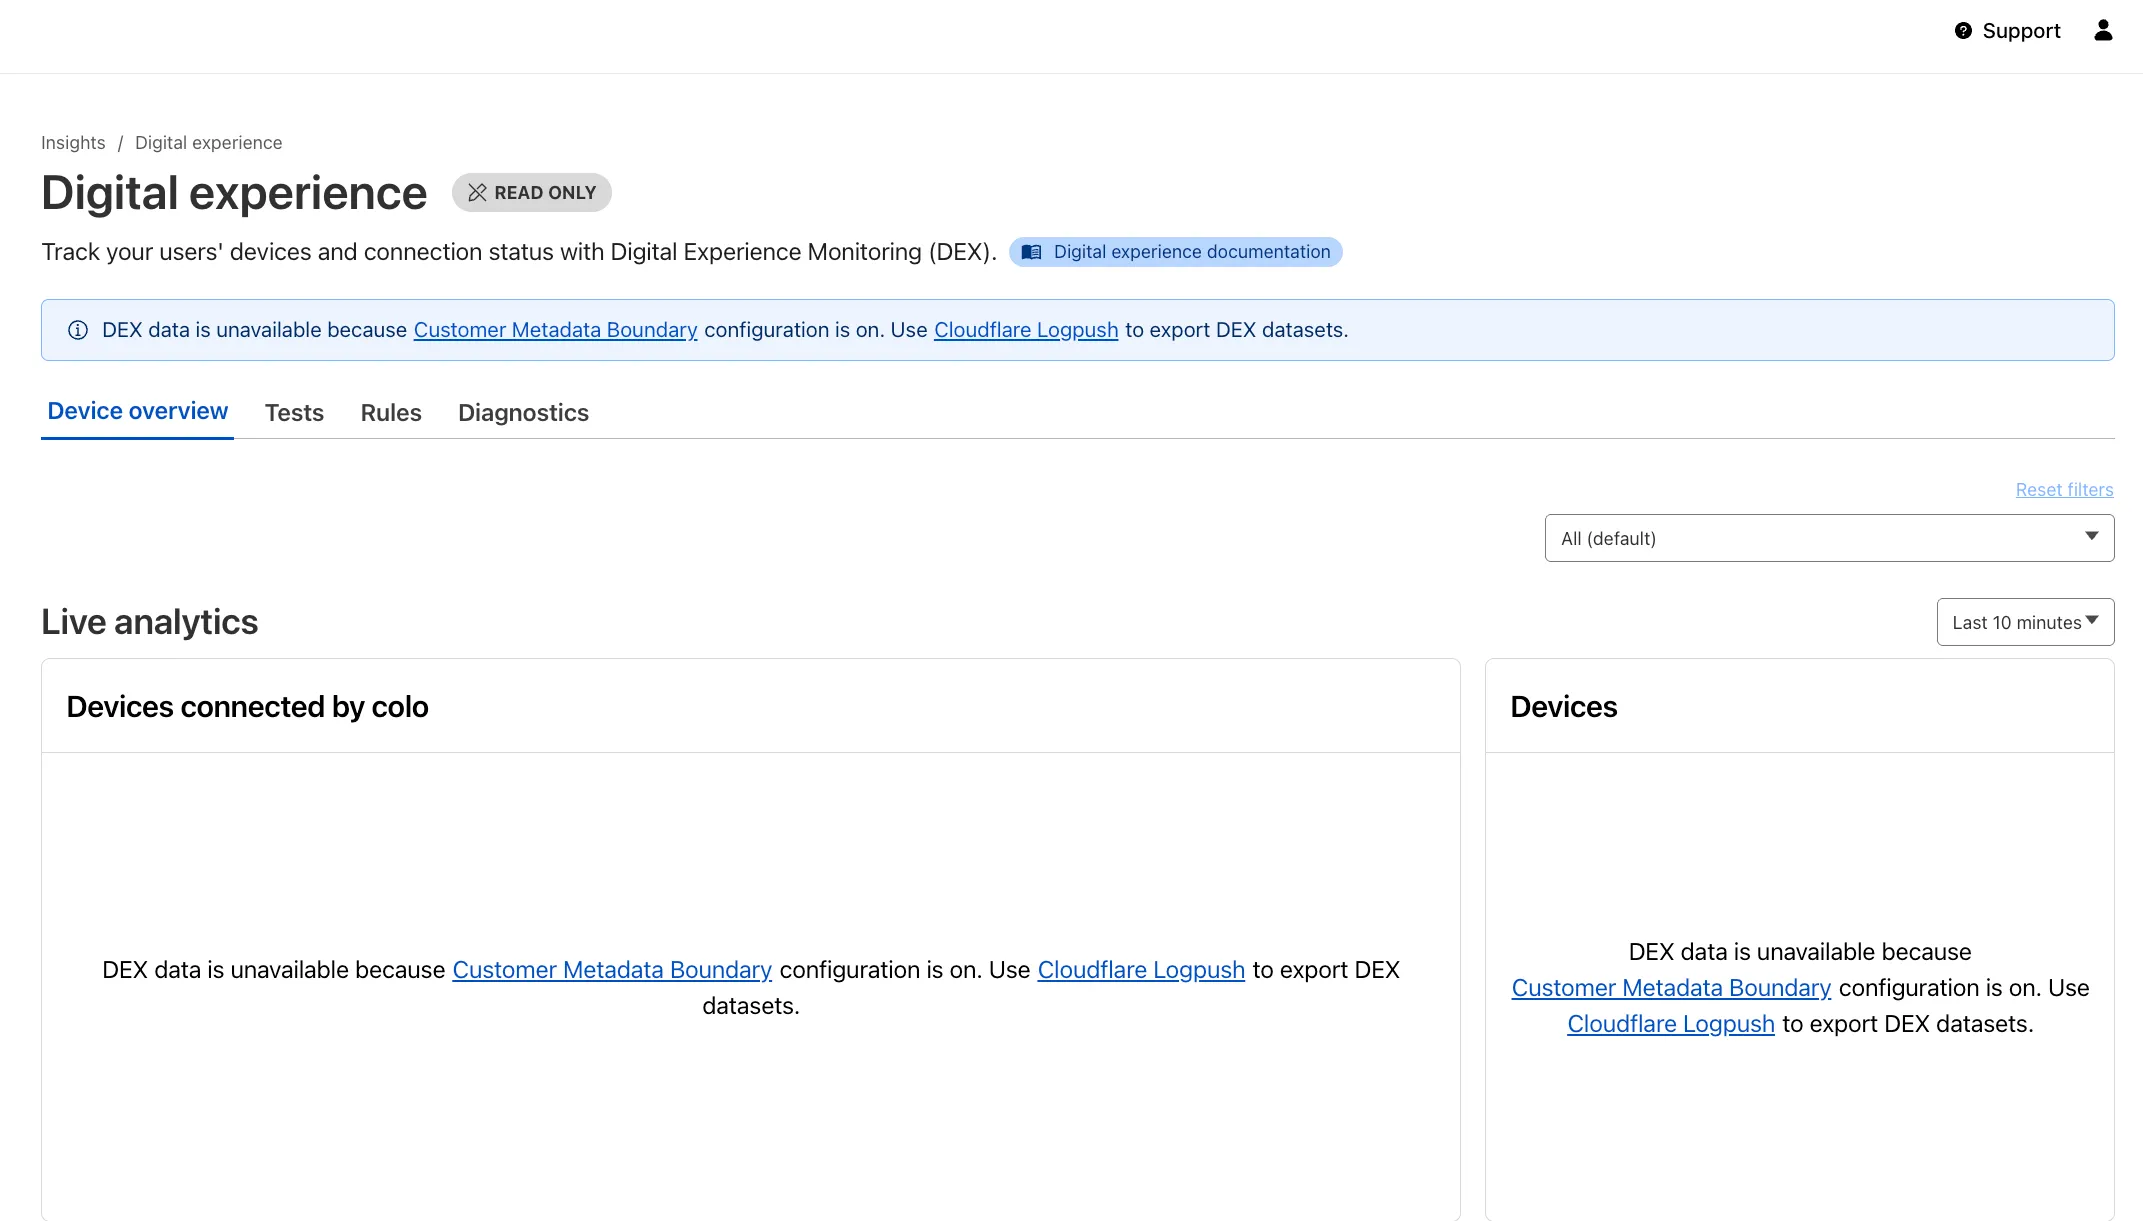
Now, all DEX logs are fully compatible with Cloudflare's Customer Metadata Boundary (CMB) setting for the 'EU' (European Union), which ensures that DEX logs will not be stored outside the 'EU' when the option is configured.
If a Cloudflare One customer using DEX enables CMB 'EU', they will not see any DEX data in the Cloudflare One dashboard. Customers can ingest DEX data via LogPush, and build their own analytics and dashboards.
If a customer enables CMB in their account, they will see the following message in the Digital Experience dashboard: "DEX data is unavailable because Customer Metadata Boundary configuration is on. Use Cloudflare LogPush to export DEX datasets."
Digital Experience Monitoring (DEX) provides visibility into WARP device metrics, connectivity, and network performance across your Cloudflare SASE deployment.
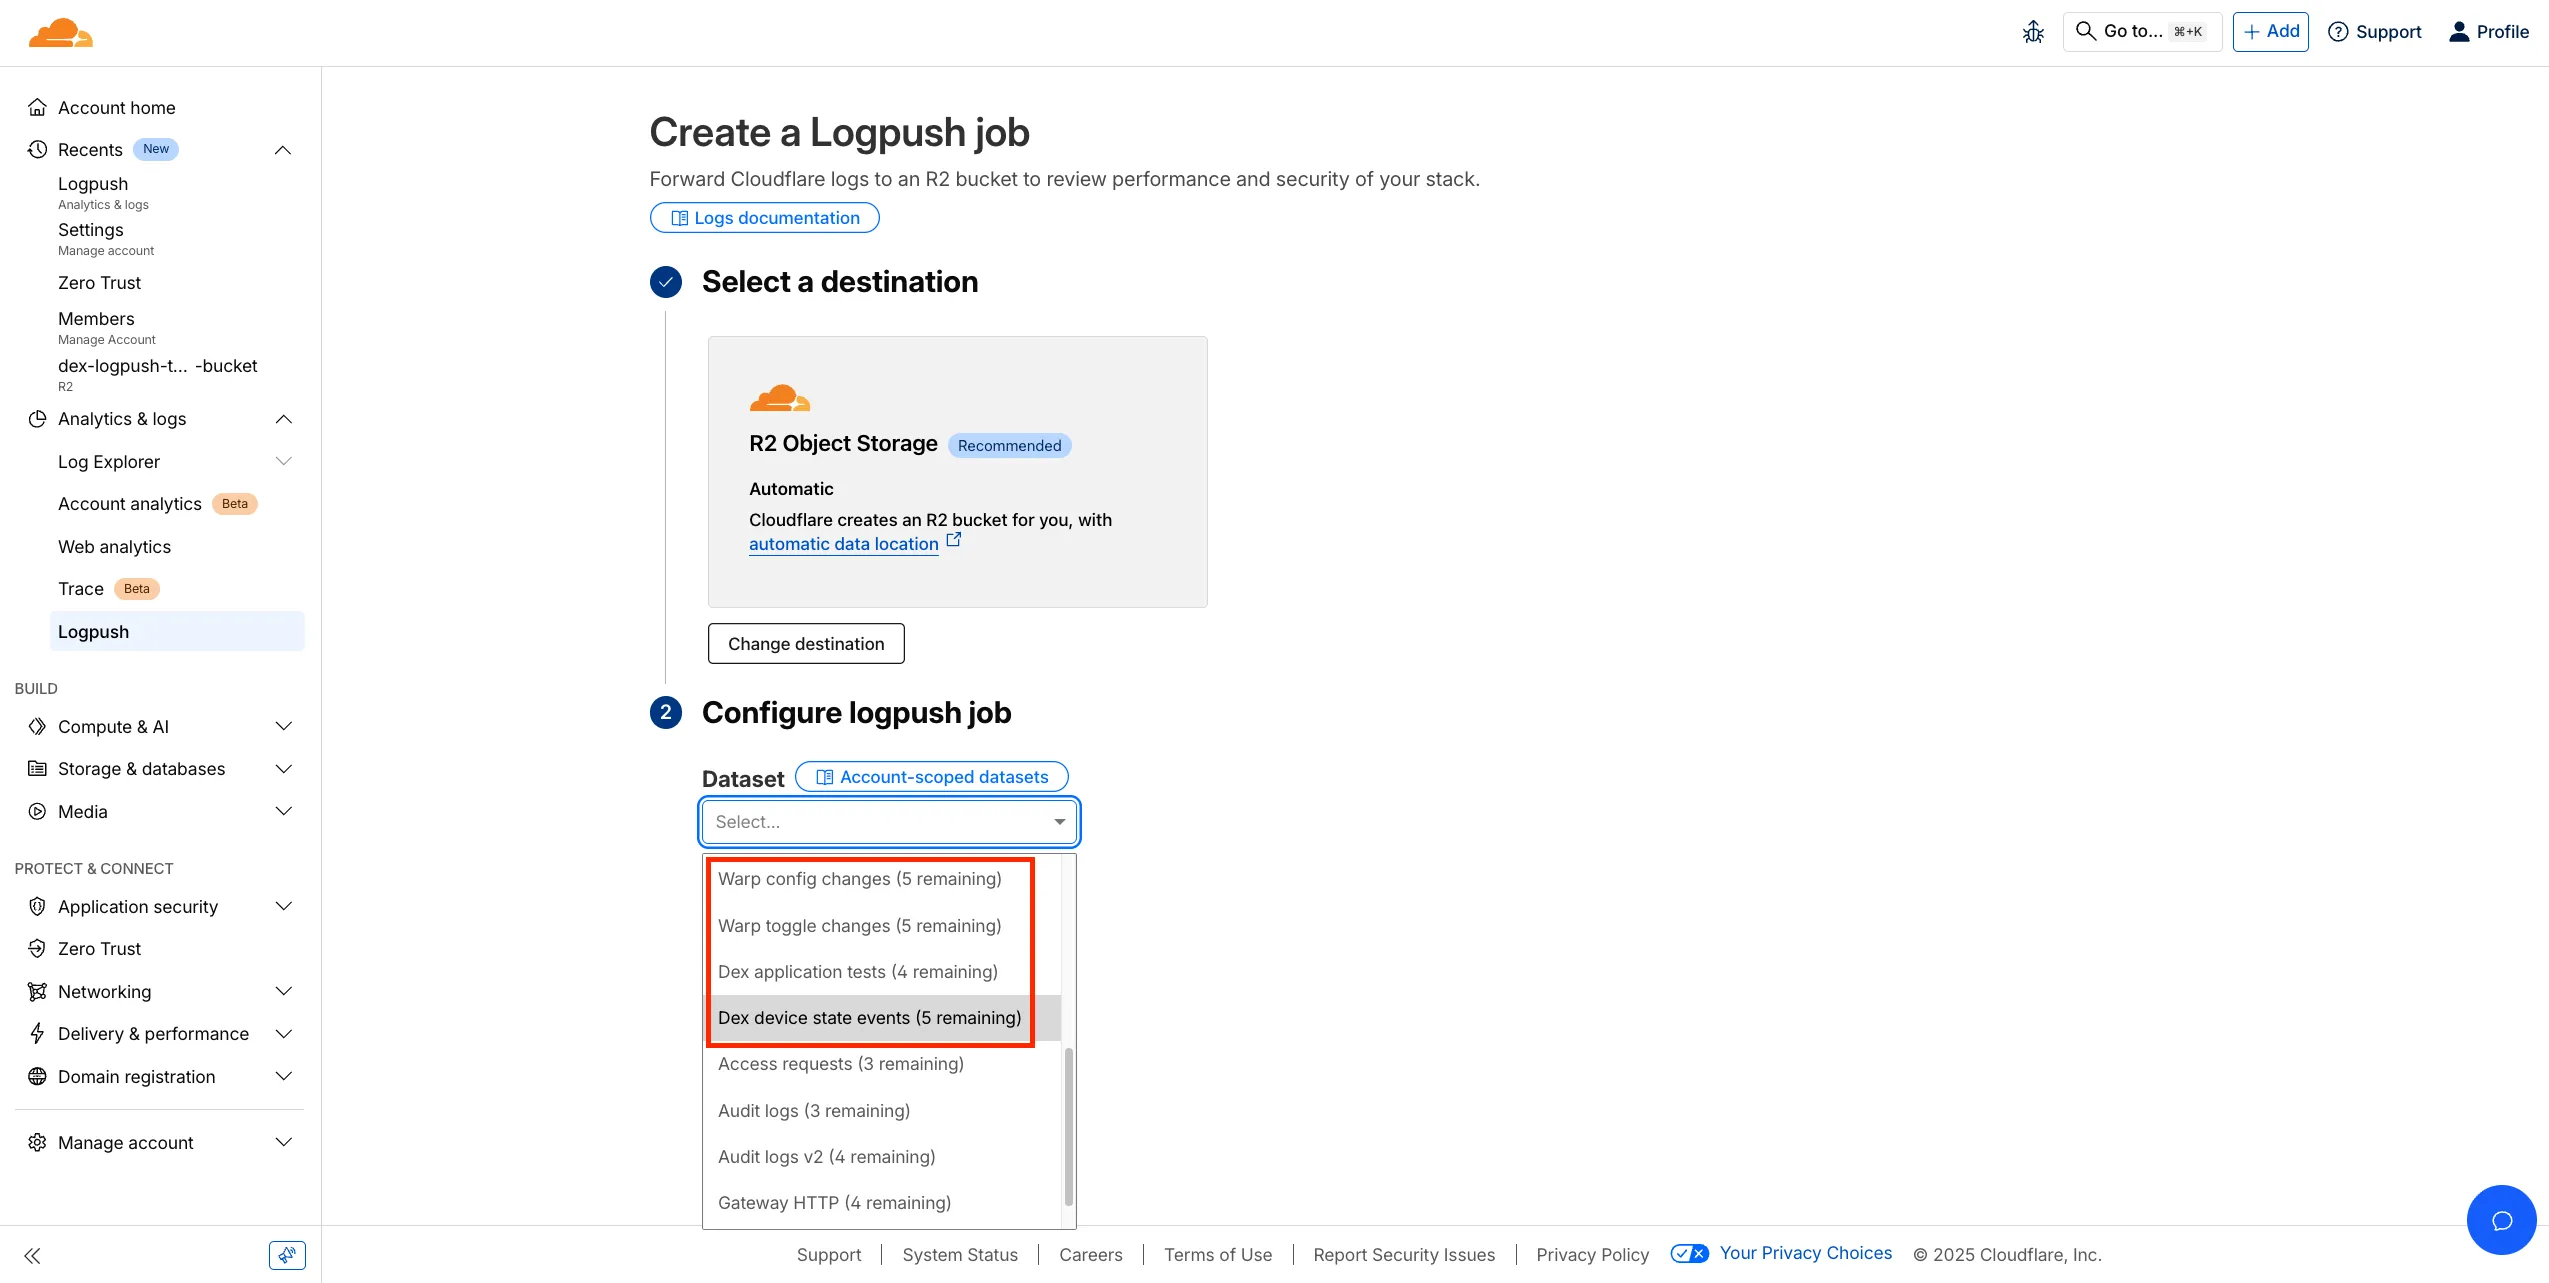
We've released four new WARP and DEX device data sets that can be exported via Cloudflare Logpush. These Logpush data sets can be exported to R2, a cloud bucket, or a SIEM to build a customized logging and analytics experience.
To create a new DEX or WARP Logpush job, customers can go to the account level of the Cloudflare dashboard > Analytics & Logs > Logpush to get started.
Digital Experience Monitoring (DEX) provides visibility into device connectivity and performance across your Cloudflare SASE deployment.
We've released an MCP server (Model Context Protocol) ↗ for DEX.
The DEX MCP server is an AI tool that allows customers to ask a question like, "Show me the connectivity and performance metrics for the device used by carly@acme.com", and receive an answer that contains data from the DEX API.
Any Cloudflare One customer using a Free, Pay-as-you-go, or Enterprise account can access the DEX MCP Server. This feature is available to everyone.
Customers can test the new DEX MCP server in less than one minute. To learn more, read the DEX MCP server documentation.
Digital Experience Monitoring (DEX) provides visibility into device, network, and application performance across your Cloudflare SASE deployment. The latest release of the Cloudflare One agent (v2025.1.861) now includes device endpoint monitoring capabilities to provide deeper visibility into end-user device performance which can be analyzed directly from the dashboard.
Device health metrics are now automatically collected, allowing administrators to:
- View the last network a user was connected to
- Monitor CPU and RAM utilization on devices
- Identify resource-intensive processes running on endpoints
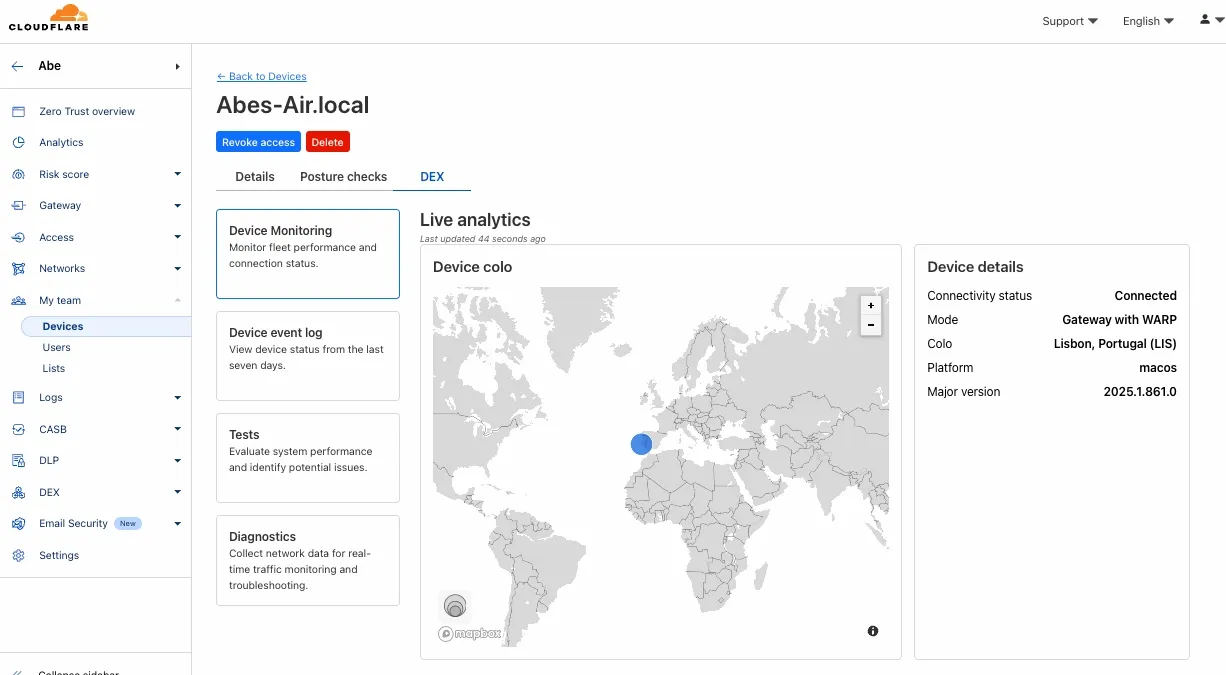
This feature complements existing DEX features like synthetic application monitoring and network path visualization, creating a comprehensive troubleshooting workflow that connects application performance with device state.
For more details refer to our DEX documentation.
Welcome to your new home for product updates on Cloudflare One.
Our new changelog lets you read about changes in much more depth, offering in-depth examples, images, code samples, and even gifs.
If you are looking for older product updates, refer to the following locations.