Changelog
New updates and improvements at Cloudflare.

We're announcing the public beta of Organizations for enterprise customers, a new top-level Cloudflare container that lets Cloudflare customers manage multiple accounts, members, analytics, and shared policies from one centralized location.
What's New
Organizations [BETA]: Organizations are a new top-level container for centrally managing multiple accounts. Each Organization supports up to 500 accounts and 5000 zones, giving larger teams a single place to administer resources at scale.
Self-serve onboarding: Enterprise customers can create an Organization in the dashboard and assign accounts where they are already Super Administrators.
Centralized Account Management: At launch, every Organization member has the Organization Super Admin role. Organization Super Admins can invite other users and manage any child account under the Organization implicitly. Shared policies: Share WAF or Gateway policies across multiple accounts within your Organization to simplify centralized policy management. Implicit access: Members of an Organization automatically receive Super Administrator permissions across child accounts, removing the need for explicit membership on each account. Additional Org-level roles will be available over the course of the year.
Unified analytics: View, filter, and download aggregate HTTP analytics across all Organization child accounts from a single dashboard for centralized visibility into traffic patterns and security events.
Terraform provider support: Manage Organizations with infrastructure as code from day one. Provision organizations, assign accounts, and configure settings programmatically with the Cloudflare Terraform provider ↗.
Shared policies: Share WAF or Gateway policies across multiple accounts within your Organization to simplify centralized policy management.
For more info:
Access authentication logs and Gateway activity logs (DNS, Network, and HTTP) now feature a refreshed user interface that gives you more flexibility when viewing and analyzing your logs.
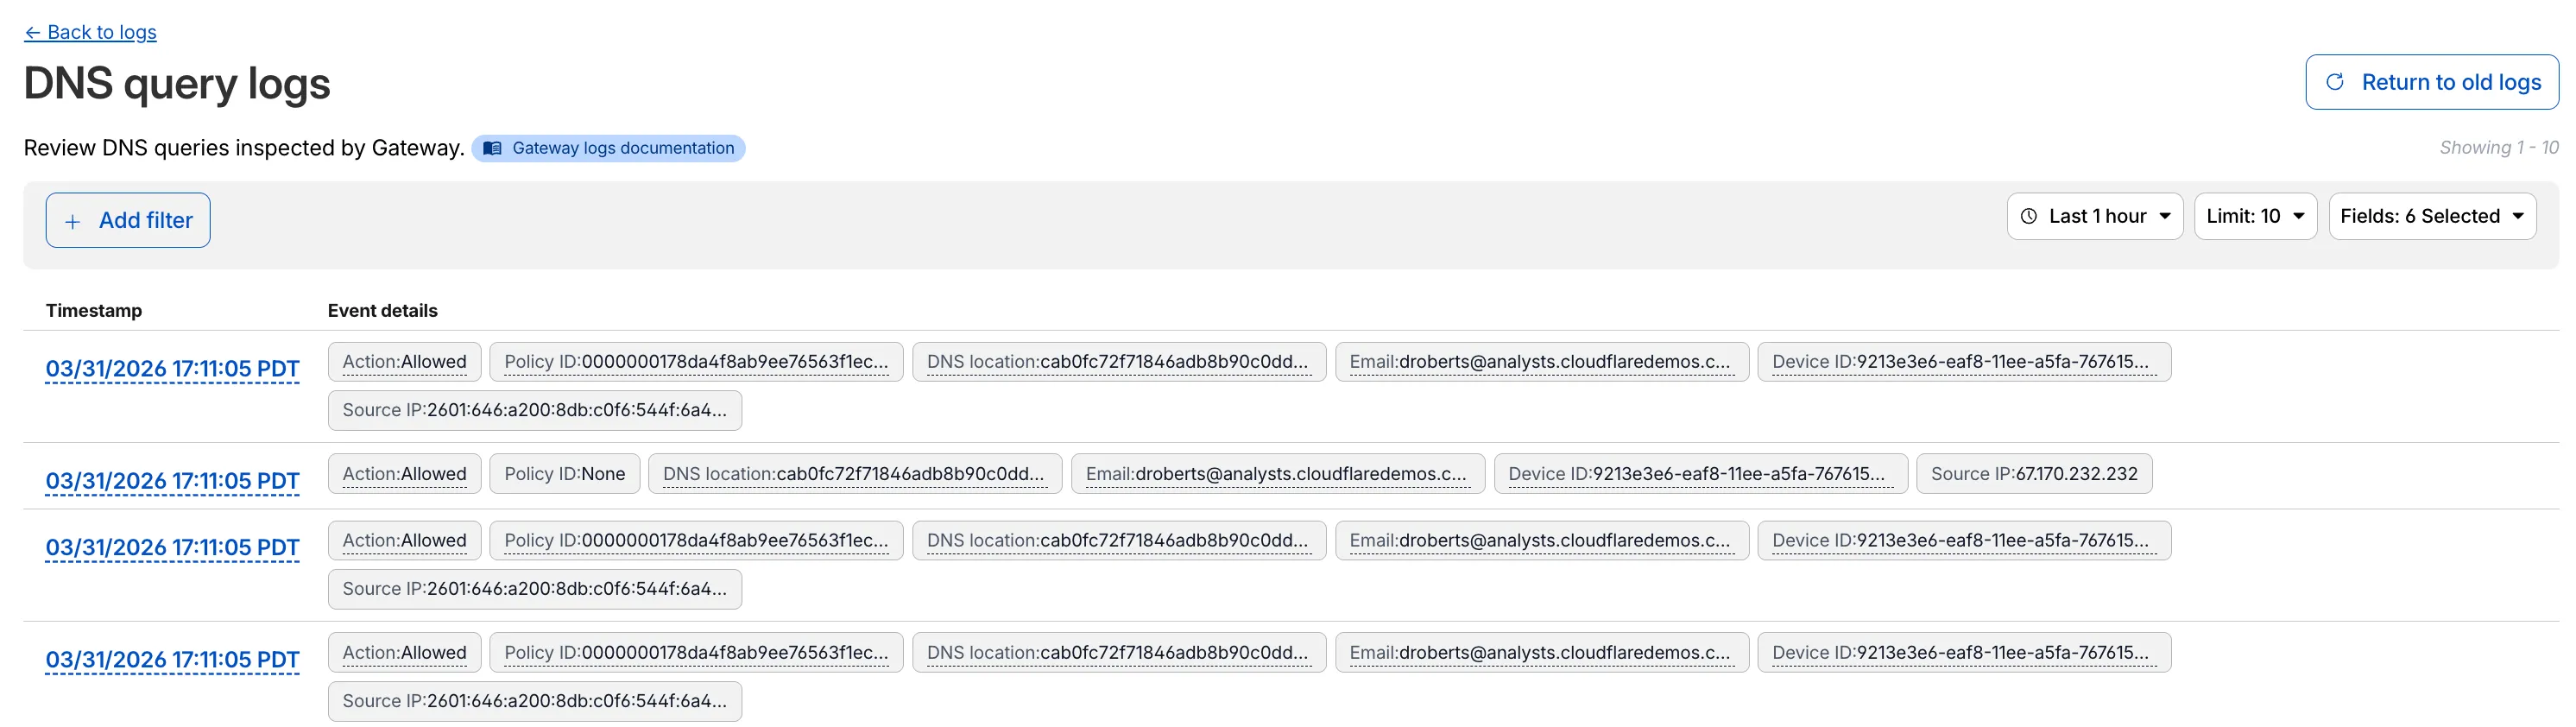
The updated UI includes:
- Filter by field - Select any field value to add it as a filter and narrow down your results.
- Customizable fields - Choose which fields to display in the log table. Querying for fewer fields improves log loading performance.
- View details - Select a timestamp to view the full details of a log entry.
- Switch to classic view - Return to the previous log viewer interface if needed.
For more information, refer to Access authentication logs and Gateway activity logs.
You can now use user risk scores in your Access policies. The new User Risk Score selector allows you to create Access policies that respond to user behavior patterns detected by Cloudflare's risk scoring system, including impossible travel, high DLP policy matches, and more.
For more information, refer to Use risk scores in Access policies.
You can now copy Cloudflare One resources as JSON or as a ready-to-use API POST request directly from the dashboard. This makes it simple to transition workflows into API calls, automation scripts, or infrastructure-as-code pipelines.
To use this feature, click the overflow menu (⋮) on any supported resource and select Copy as JSON or Copy as POST request. The copied output includes only the fields present on your resource, giving you a clean and minimal starting point for your own API calls.
Initially supported resources:
- Access applications
- Access policies
- Gateway policies
- Resolver policies
- Service tokens
- Identity providers
We will continue to add support for more resources throughout 2026.
We are updating naming related to some of our Networking products to better clarify their place in the Zero Trust and Secure Access Service Edge (SASE) journey.
We are retiring some older brand names in favor of names that describe exactly what the products do within your network. We are doing this to help customers build better, clearer mental models for comprehensive SASE architecture delivered on Cloudflare.
- Magic WAN → Cloudflare WAN
- Magic WAN IPsec → Cloudflare IPsec
- Magic WAN GRE → Cloudflare GRE
- Magic WAN Connector → Cloudflare One Appliance
- Magic Firewall → Cloudflare Network Firewall
- Magic Network Monitoring → Network Flow
- Magic Cloud Networking → Cloudflare One Multi-cloud Networking
No action is required by you — all functionality, existing configurations, and billing will remain exactly the same.
For more information, visit the Cloudflare One documentation.
Cloudflare One Appliance version 2026.2.0 adds post-quantum encryption support using hybrid ML-KEM (Module-Lattice-Based Key-Encapsulation Mechanism).
The appliance now uses TLS 1.3 with hybrid ML-KEM for its connection to the Cloudflare edge. During the TLS handshake, the appliance and the edge share a symmetric secret over the TLS connection and inject it into the ESP layer of IPsec. This protects IPsec data plane traffic against harvest-now, decrypt-later attacks.
This upgrade deploys automatically to all appliances during their configured interrupt windows with no manual action required.
For more information, refer to Cloudflare One Appliance.
Magic WAN and Magic Transit customers can use the Cloudflare dashboard to configure and manage BGP peering between their networks and their Magic routing table when using IPsec and GRE tunnel on-ramps (beta).
Using BGP peering allows customers to:
- Automate the process of adding or removing networks and subnets.
- Take advantage of failure detection and session recovery features.
With this functionality, customers can:
- Establish an eBGP session between their devices and the Magic WAN / Magic Transit service when connected via IPsec and GRE tunnel on-ramps.
- Secure the session by MD5 authentication to prevent misconfigurations.
- Exchange routes dynamically between their devices and their Magic routing table.
For configuration details, refer to:
Cloudflare source IPs are the IP addresses used by Cloudflare services (such as Load Balancing, Gateway, and Browser Isolation) when sending traffic to your private networks.
For customers using legacy mode routing, traffic to private networks is sourced from public Cloudflare IPs, which may cause IP conflicts. For customers using Unified Routing mode (beta), traffic to private networks is sourced from dedicated, non-Internet-routable private IPv4 range to ensure:
- Symmetric routing over private network connections
- Proper firewall state preservation
- Private traffic stays on secure paths
Key details:
- IPv4: Sourced from
100.64.0.0/12by default, configurable to any/12CIDR - IPv6: Sourced from
2606:4700:cf1:5000::/64(not configurable) - Affected connectors: GRE, IPsec, CNI, WARP Connector, and WARP Client (Cloudflare Tunnel is not affected)
Configuring Cloudflare source IPs requires Unified Routing (beta) and the
Cloudflare One Networks Writepermission.For configuration details, refer to Configure Cloudflare source IPs.
You can now require Cloudflare Access protection for all hostnames in your account. When enabled, traffic to any hostname that does not have a matching Access application is automatically blocked.
This deny-by-default approach prevents accidental exposure of internal resources to the public Internet. If a developer deploys a new application or creates a DNS record without configuring an Access application, the traffic is blocked rather than exposed.
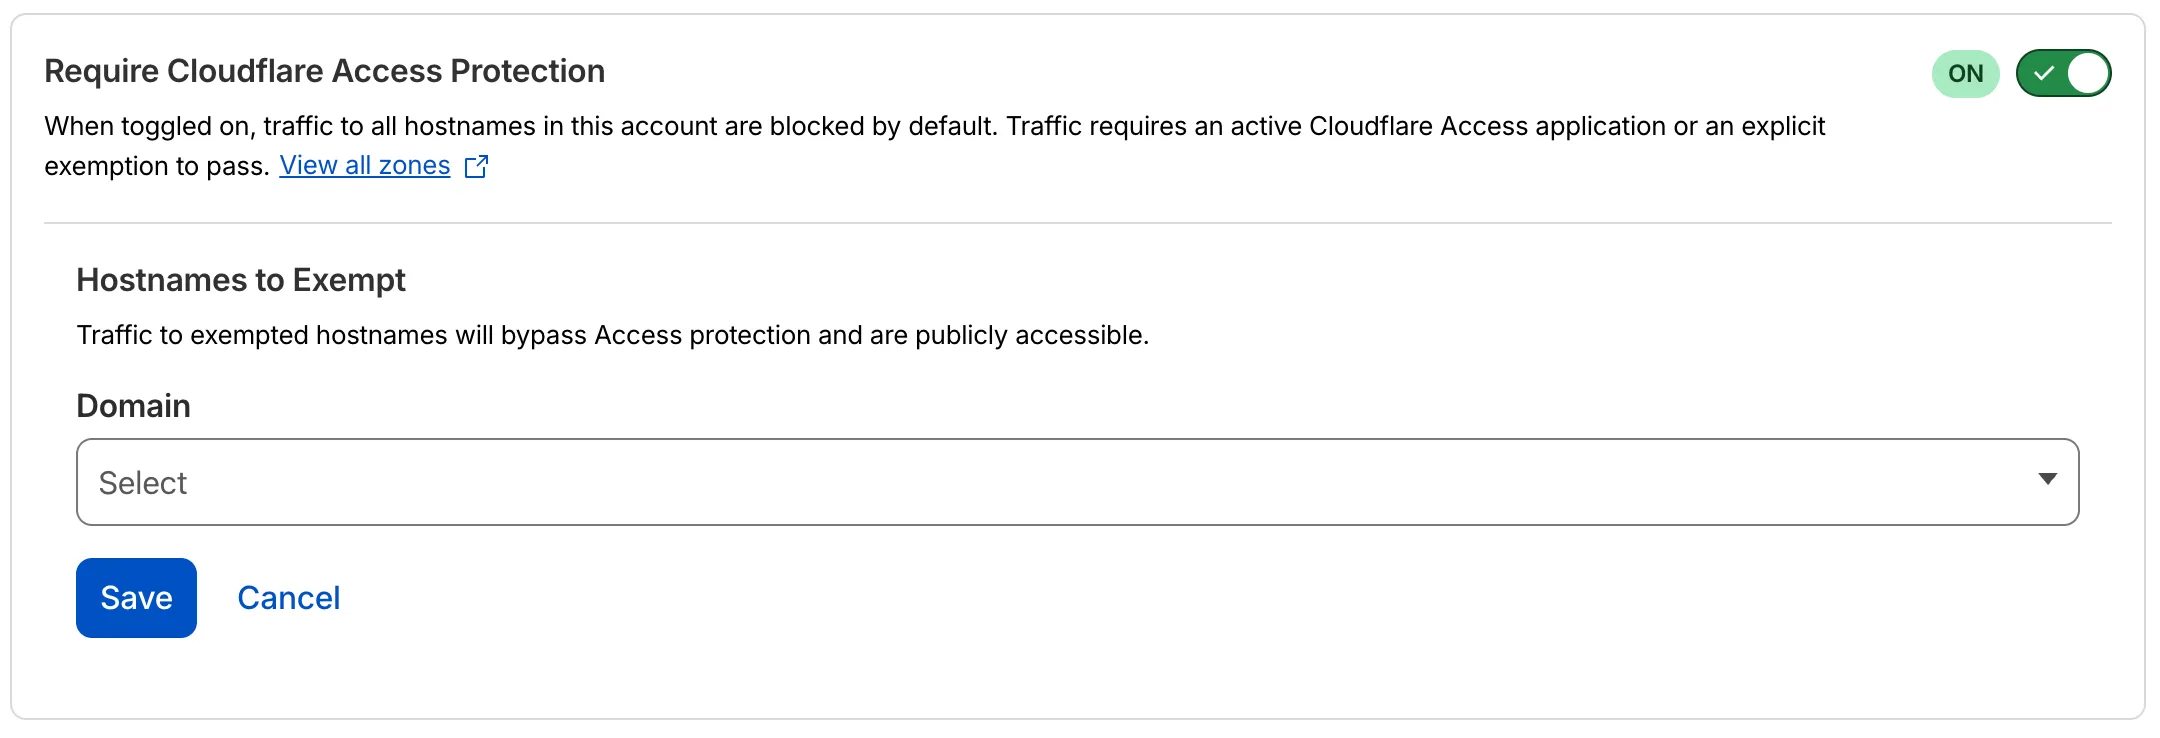
- Blocked by default: Traffic to all hostnames in the account is blocked unless an Access application exists for that hostname.
- Explicit access required: To allow traffic, create an Access application with an Allow or Bypass policy.
- Hostname exemptions: You can exempt specific hostnames from this requirement.
To turn on this feature, refer to Require Access protection.
Magic WAN Connector now exports NetFlow data for breakout traffic to Magic Network Monitoring (MNM), providing visibility into traffic that bypasses Cloudflare's security filtering.
This feature allows you to:
- Monitor breakout traffic statistics in the Cloudflare dashboard.
- View traffic patterns for applications configured to bypass Cloudflare.
- Maintain visibility across all traffic passing through your Magic WAN Connector.
For more information, refer to NetFlow statistics.
Zero Trust has again upgraded its Shadow IT analytics, providing you with unprecedented visibility into your organizations use of SaaS tools. With this dashboard, you can review who is using an application and volumes of data transfer to the application.
With this update, you can review data transfer metrics at the domain level, rather than just the application level, providing more granular insight into your data transfer patterns.
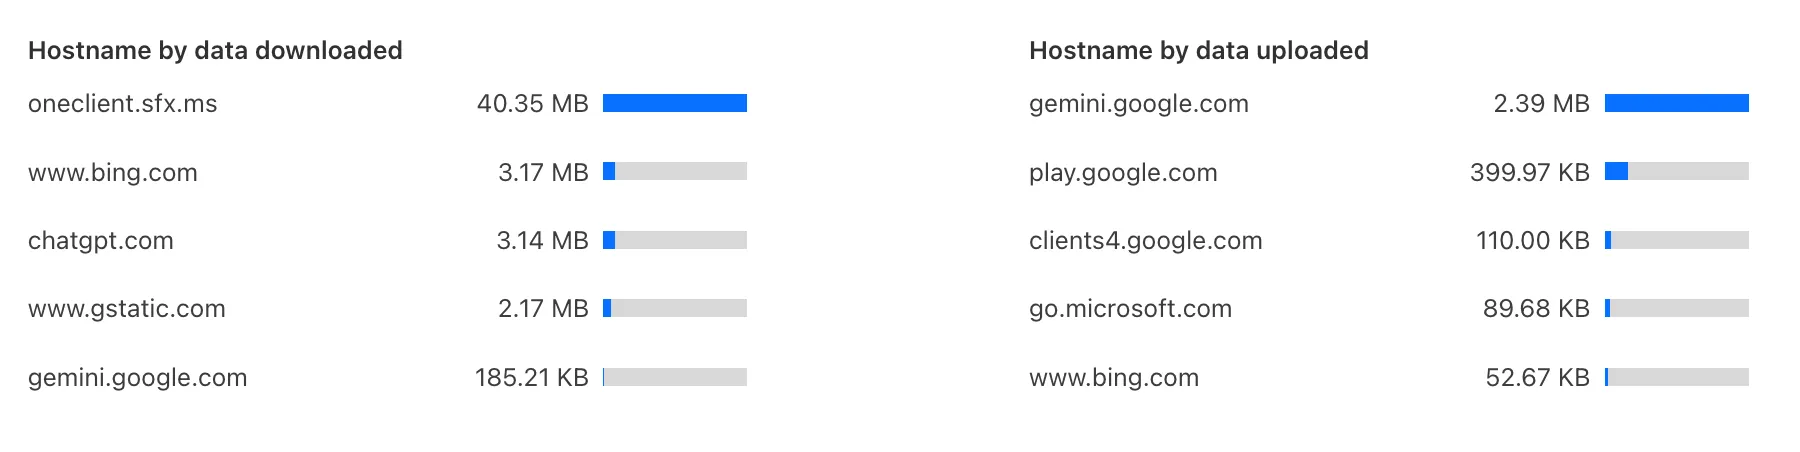
These metrics can be filtered by all available filters on the dashboard, including user, application, or content category.
Both the analytics and policies are accessible in the Cloudflare Zero Trust dashboard ↗, empowering organizations with better visibility and control.
You can now duplicate specific Cloudflare One resources with a single click from the dashboard.
Initially supported resources:
- Access Applications
- Access Policies
- Gateway Policies
To try this out, simply click on the overflow menu (⋮) from the resource table and click Duplicate. We will continue to add the Duplicate action for resources throughout 2026.
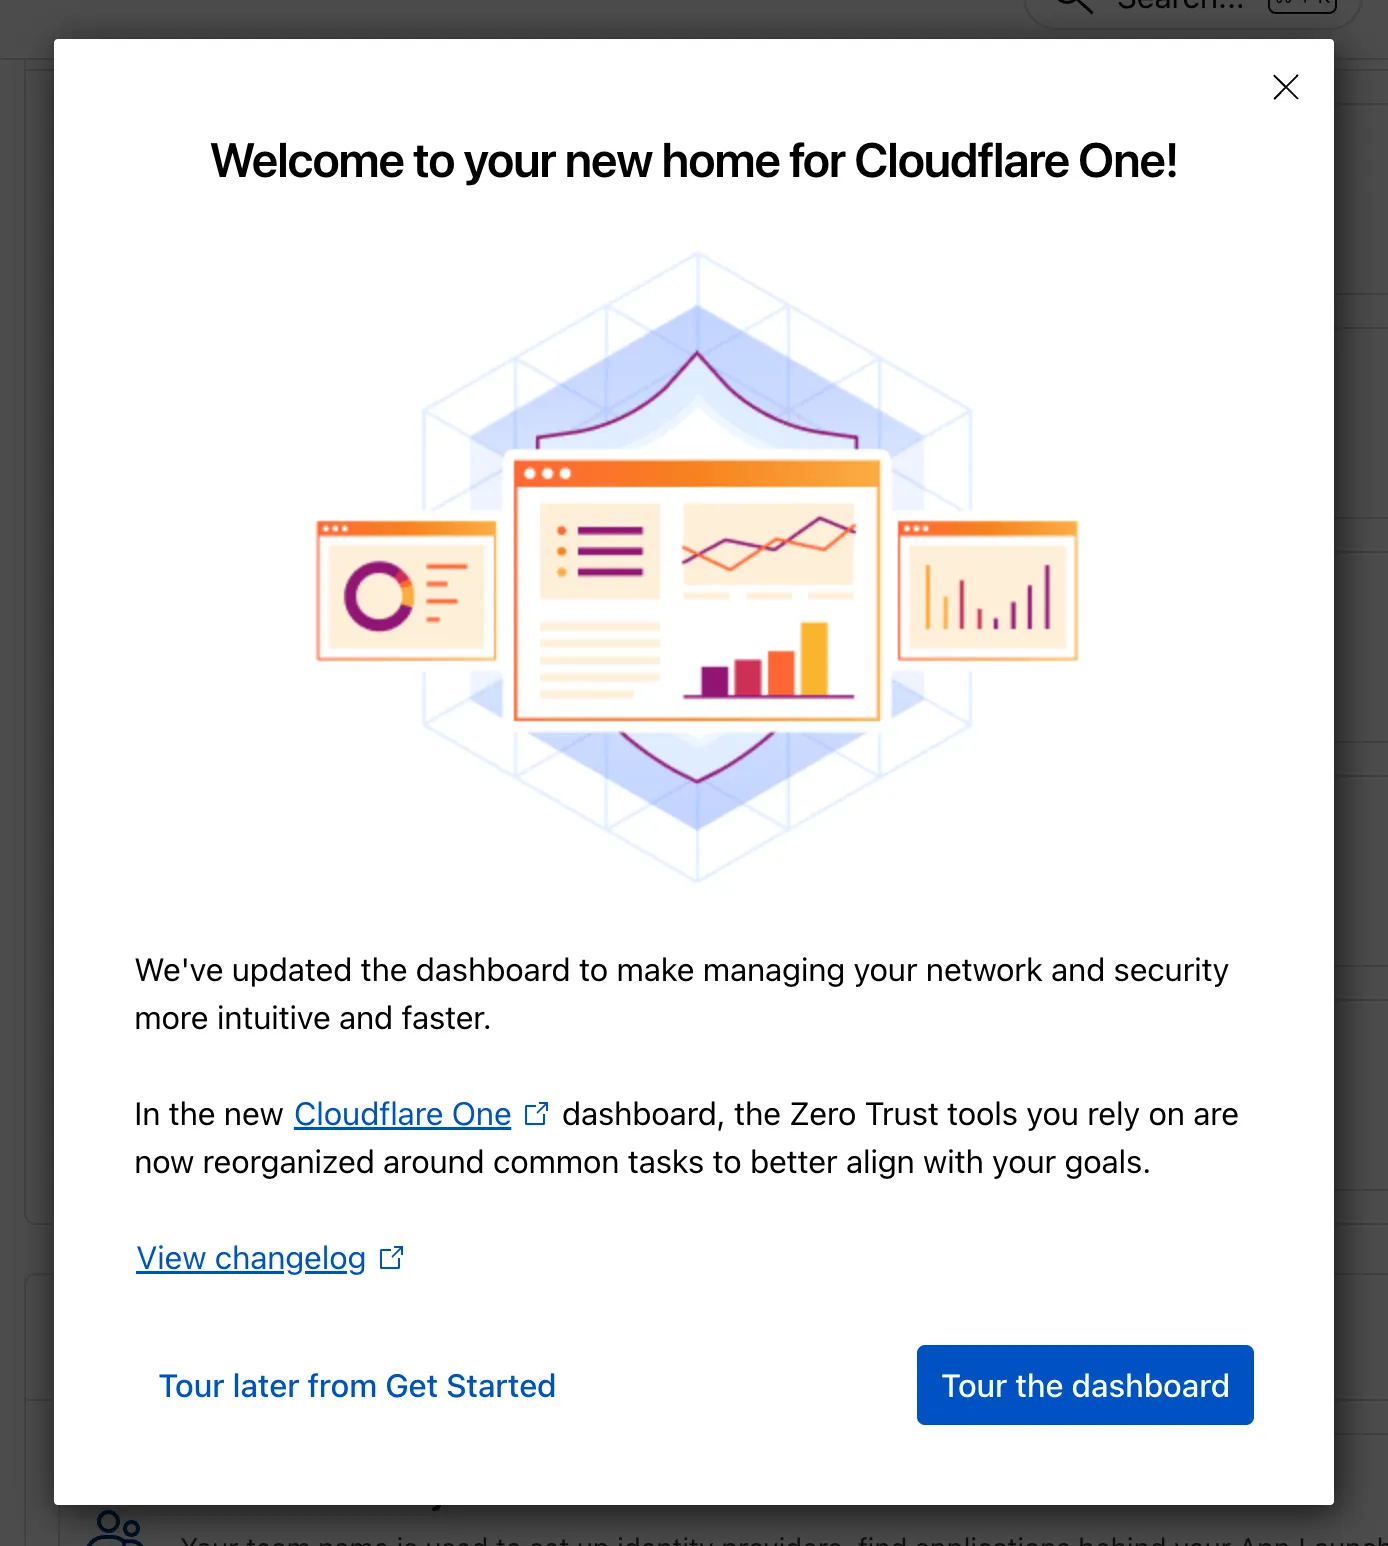
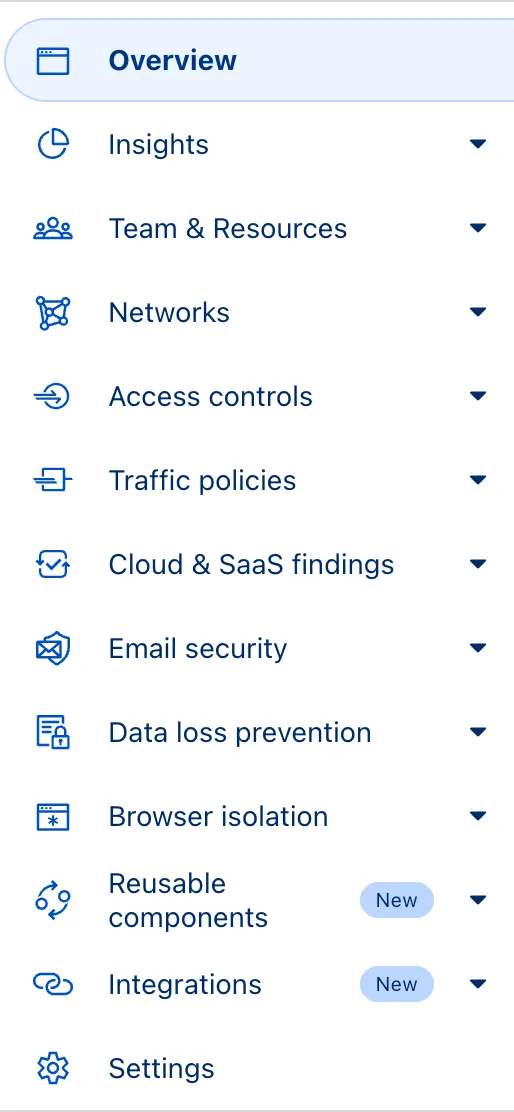
The Zero Trust dashboard and navigation is receiving significant and exciting updates. The dashboard is being restructured to better support common tasks and workflows, and various pages have been moved and consolidated.
There is a new guided experience on login detailing the changes, and you can use the Zero Trust dashboard search to find product pages by both their new and old names, as well as your created resources. To replay the guided experience, you can find it in Overview > Get Started.
Notable changes
- Product names have been removed from many top-level navigation items to help bring clarity to what they help you accomplish. For example, you can find Gateway policies under ‘Traffic policies' and CASB findings under ‘Cloud & SaaS findings.'
- You can view all analytics, logs, and real-time monitoring tools from ‘Insights.'
- ‘Networks' better maps the ways that your corporate network interacts with Cloudflare. Some pages like Tunnels, are now a tab rather than a full page as part of these changes. You can find them at Networks > Connectors.
- Settings are now located closer to the tools and resources they impact. For example, this means you'll find your WARP configurations at Team & Resources > Devices.
No changes to our API endpoint structure or to any backend services have been made as part of this effort.
Magic WAN now supports Automatic Return Routing (ARR), allowing customers to configure Magic on-ramps (IPsec/GRE/CNI) to learn the return path for traffic flows without requiring static routes.
Key benefits:
- Route-less mode: Static or dynamic routes are optional when using ARR.
- Overlapping IP space support: Traffic originating from customer sites can use overlapping private IP ranges.
- Symmetric routing: Return traffic is guaranteed to use the same connection as the original on-ramp.
This feature is currently in beta and requires the new Unified Routing mode (beta).
For configuration details, refer to Configure Automatic Return Routing.
Magic WAN Connector now allows you to designate a specific WAN port for breakout traffic, giving you deterministic control over the egress path for latency-sensitive applications.
With this feature, you can:
- Pin breakout traffic for specific applications to a preferred WAN port.
- Ensure critical traffic (such as Zoom or Teams) always uses your fastest or most reliable connection.
- Benefit from automatic failover to standard WAN port priority if the preferred port goes down.
This is useful for organizations with multiple ISP uplinks who need predictable egress behavior for performance-sensitive traffic.
For configuration details, refer to Designate WAN ports for breakout apps.
Zero Trust Dashboard has a brand new, AI-powered search functionality. You can search your account by resources (applications, policies, device profiles, settings, etc.), pages, products, and more.
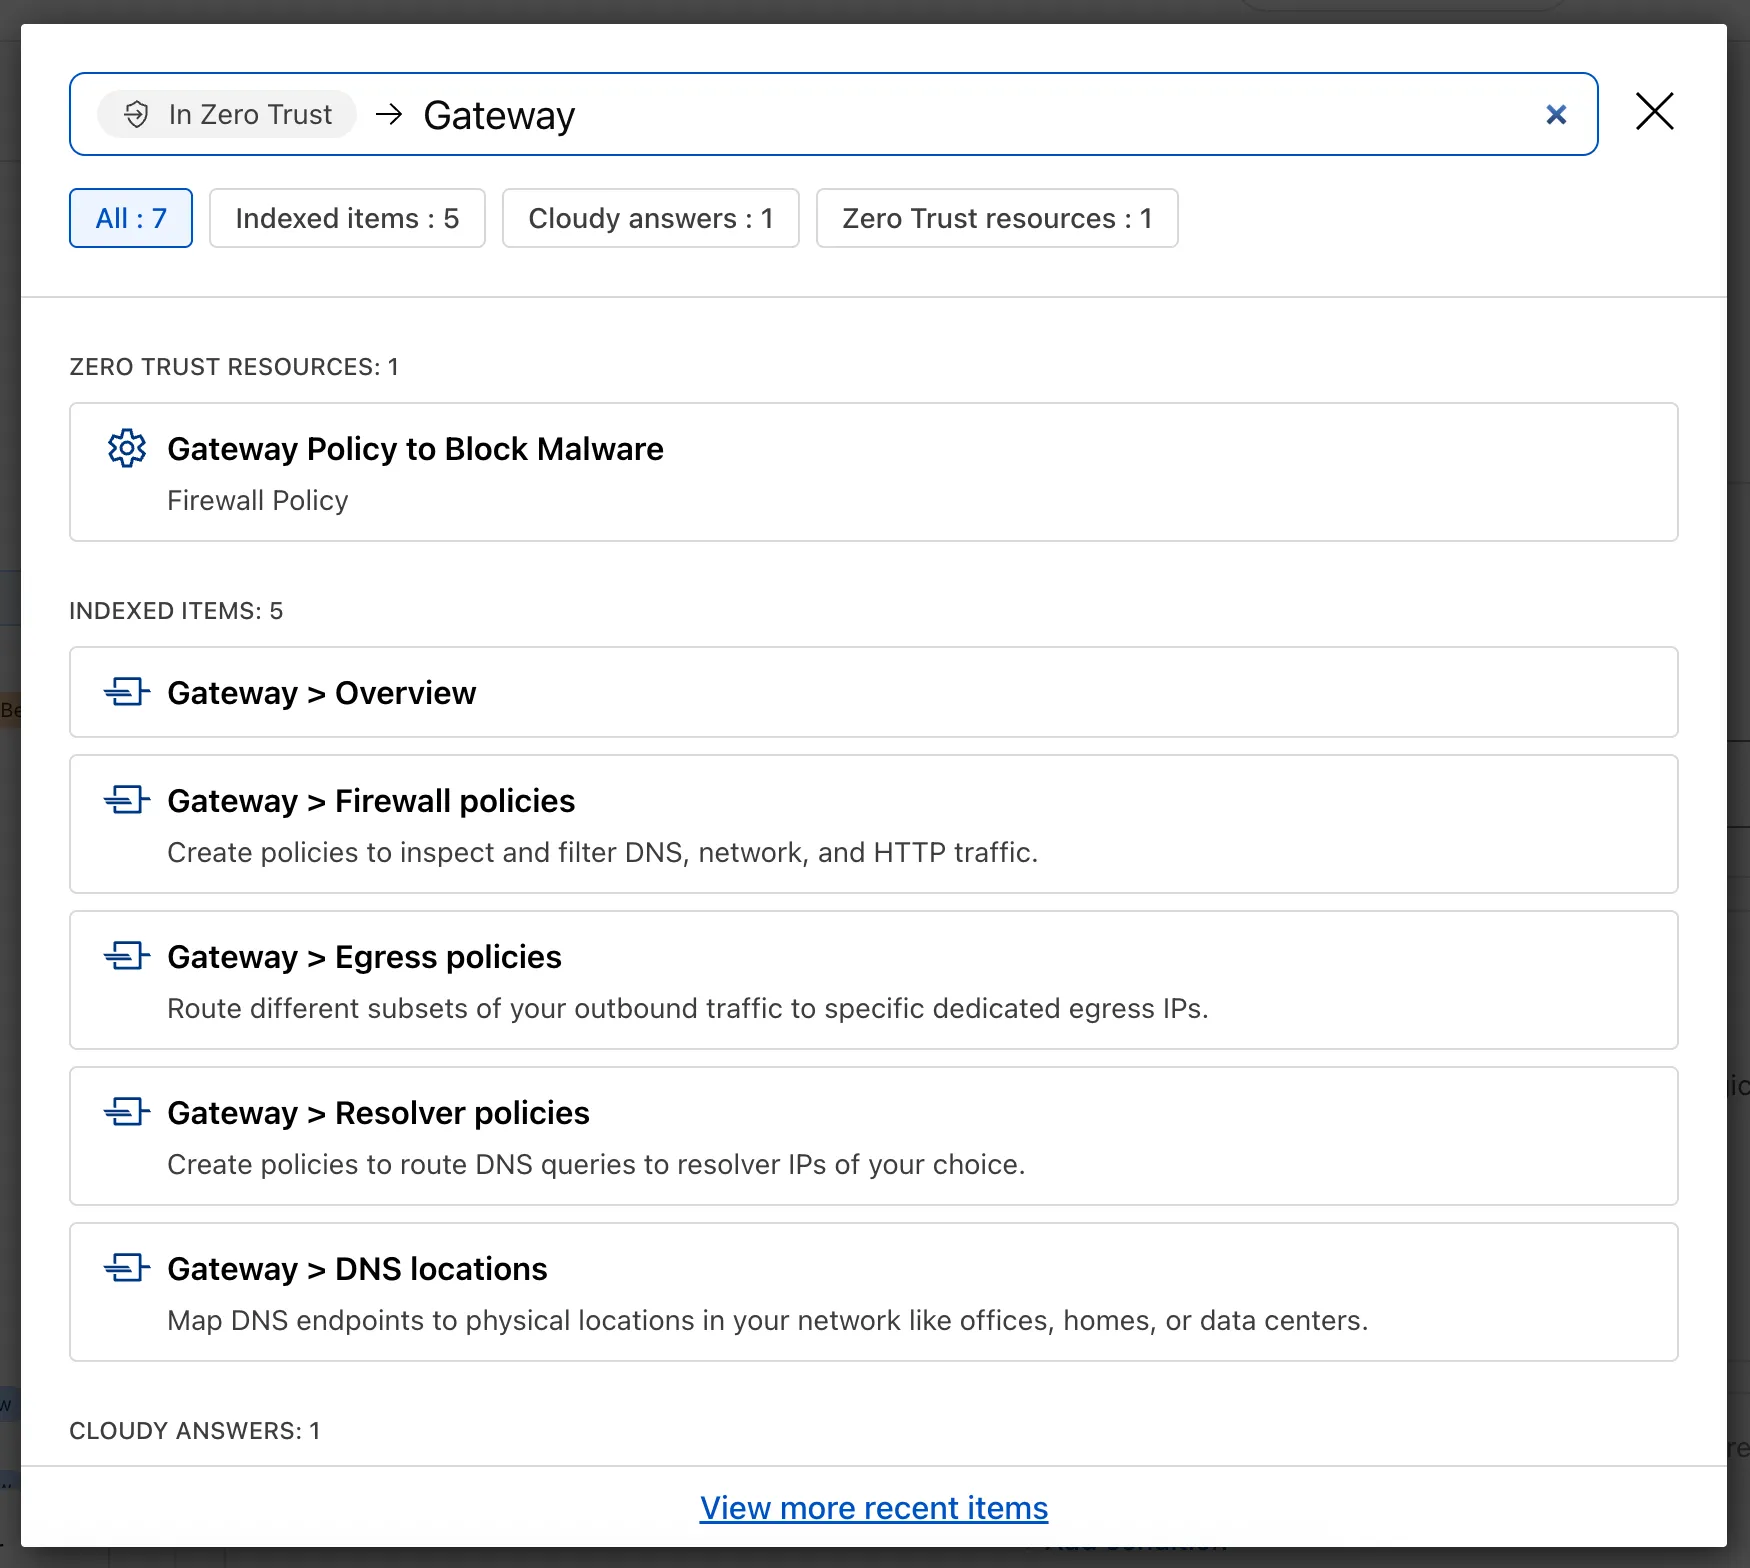
Ask Cloudy — You can also ask Cloudy, our AI agent, questions about Cloudflare Zero Trust. Cloudy is trained on our developer documentation and implementation guides, so it can tell you how to configure functionality, best practices, and can make recommendations.
Cloudy can then stay open with you as you move between pages to build configuration or answer more questions.
Find Recents — Recent searches and Cloudy questions also have a new tab under Zero Trust Overview.
Zero Trust has significantly upgraded its Shadow IT analytics, providing you with unprecedented visibility into your organizations use of SaaS tools. With this dashboard, you can review who is using an application and volumes of data transfer to the application.
You can review these metrics against application type, such as Artificial Intelligence or Social Media. You can also mark applications with an approval status, including Unreviewed, In Review, Approved, and Unapproved designating how they can be used in your organization.
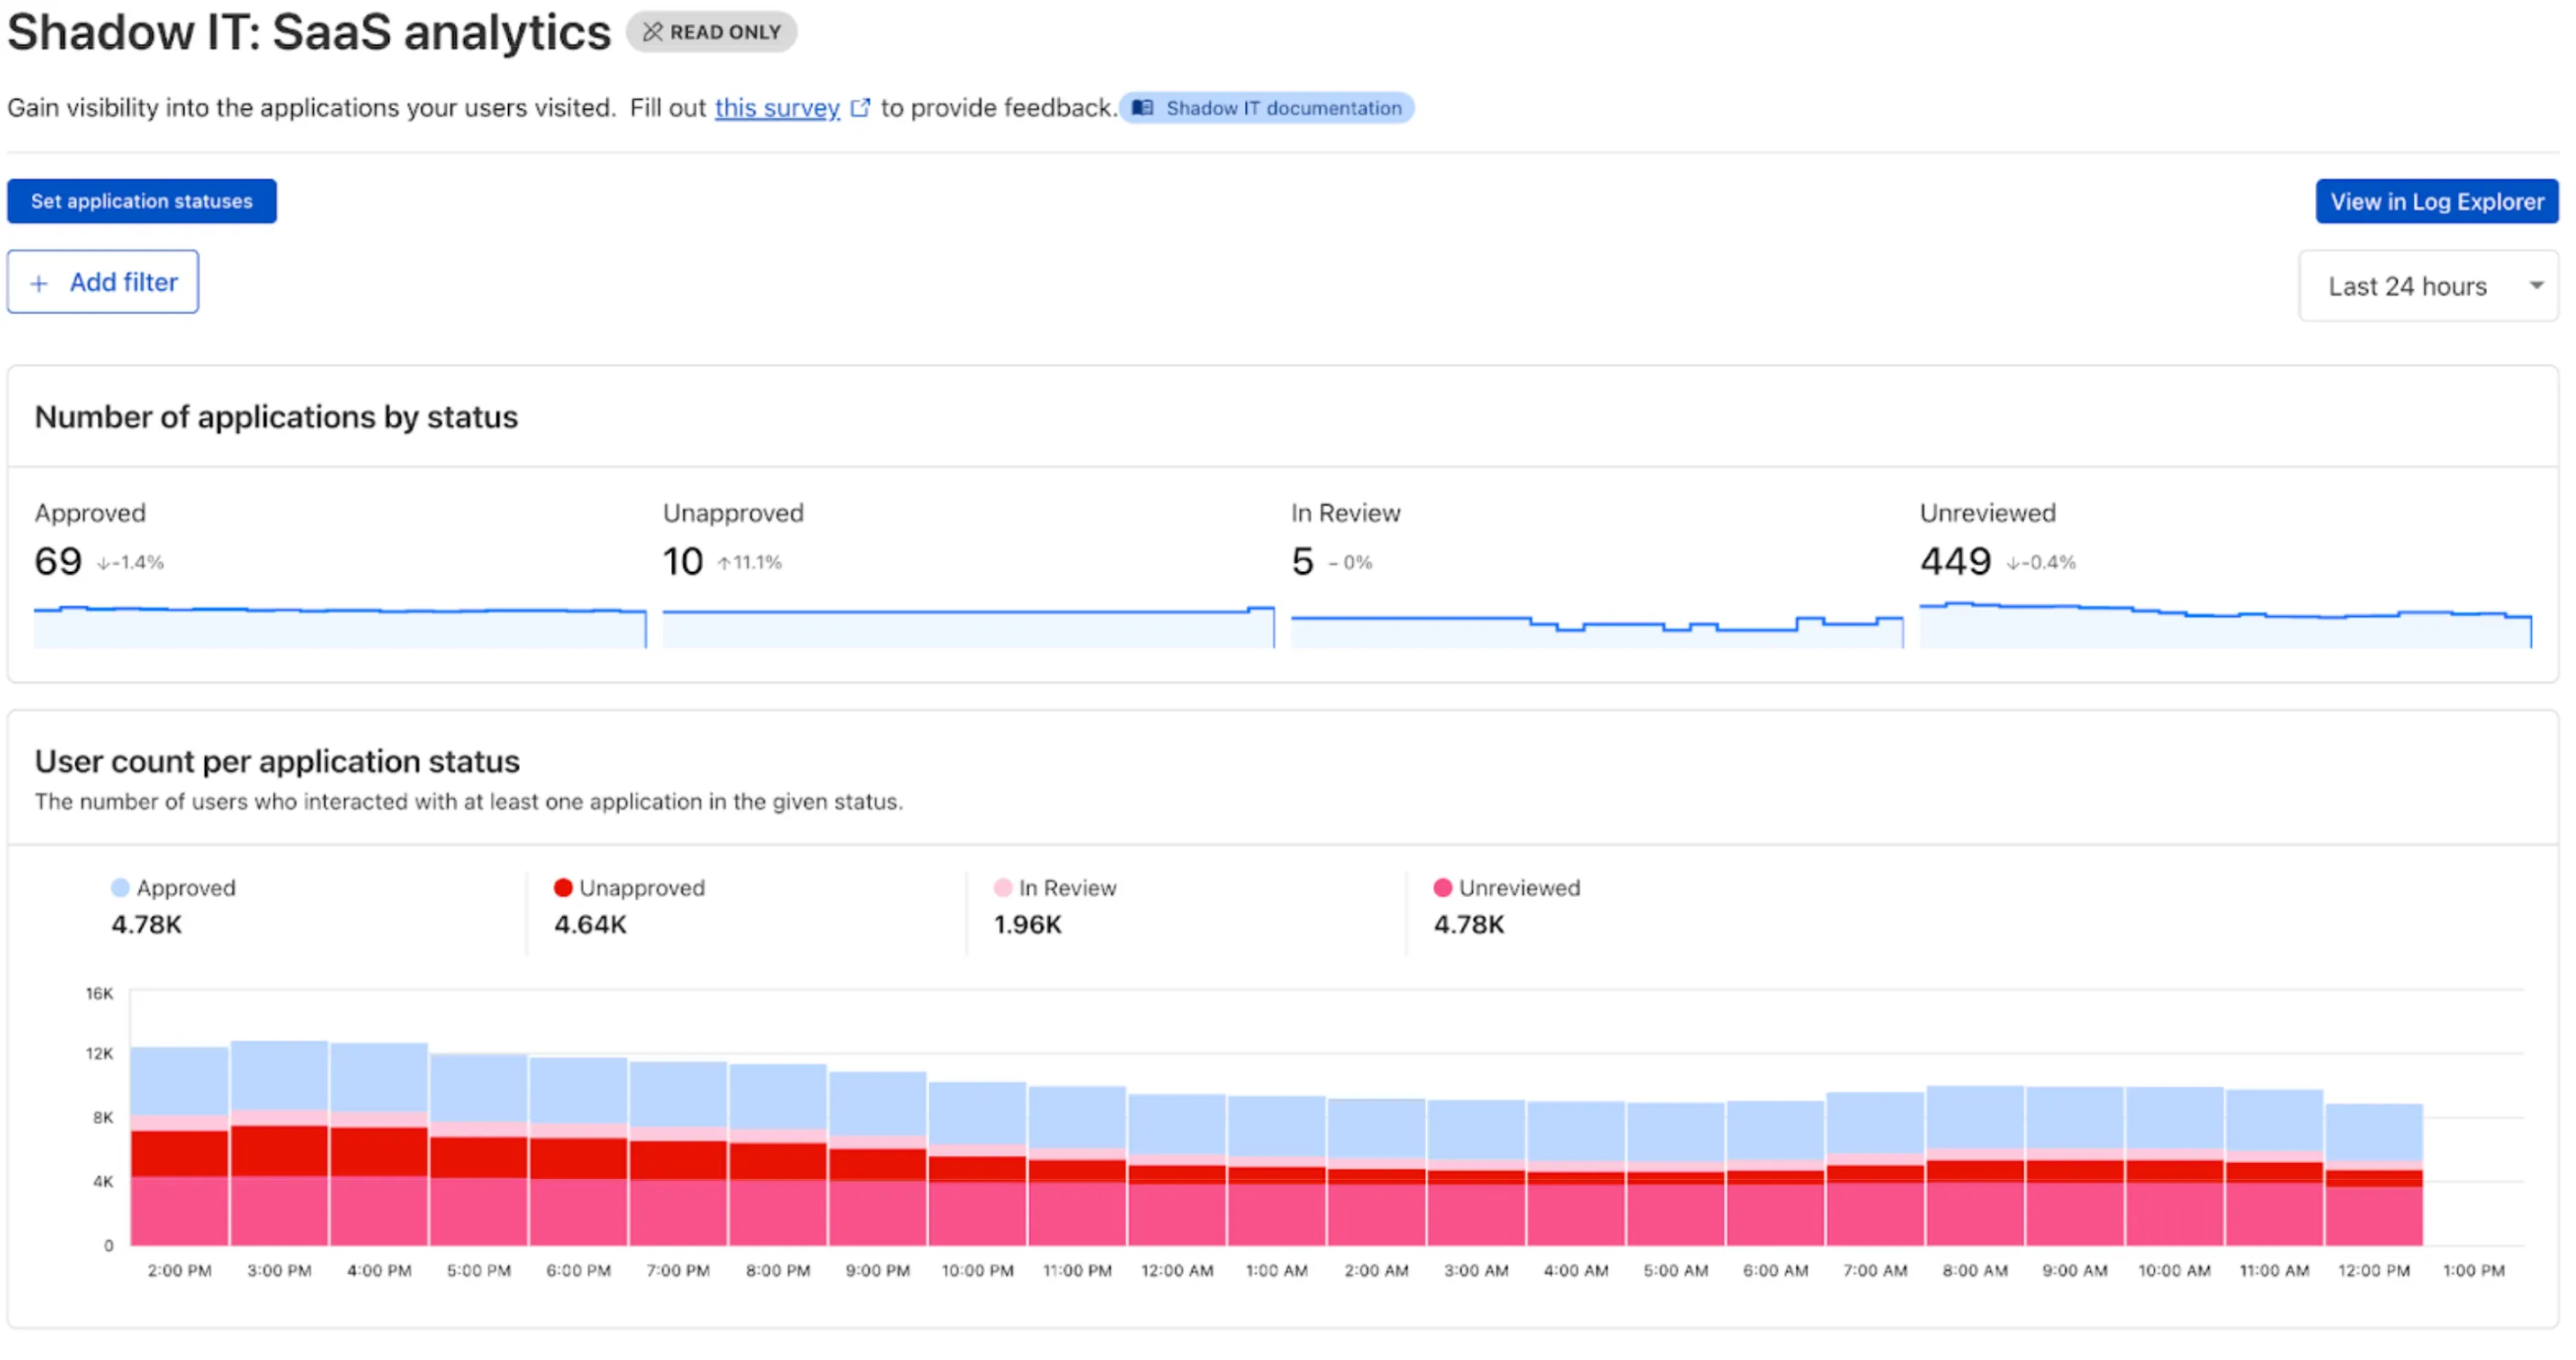
These application statuses can also be used in Gateway HTTP policies, so you can block, isolate, limit uploads and downloads, and more based on the application status.
Both the analytics and policies are accessible in the Cloudflare Zero Trust dashboard ↗, empowering organizations with better visibility and control.
The KVM-based virtual Cloudflare One Appliance is now in open beta with official support for Proxmox VE.
Customers can deploy the virtual appliance on KVM hypervisors to connect branch or data center networks to Cloudflare WAN without dedicated hardware.
For setup instructions, refer to Configure a virtual Cloudflare One Appliance.
Use our brand new onboarding experience for Cloudflare Zero Trust. New and returning users can now engage with a Get Started tab with walkthroughs for setting up common use cases end-to-end.
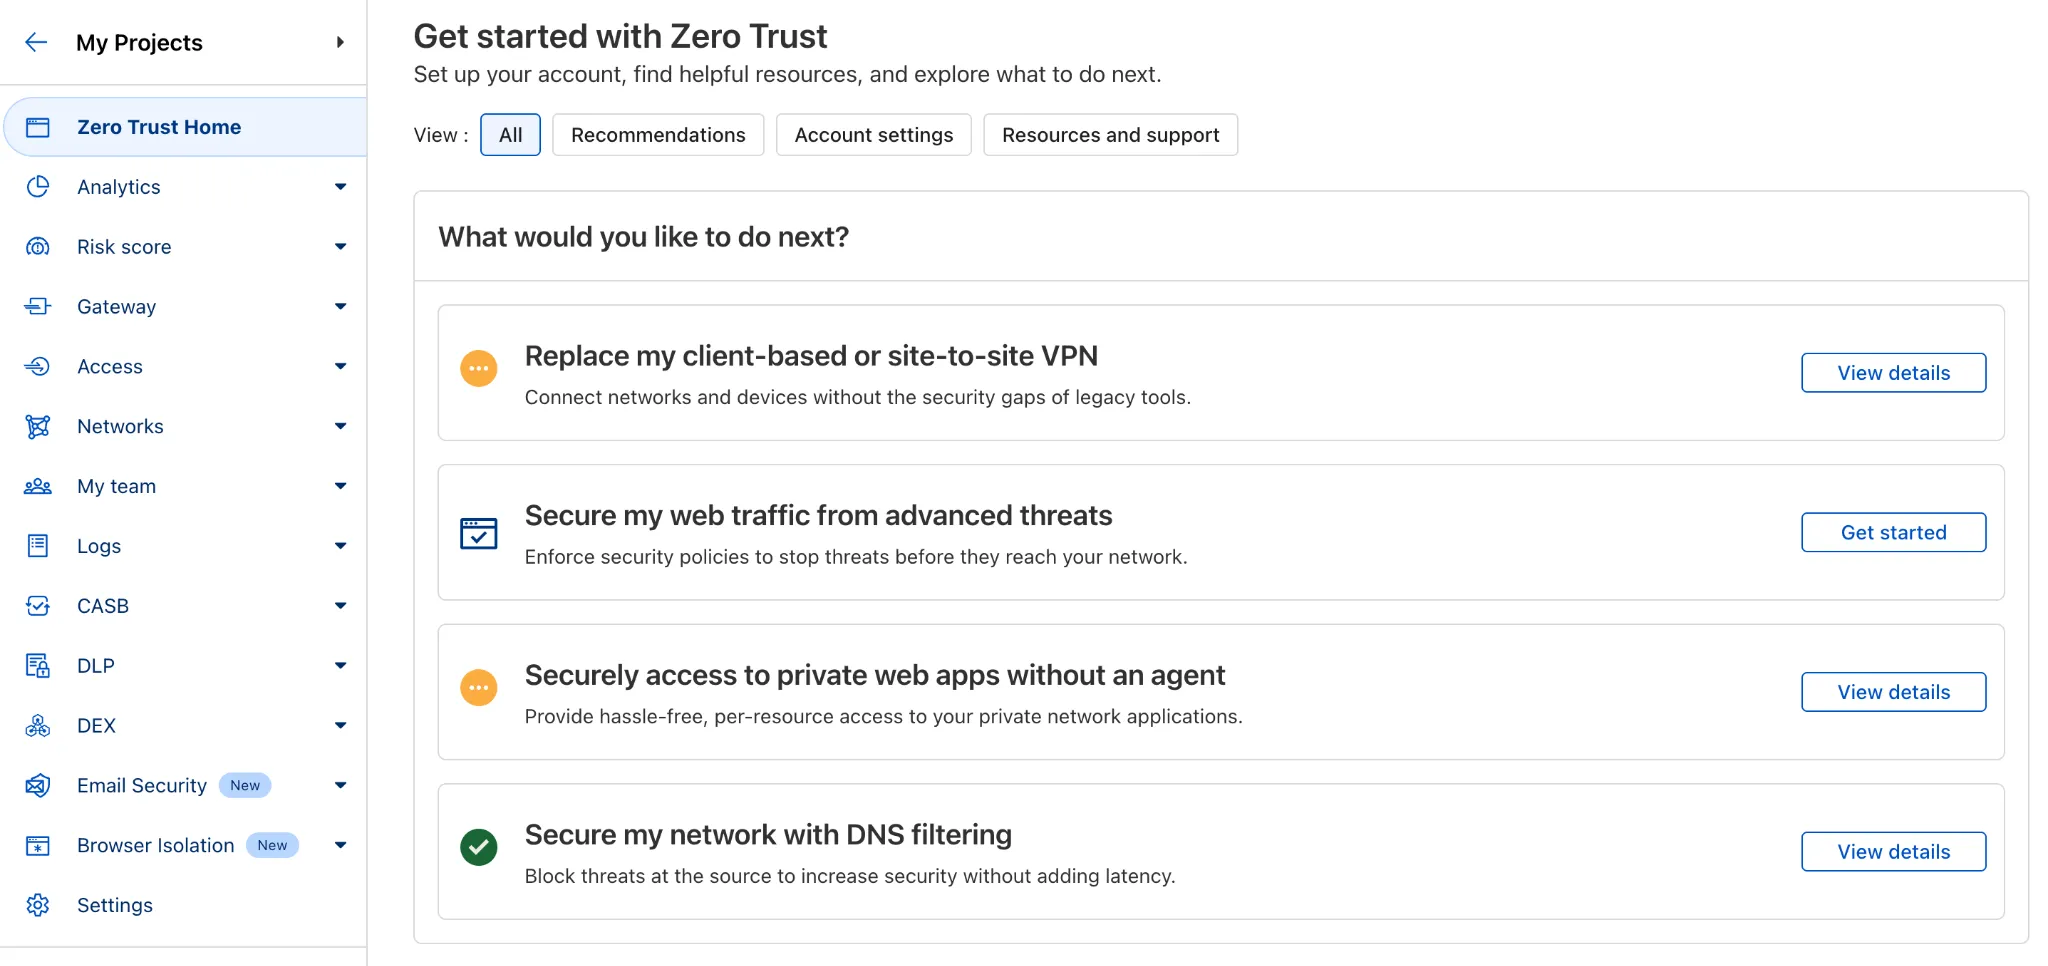
There are eight brand new onboarding guides in total:
- Securely access a private network (sets up device client and Tunnel)
- Device-to-device / mesh networking (sets up and connects multiple device clients)
- Network to network connectivity (sets up and connects multiple WARP Connectors, makes reference to Magic WAN availability for Enterprise)
- Secure web traffic (sets up device client, Gateway, pre-reqs, and initial policies)
- Secure DNS for networks (sets up a new DNS location and Gateway policies)
- Clientless web access (sets up Access to a web app, Tunnel, and public hostname)
- Clientless SSH access (all the same + the web SSH experience)
- Clientless RDP access (all the same + RDP-in-browser)
Each flow walks the user through the steps to configure the essential elements, and provides a “more details” panel with additional contextual information about what the user will accomplish at the end, along with why the steps they take are important.
Try them out now in the Zero Trust dashboard ↗!
Cloudy, Cloudflare's AI Agent, will now automatically summarize your Access and Gateway block logs.
In the log itself, Cloudy will summarize what occurred and why. This will be helpful for quick troubleshooting and issue correlation.
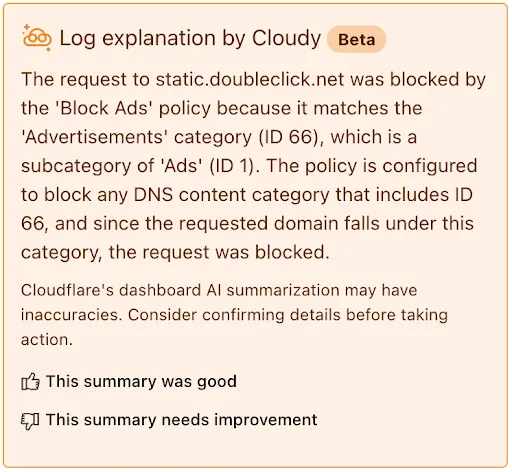
If you have feedback about the Cloudy summary - good or bad - you can provide that right from the summary itself.
Cloudflare Zero Trust customers can use the App Library to get full visibility over the SaaS applications that they use in their Gateway policies, CASB integrations, and Access for SaaS applications.
App Library, found under My Team, makes information available about all Applications that can be used across the Zero Trust product suite.
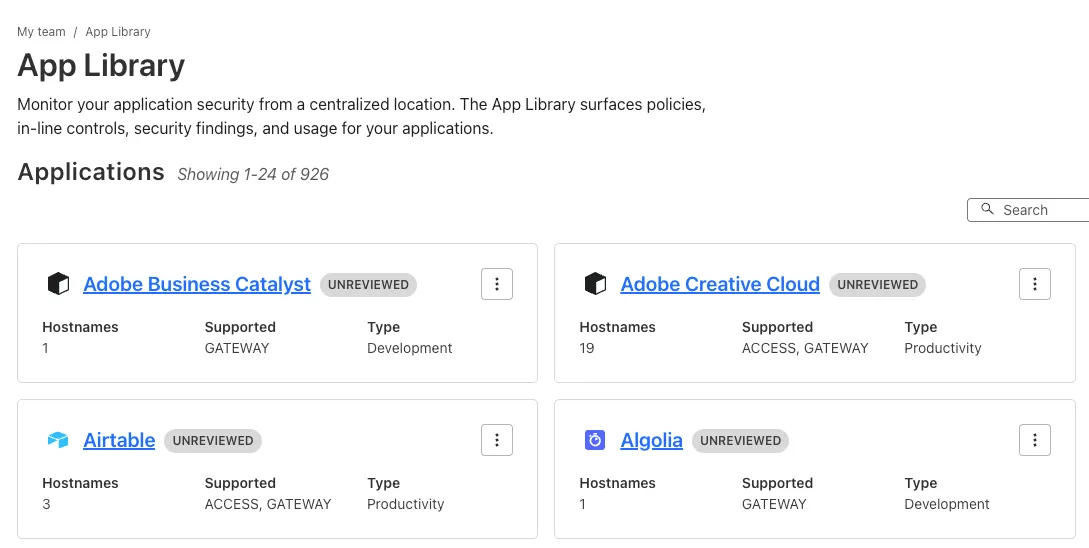
You can use the App Library to see:
- How Applications are defined
- Where they are referenced in policies
- Whether they have Access for SaaS configured
- Review their CASB findings and integration status.
Within individual Applications, you can also track their usage across your organization, and better understand user behavior.
Zero Trust now includes Data security analytics, providing you with unprecedented visibility into your organization sensitive data.
The new dashboard includes:
-
Sensitive Data Movement Over Time:
- See patterns and trends in how sensitive data moves across your environment. This helps understand where data is flowing and identify common paths.
-
Sensitive Data at Rest in SaaS & Cloud:
- View an inventory of sensitive data stored within your corporate SaaS applications (for example, Google Drive, Microsoft 365) and cloud accounts (such as AWS S3).
-
DLP Policy Activity:
- Identify which of your Data Loss Prevention (DLP) policies are being triggered most often.
- See which specific users are responsible for triggering DLP policies.
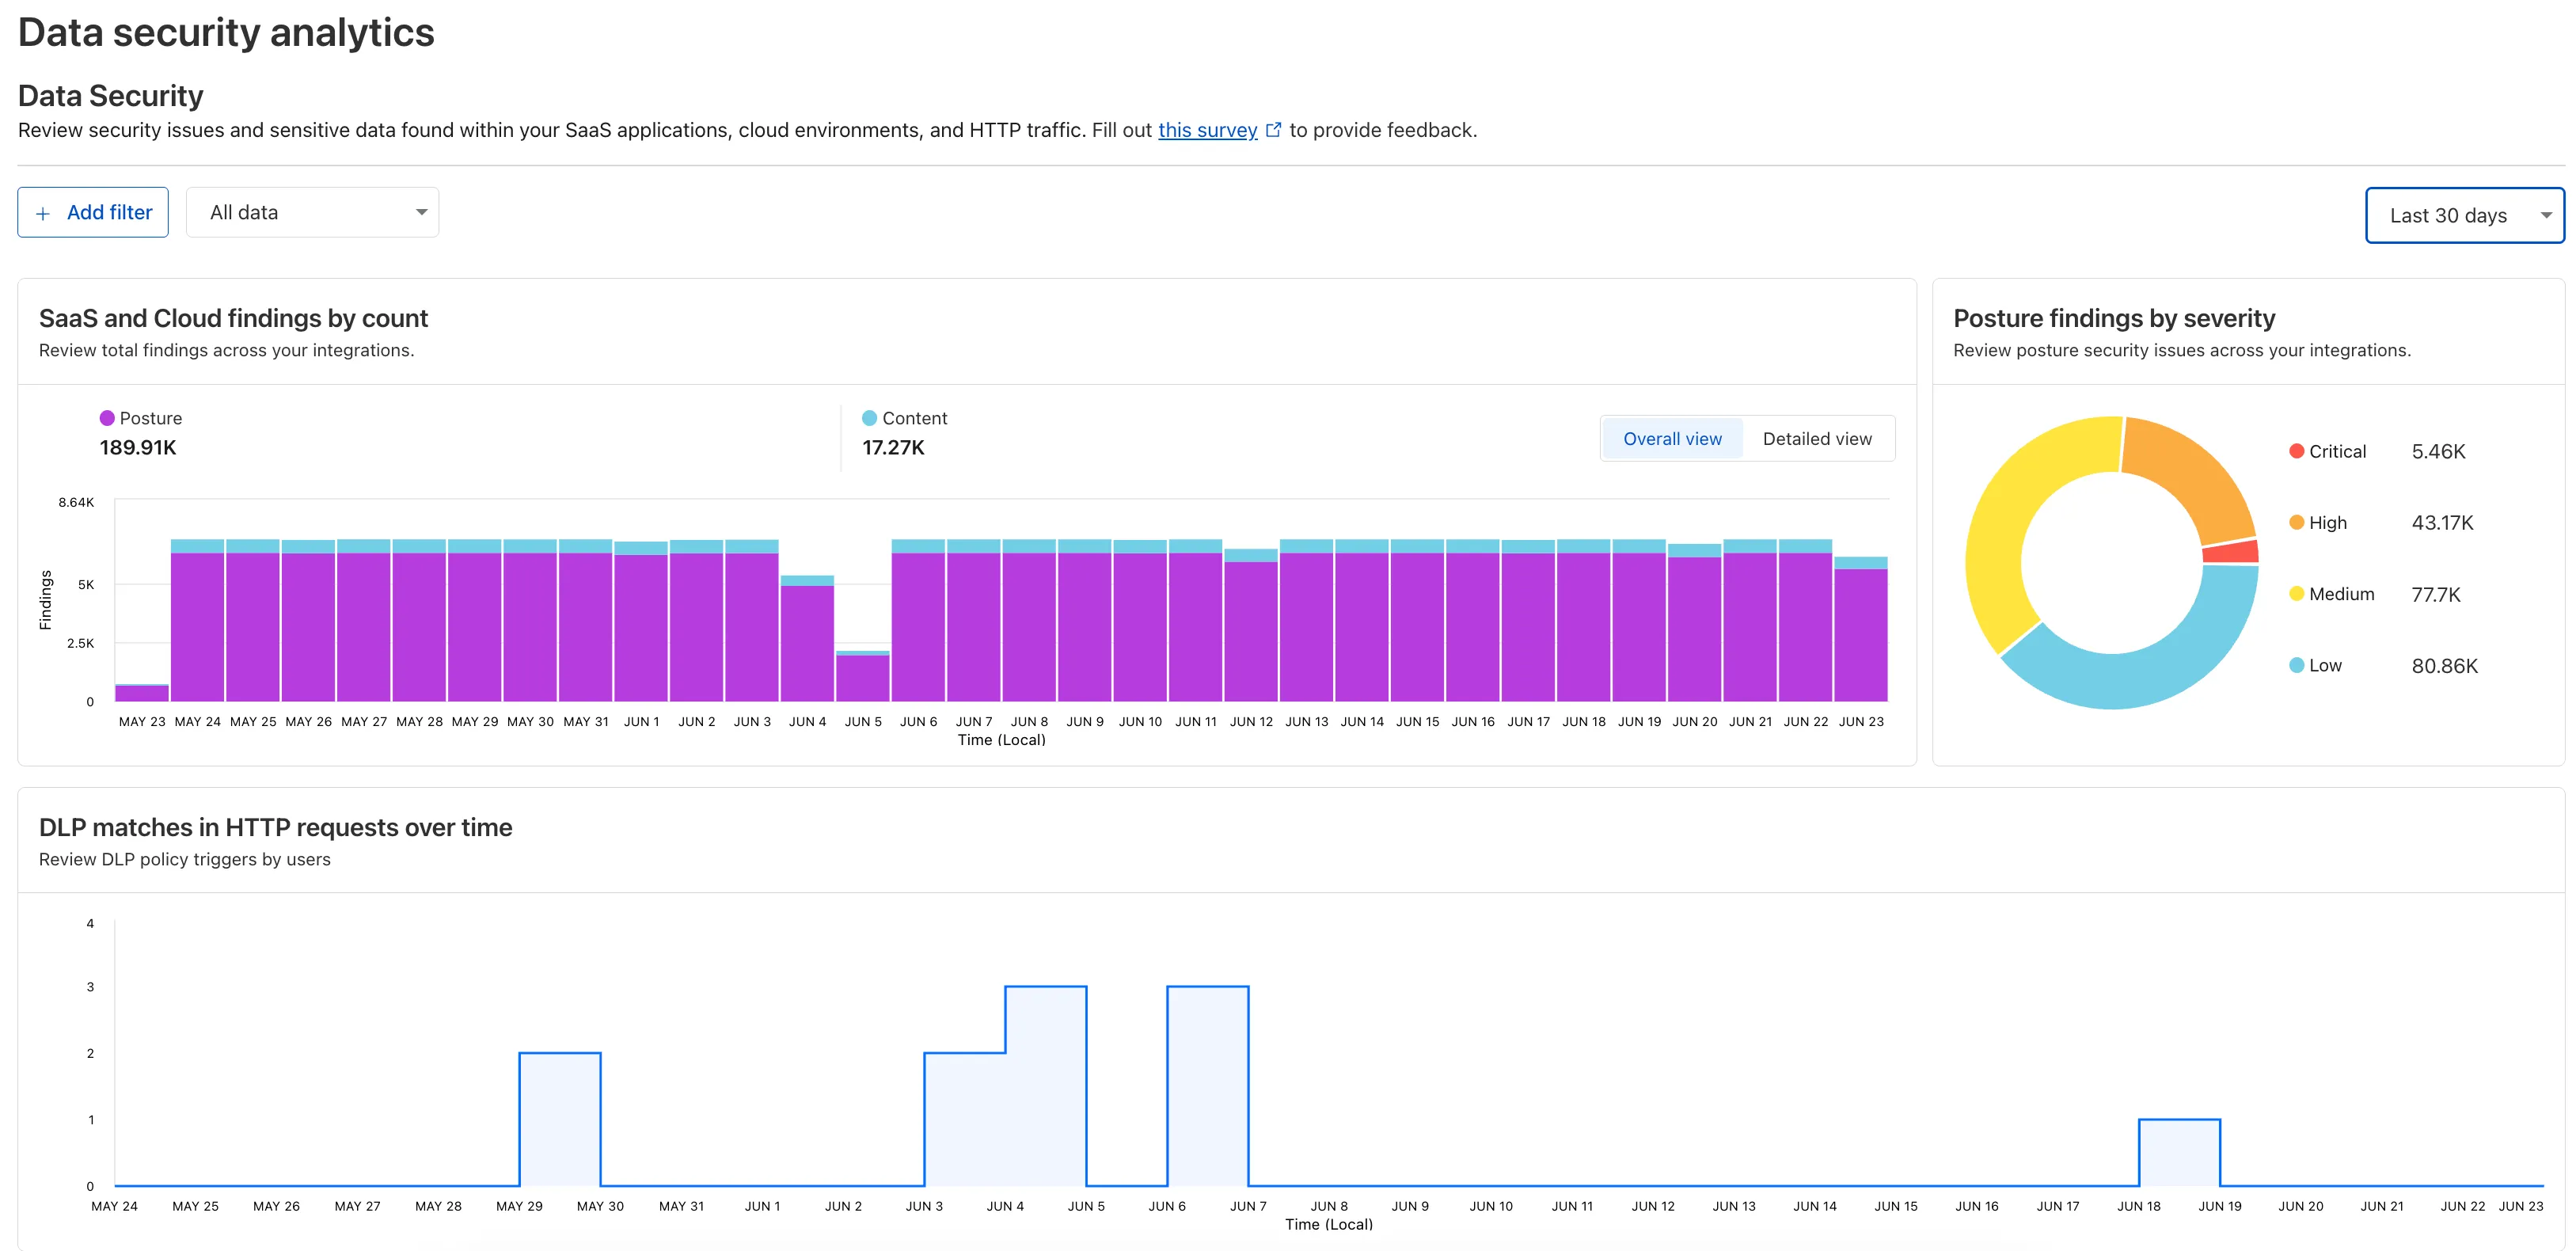
To access the new dashboard, log in to Cloudflare One ↗ and go to Insights on the sidebar.
-
Cloudflare One now offers powerful new analytics dashboards to help customers easily discover available insights into their application access and network activity. These dashboards provide a centralized, intuitive view for understanding user behavior, application usage, and security posture.

Additionally, a new exportable access report is available, allowing customers to quickly view high-level metrics and trends in their application access. A preview of the report is shown below, with more to be found in the report:
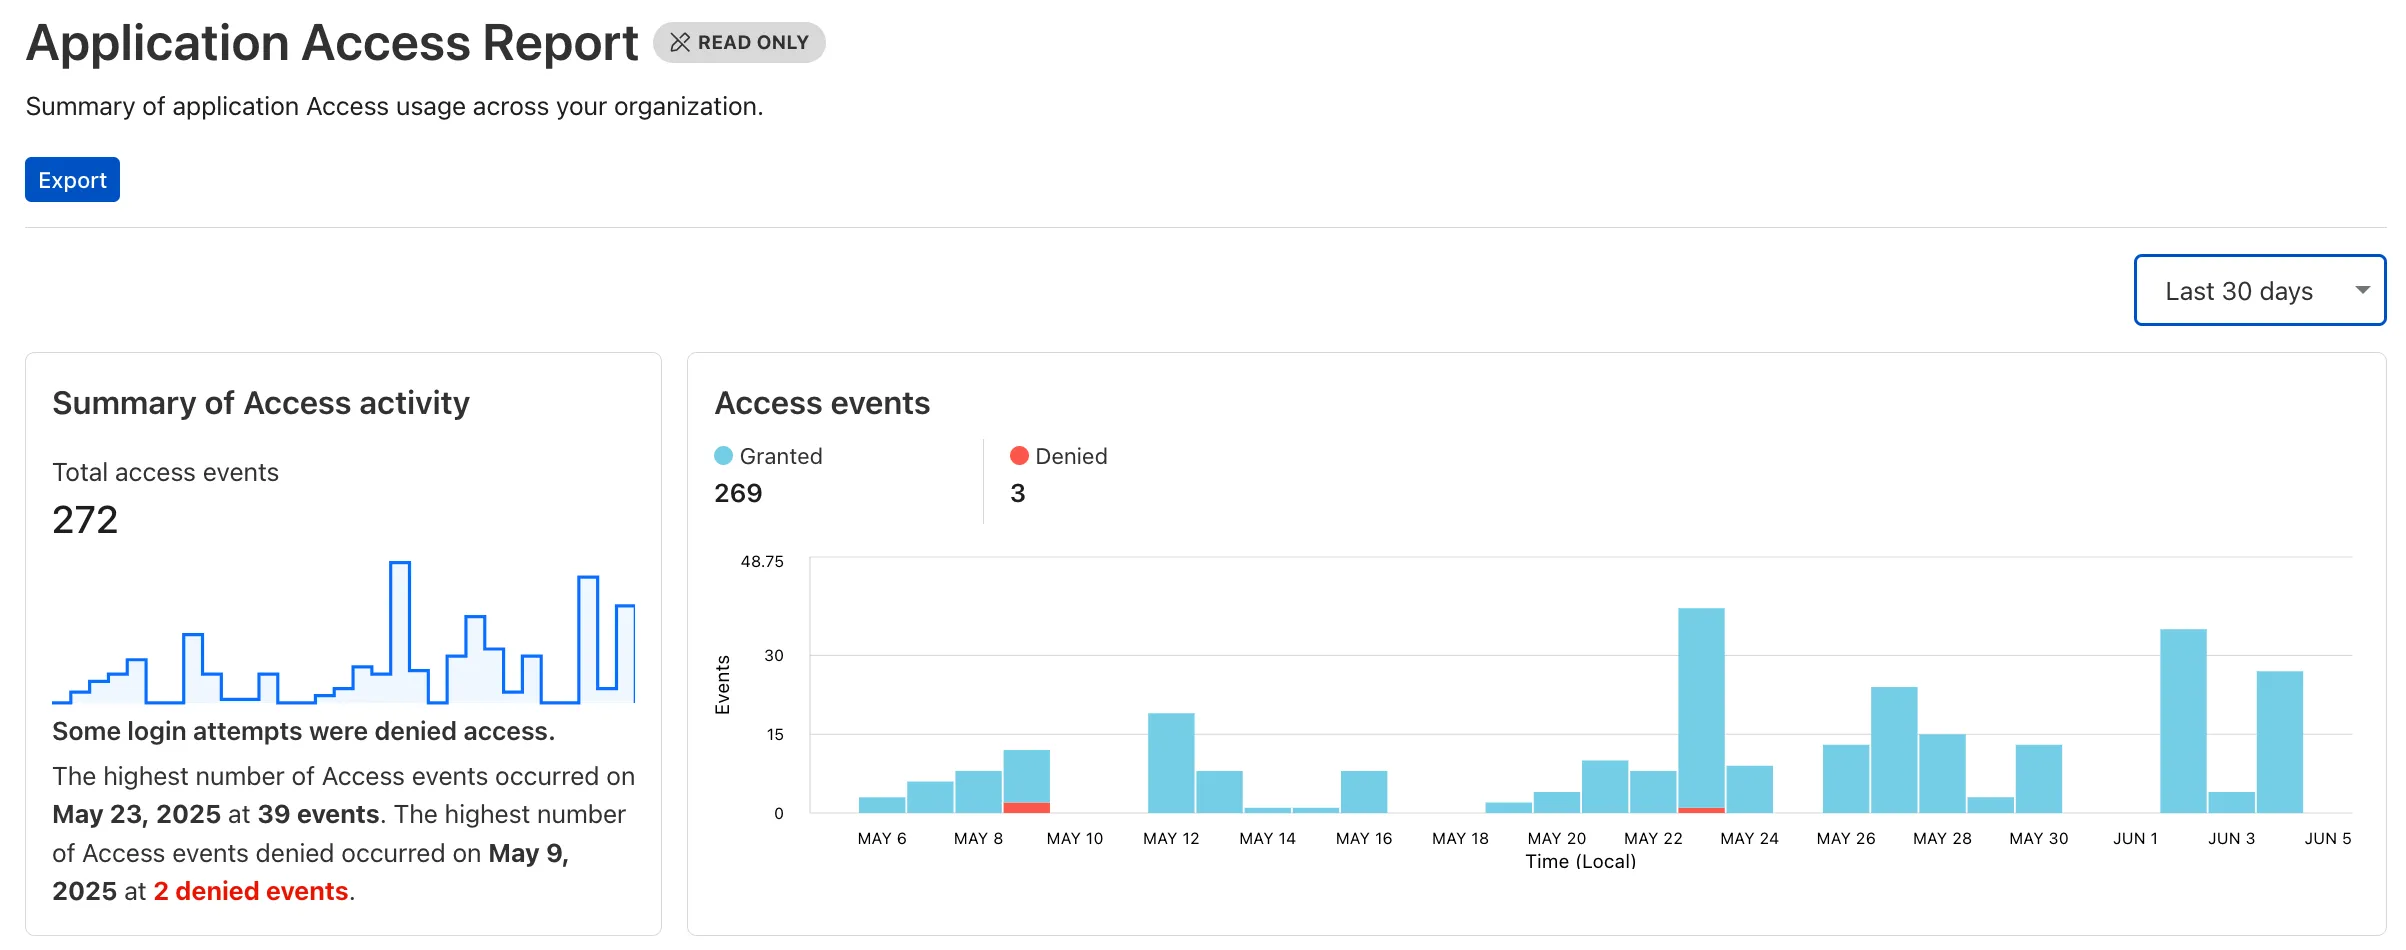
Both features are accessible in the Cloudflare Zero Trust dashboard ↗, empowering organizations with better visibility and control.
Users can now access significant enhancements to Cloudflare Gateway analytics, providing you with unprecedented visibility into your organization's DNS queries, HTTP requests, and Network sessions. These powerful new dashboards enable you to go beyond raw logs and gain actionable insights into how your users are interacting with the Internet and your protected resources.
You can now visualize and explore:
- Patterns Over Time: Understand trends in traffic volume and blocked requests, helping you identify anomalies and plan for future capacity.
- Top Users & Destinations: Quickly pinpoint the most active users, enabling better policy enforcement and resource allocation.
- Actions Taken: See a clear breakdown of security actions applied by Gateway policies, such as blocks and allows, offering a comprehensive view of your security posture.
- Geographic Regions: Gain insight into the global distribution of your traffic.
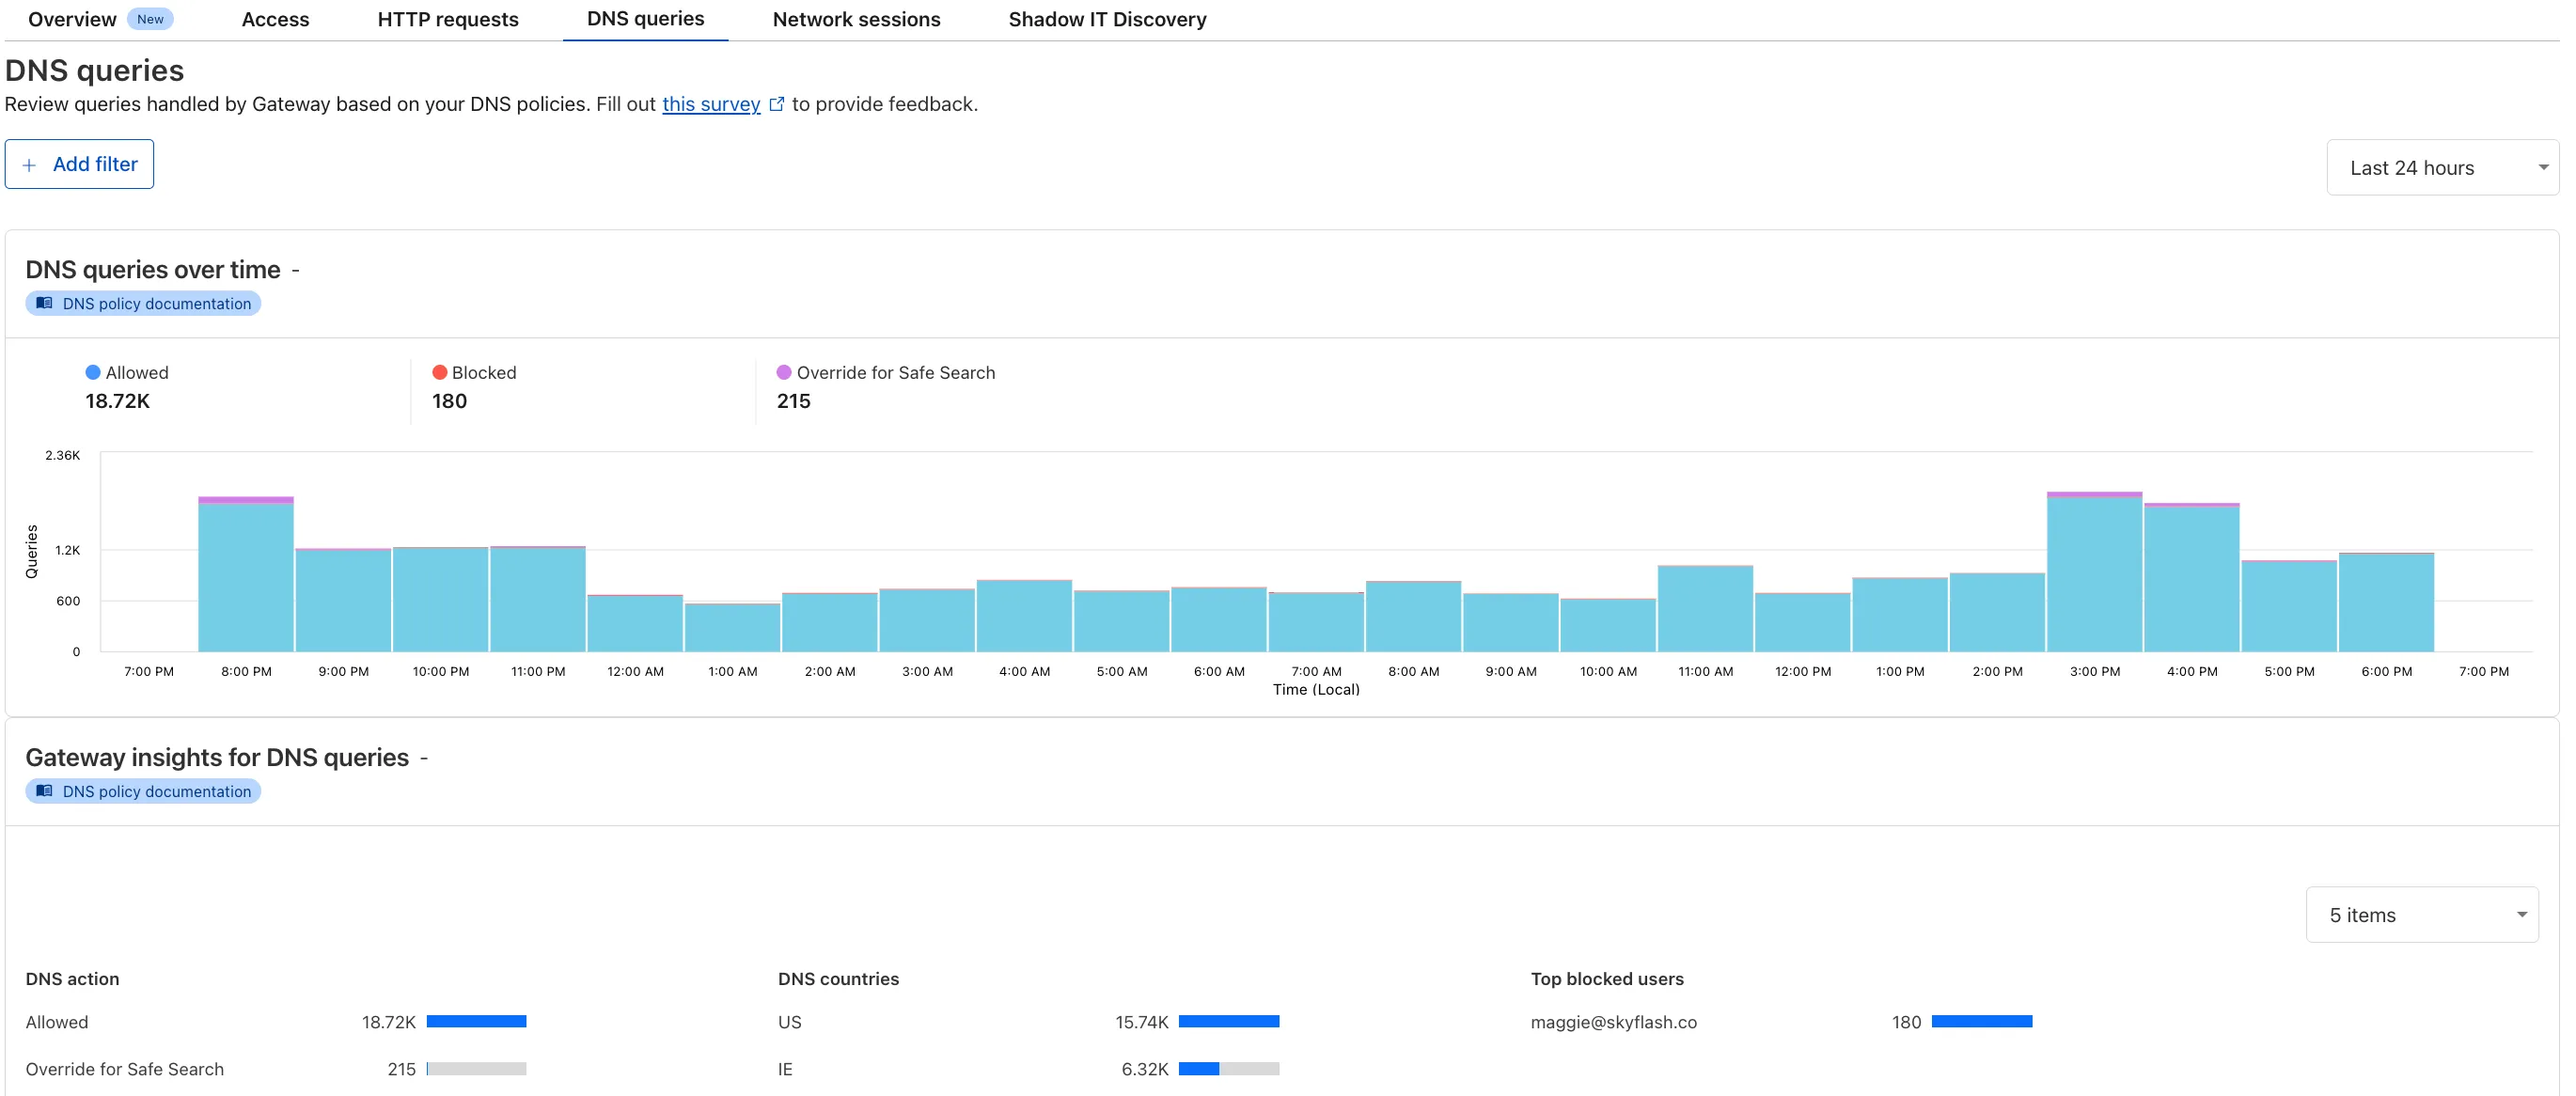
To access the new overview, log in to your Cloudflare Zero Trust dashboard ↗ and go to Analytics in the side navigation bar.
42 new applications have been added for Zero Trust support within the Application Library and Gateway policy enforcement, giving you the ability to investigate or apply inline policies to these applications.
33 of the 42 applications are Artificial Intelligence applications. The others are Human Resources (2 applications), Development (2 applications), Productivity (2 applications), Sales & Marketing, Public Cloud, and Security.
To view all available applications, log in to your Cloudflare Zero Trust dashboard ↗, navigate to the App Library under My Team.
For more information on creating Gateway policies, see our Gateway policy documentation.