
Cloudflare has added a new field to the Gateway DNS Logpush dataset:
- ResponseTimeMs: Total response time of the DNS request in milliseconds.
For the complete field definitions, refer to Gateway DNS dataset.
Cloudflare Logpush now supports BigQuery as a native destination.
Logs from Cloudflare can be sent to Google Cloud BigQuery ↗ via Logpush. The destination can be configured through the Logpush UI in the Cloudflare dashboard or by using the Logpush API.
For more information, refer to the Destination Configuration documentation.
Radar now features an expanded Routing section ↗ with dedicated sub-pages, providing a more organized and in-depth view of the global routing ecosystem. This restructuring lays the groundwork for additional routing features and widgets coming in the near future.
The single Routing page has been split into three focused sub-pages:
- Overview ↗ — Routing statistics, IP address space trends, BGP announcements, and the new Top 100 ASes ranking.
- RPKI ↗ — RPKI validation status, ASPA deployment trends, and per-ASN ASPA provider details.
- Anomalies ↗ — BGP route leaks, origin hijacks, and Multi-Origin AS (MOAS) conflicts.
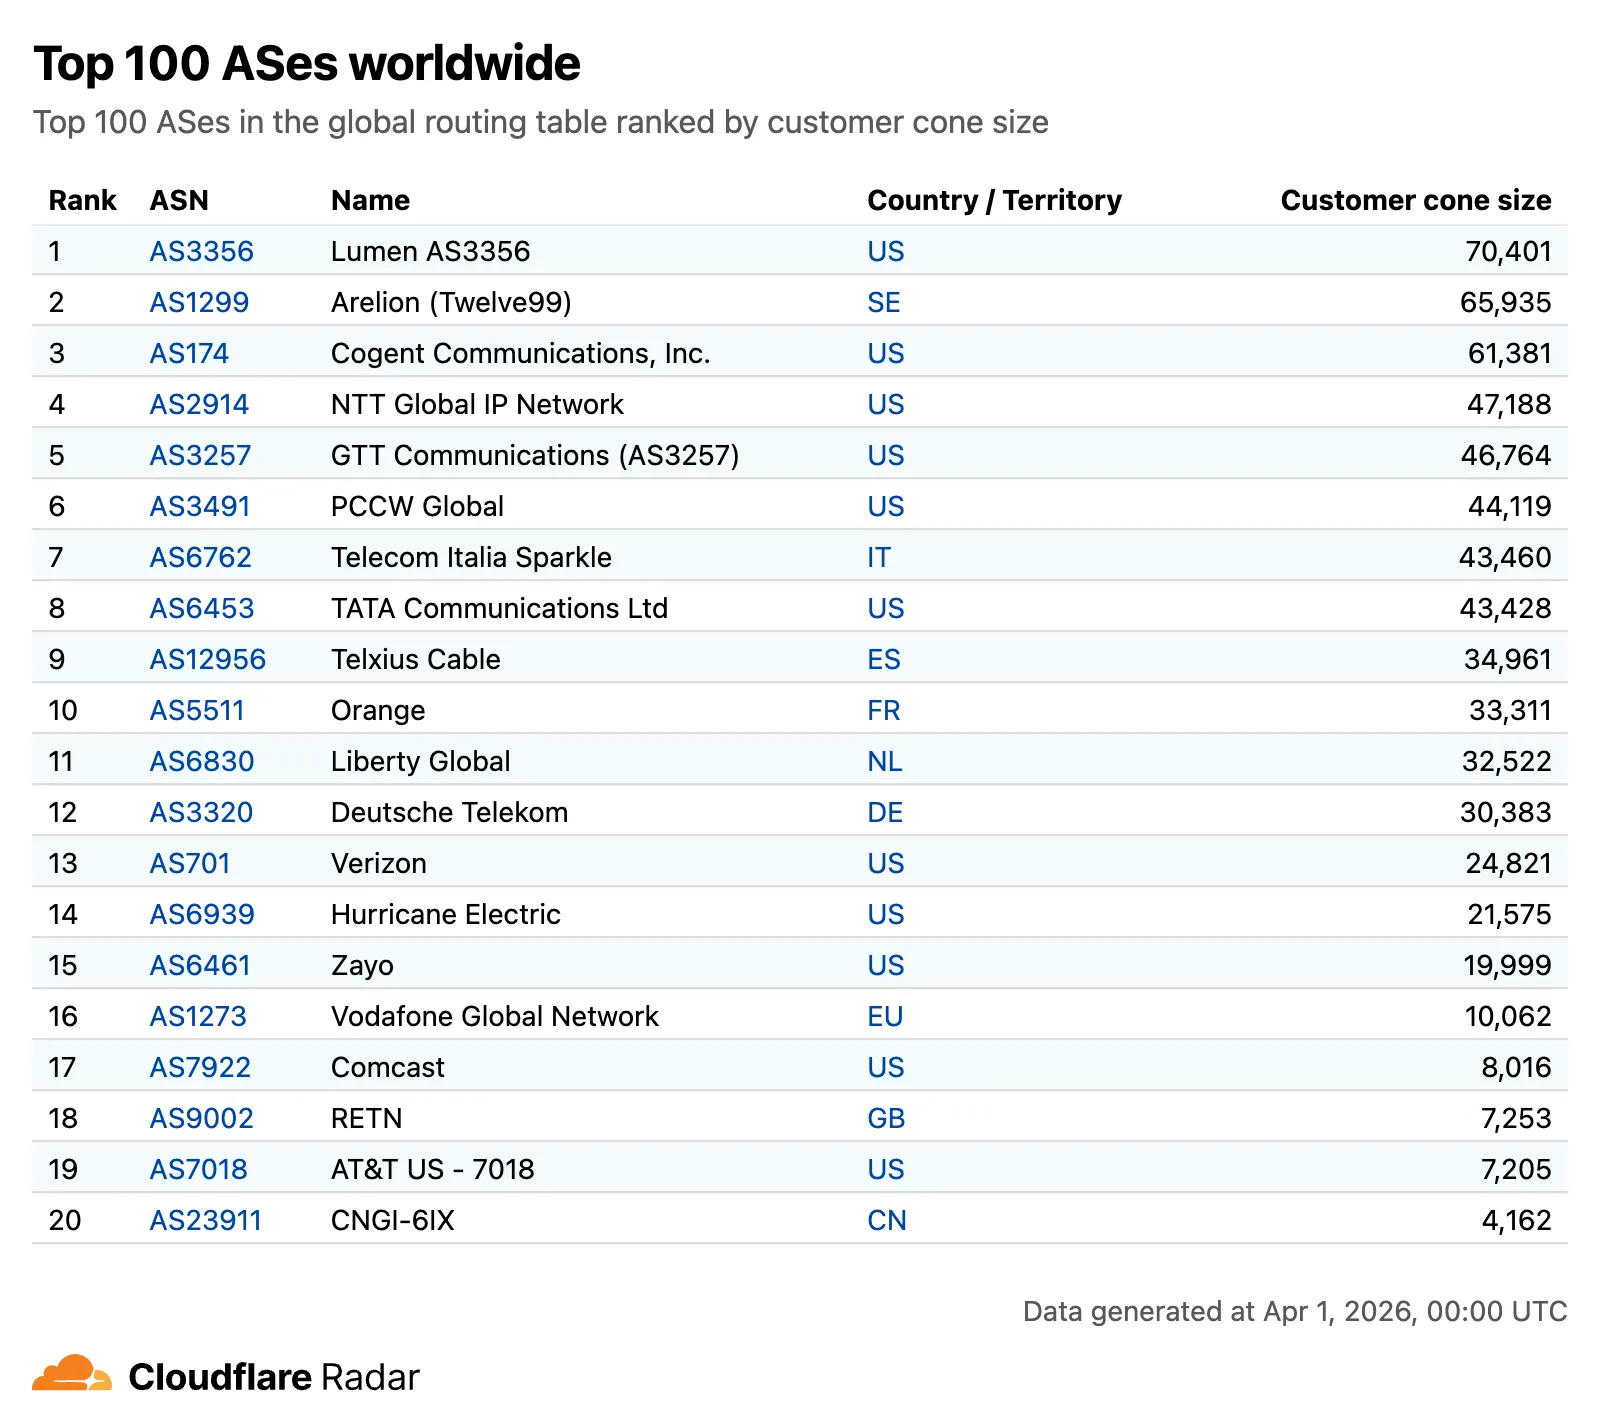
The routing overview now includes a Top 100 ASes table ranking autonomous systems by customer cone size, IPv4 address space, or IPv6 address space. Users can switch between rankings using a segmented control.
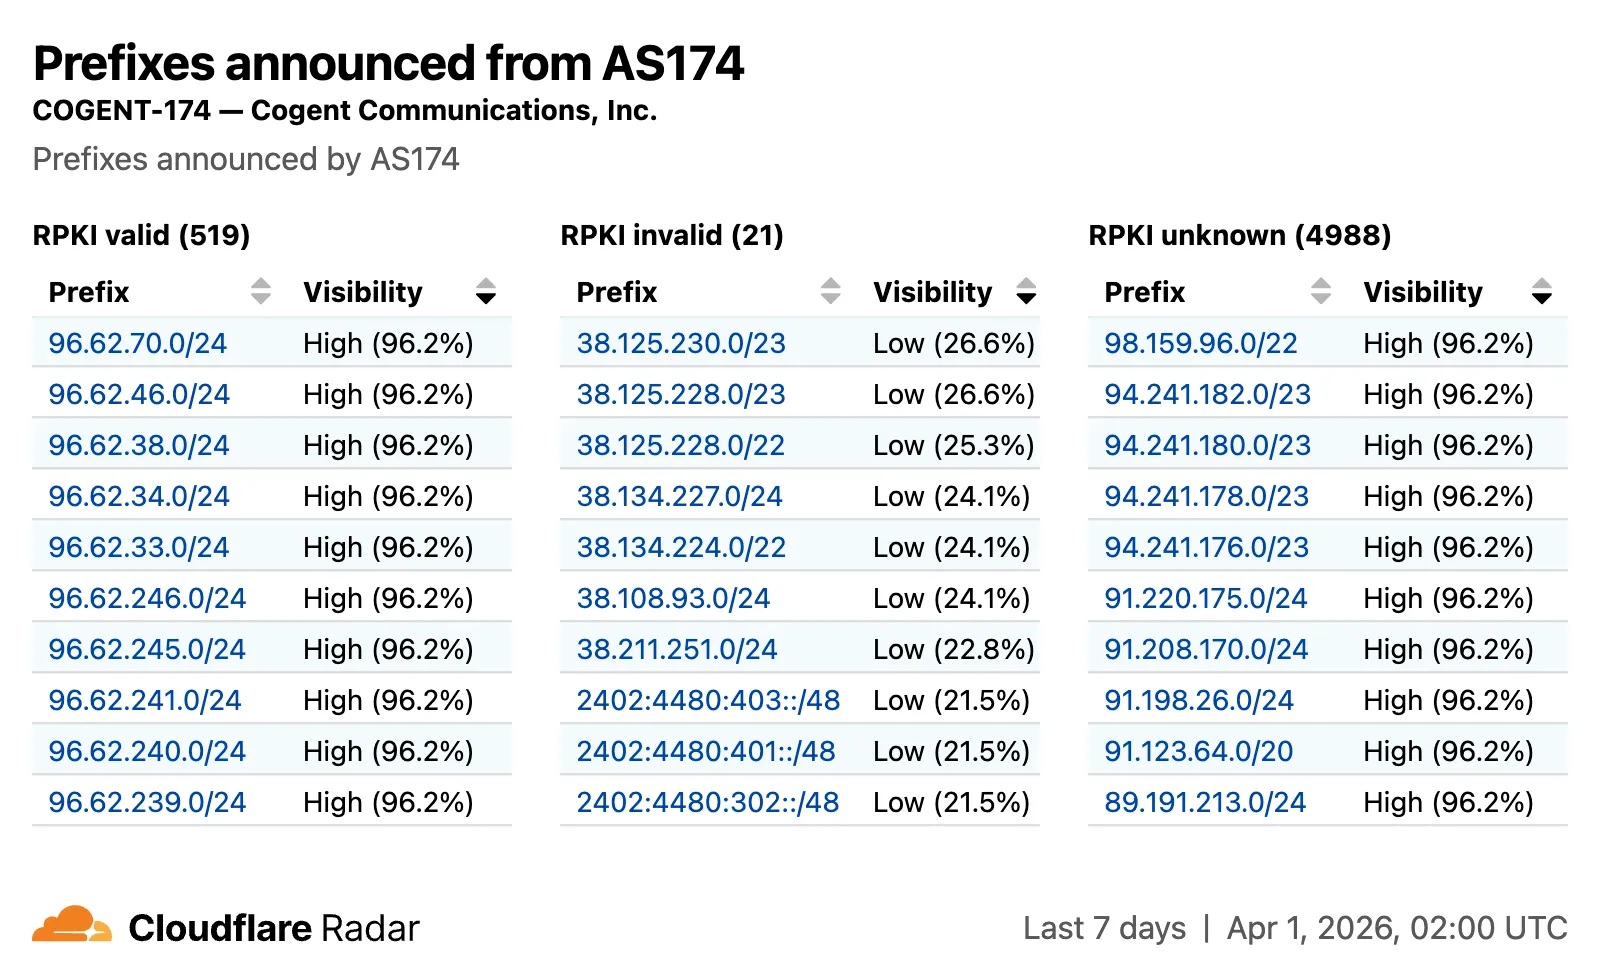
The RPKI sub-page introduces a RPKI validation view for per-ASN pages, showing prefixes grouped by RPKI validation status (Valid, Invalid, Unknown) with visibility scores.
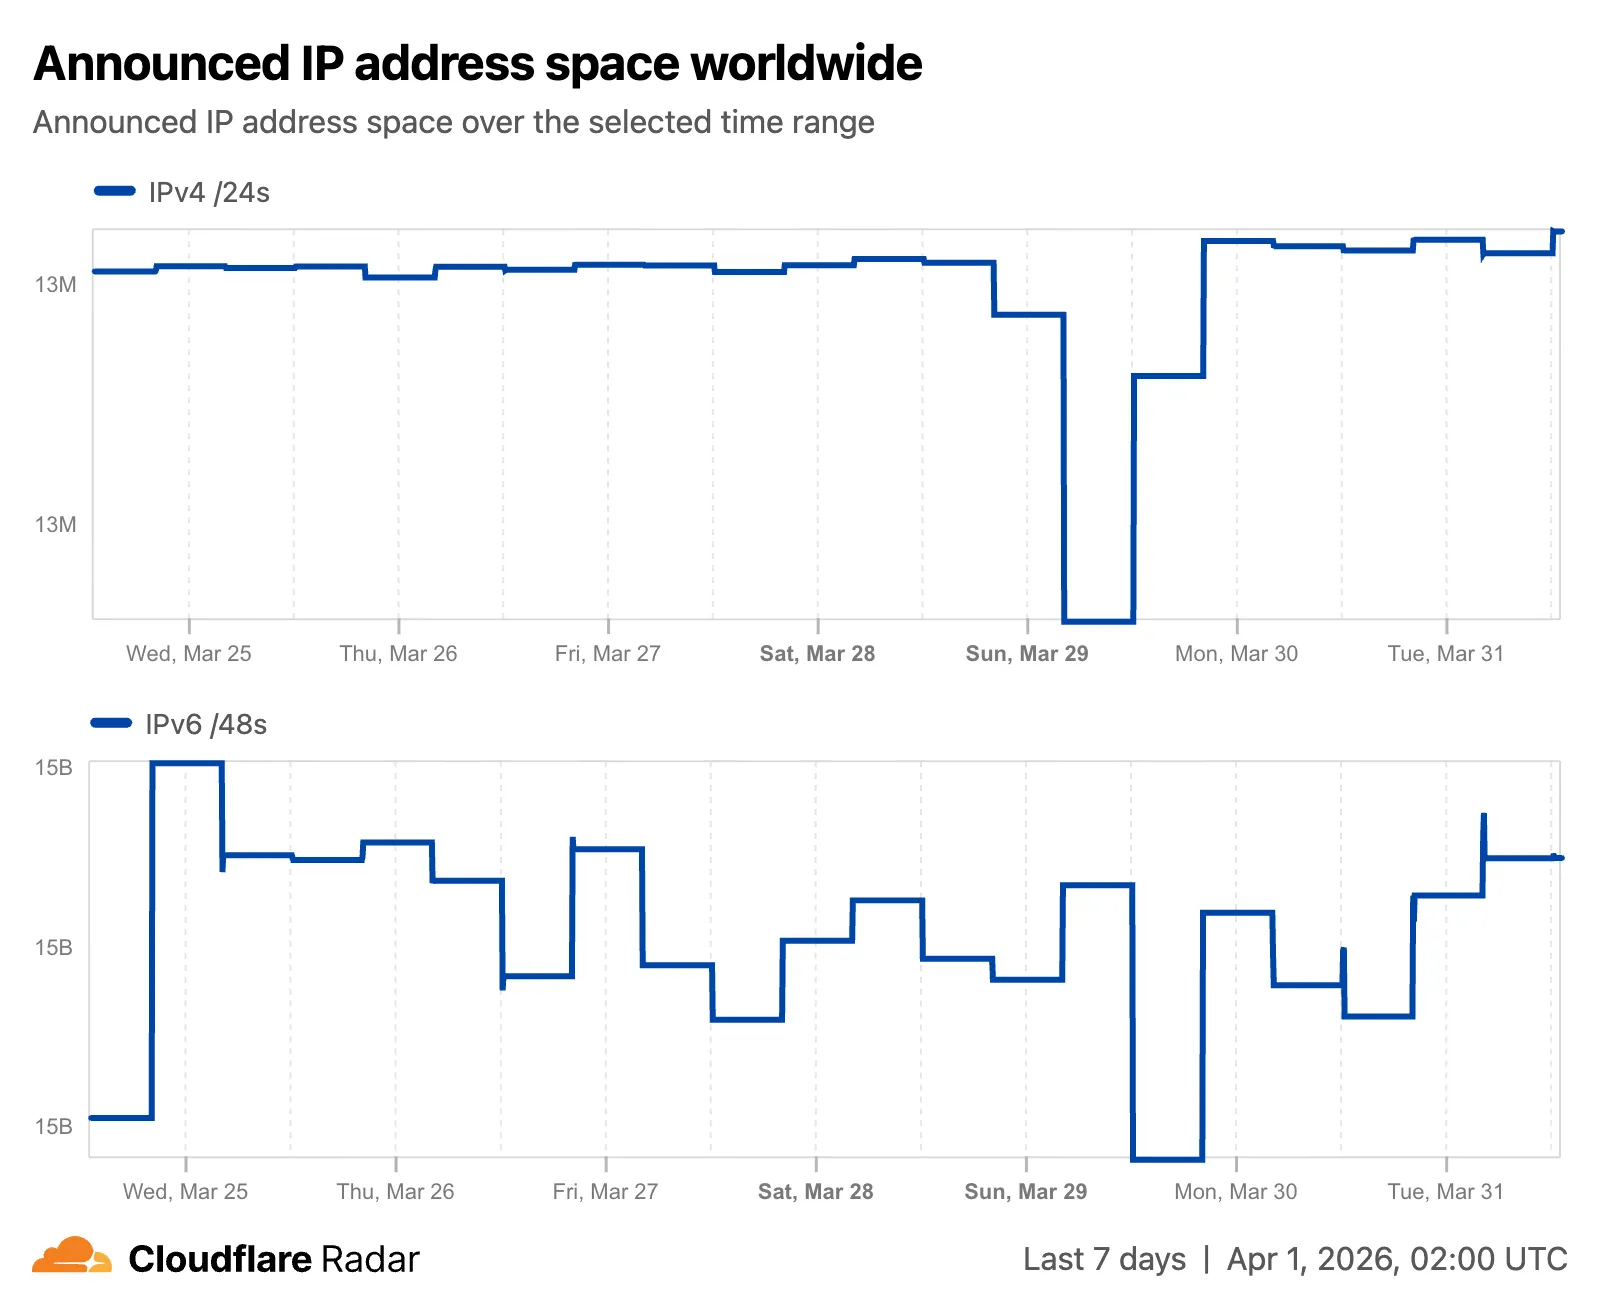
The IP address space ↗ chart now displays both IPv4 and IPv6 trends stacked vertically and is available on global, country, and AS views.
Check out the Radar routing section ↗ to explore the data, and stay tuned for more routing insights coming soon.
Radar ships several improvements to the URL Scanner ↗ that make scan reports more informative and easier to share:
- Live screenshots — the summary card now includes an option to capture a live screenshot of the scanned URL on demand using the Browser Rendering API.
- Save as PDF — a new button generates a print-optimized document aggregating all tab contents (Summary, Security, Network, Behavior, and Indicators) into a single file.
- Download as JSON — raw scan data is available as a JSON download for programmatic use.
- Redesigned summary layout — page information and security details are now displayed side by side with the screenshot, with a layout that adapts to narrower viewports.
- File downloads — downloads are separated into a dedicated card with expandable rows showing each file's source URL and SHA256 hash.
- Detailed IP address data — the Network tab now includes additional detail per IP address observed during the scan.
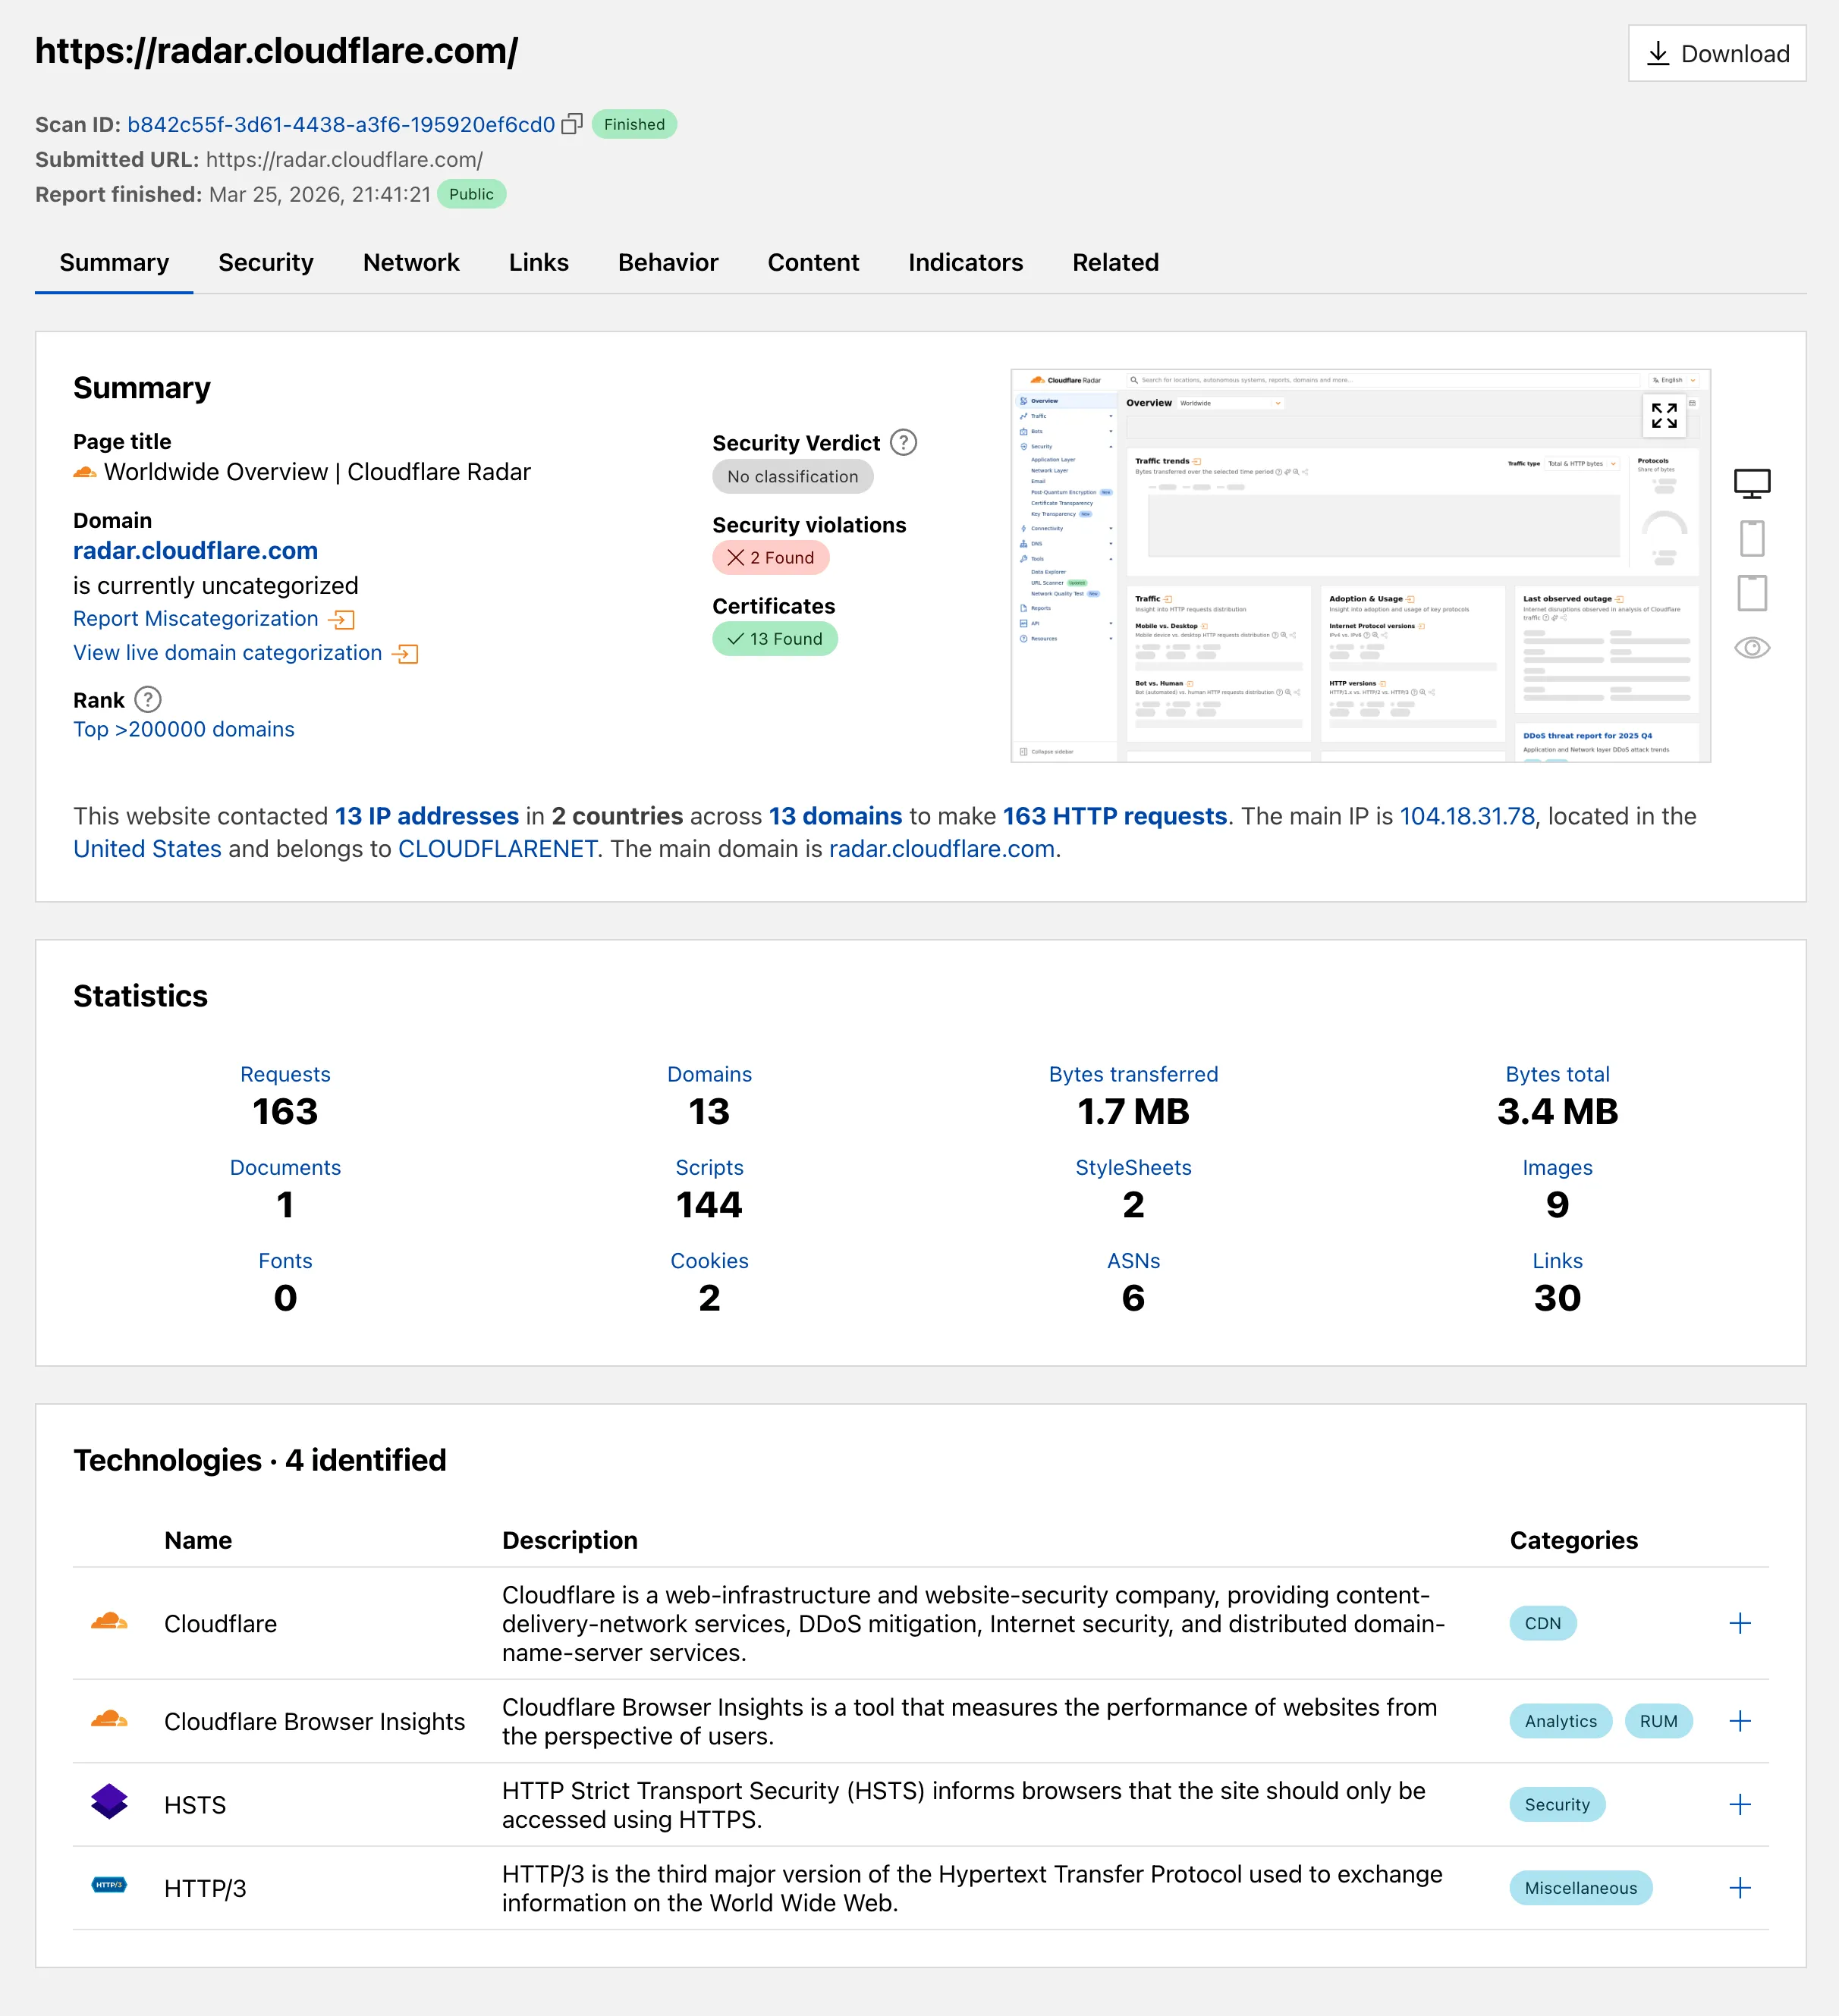
Explore these improvements on the Cloudflare Radar URL Scanner ↗.
Logpush now supports higher-precision timestamp formats for log output. You can configure jobs to output timestamps at millisecond or nanosecond precision. This is available in both the Logpush UI in the Cloudflare dashboard and the Logpush API.
To use the new formats, set
timestamp_formatin your Logpush job'soutput_options:rfc3339ms—2024-02-17T23:52:01.123Zrfc3339ns—2024-02-17T23:52:01.123456789Z
Default timestamp formats apply unless explicitly set. The dashboard defaults to
rfc3339and the API defaults tounixnano.For more information, refer to the Log output options documentation.
We are introducing Logo Match Preview, bringing the same pre-save visibility to visual assets that was previously only available for string-based queries. This update allows you to fine-tune your brand detection strategy before committing to a live monitor.
- Upload your brand logo and immediately see a sample of potential matches from recently detected sites before finalizing the query
- Adjust your similarity score (from 75% to 100%) and watch the results refresh in real-time to find the balance between broad detection and noise reduction
- Review the specific logos triggered by your current settings to ensure your query is capturing the right level of brand infringement
If you are ready to test your brand assets, go to the Brand Protection dashboard ↗ to try the new preview tool.
Cloudflare Log Explorer now allows you to customize exactly which data fields are ingested and stored when enabling or managing log datasets.
Previously, ingesting logs often meant taking an "all or nothing" approach to data fields. With Ingest Field Selection, you can now choose from a list of available and recommended fields for each dataset. This allows you to reduce noise, focus on the metrics that matter most to your security and performance analysis, and manage your data footprint more effectively.
- Granular control: Select only the specific fields you need when enabling a new dataset.
- Dynamic updates: Update fields for existing, already enabled logstreams at any time.
- Historical consistency: Even if you disable a field later, you can still query and receive results for that field for the period it was captured.
- Data integrity: Core fields, such as
Timestamp, are automatically retained to ensure your logs remain searchable and chronologically accurate.
When configuring a dataset via the dashboard or API, you can define a specific set of fields. The
Timestampfield remains mandatory to ensure data indexability.{"dataset": "firewall_events","enabled": true,"fields": ["Timestamp","ClientRequestHost","ClientIP","Action","EdgeResponseStatus","OriginResponseStatus"]}For more information, refer to the Log Explorer documentation.
Cloudflare has added new fields across multiple Logpush datasets:
- MCP Portal Logs: A new dataset with fields including
ClientCountry,ClientIP,ColoCode,Datetime,Error,Method,PortalAUD,PortalID,PromptGetName,ResourceReadURI,ServerAUD,ServerID,ServerResponseDurationMs,ServerURL,SessionID,Success,ToolCallName,UserEmail, andUserID.
- DEX Application Tests:
HTTPRedirectEndMs,HTTPRedirectStartMs,HTTPResponseBody, andHTTPResponseHeaders. - DEX Device State Events:
ExperimentalExtra. - Firewall Events:
FraudUserID. - Gateway HTTP:
AppControlInfoandApplicationStatuses. - Gateway DNS:
InternalDNSDurationMs. - HTTP Requests:
FraudEmailRisk,FraudUserID, andPayPerCrawlStatus. - Network Analytics Logs:
DNSQueryName,DNSQueryType, andPFPCustomTag. - WARP Toggle Changes:
UserEmail. - WARP Config Changes:
UserEmail. - Zero Trust Network Session Logs:
SNI.
For the complete field definitions for each dataset, refer to Logpush datasets.
- MCP Portal Logs: A new dataset with fields including
Radar ships several new features that improve the flexibility and usability of the platform, as well as visibility into what is happening on the Internet.
All location-aware pages now support filtering by region, including continents, geographic subregions (Middle East ↗, Eastern Asia ↗, etc.), political regions (EU ↗, African Union ↗), and US Census regions/divisions (for example, New England ↗, US Northeast ↗).
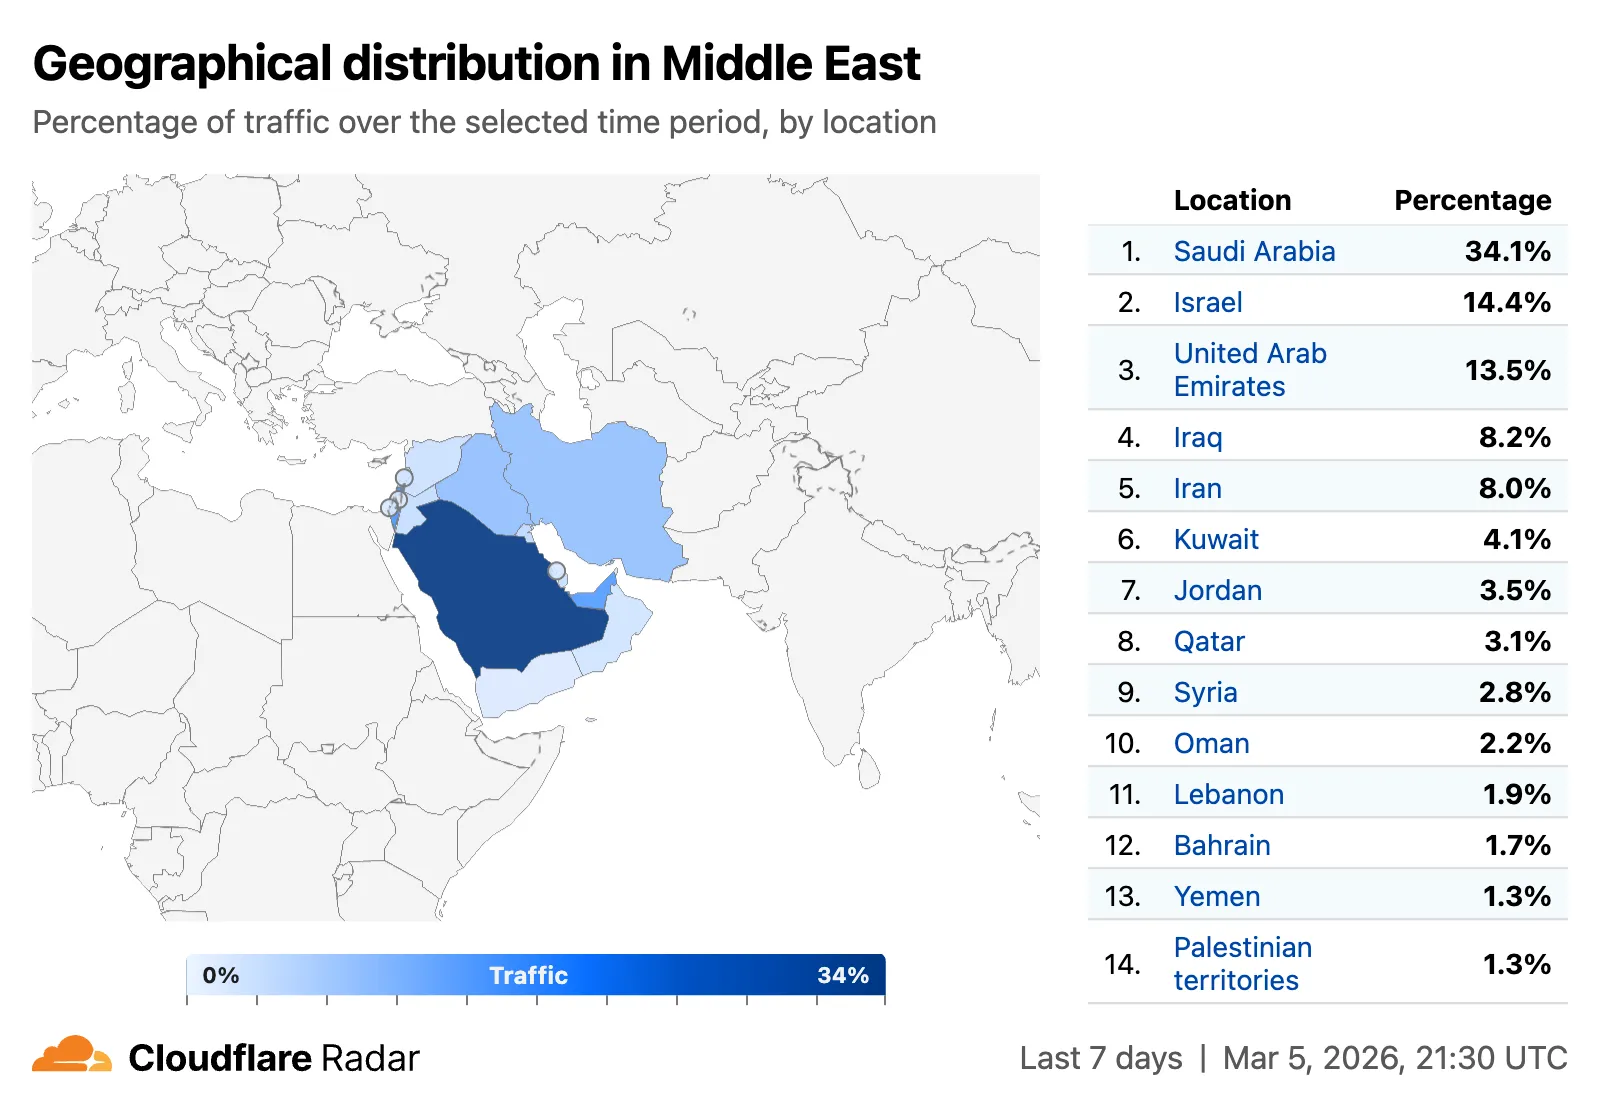
A new traffic volume view shows the top autonomous systems and countries/territories for a given location. This is useful for quickly determining which network providers in a location may be experiencing connectivity issues, or how traffic is distributed across a region.
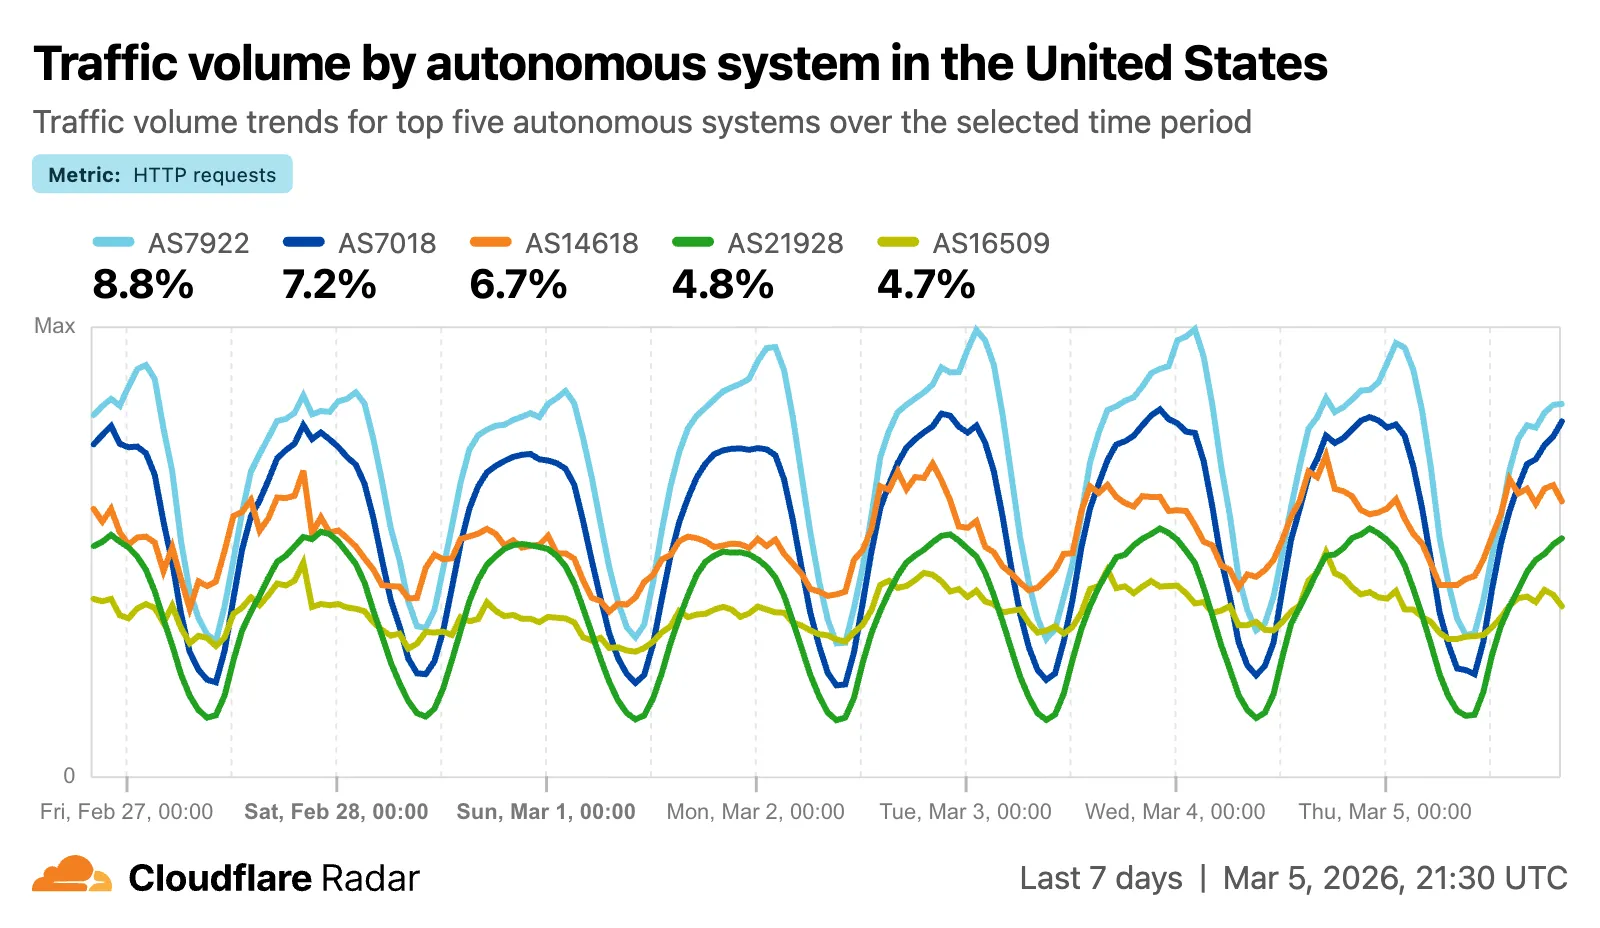
The new AS and location dimensions have also been added to the Data Explorer ↗ for the HTTP, DNS, and NetFlows datasets. Combined with other available filters, this provides a powerful tool for generating unique insights.

Finally, breadcrumb navigation is now available on most pages, allowing easier navigation between parent and related pages.
Check out these features on Cloudflare Radar ↗.
We have introduced new triage controls to help you manage your Brand Protection results more efficiently. You can now clear out the noise by dismissing matches while maintaining full visibility into your historical decisions.
- Dismiss matches: Users can now mark specific results as dismissed if they are determined to be benign or false positives, removing them from the primary triage view.
- Show/Hide toggle: A new visibility control allows you to instantly switch between viewing only active matches and including previously dismissed ones.
- Persistent review states: Dismissed status is saved across sessions, ensuring that your workspace remains organized and focused on new or high-priority threats.
- Reduce alert fatigue by hiding known-safe results, allowing your team to focus exclusively on unreviewed or high-risk infringements.
- Auditability and recovery through the visibility toggle, ensuring that no match is ever truly "lost" and can be re-evaluated if a site's content changes.
- Improved collaboration as your team members can see which matches have already been vetted and dismissed by others.
Ready to clean up your match queue? Learn more in our Brand Protection documentation.
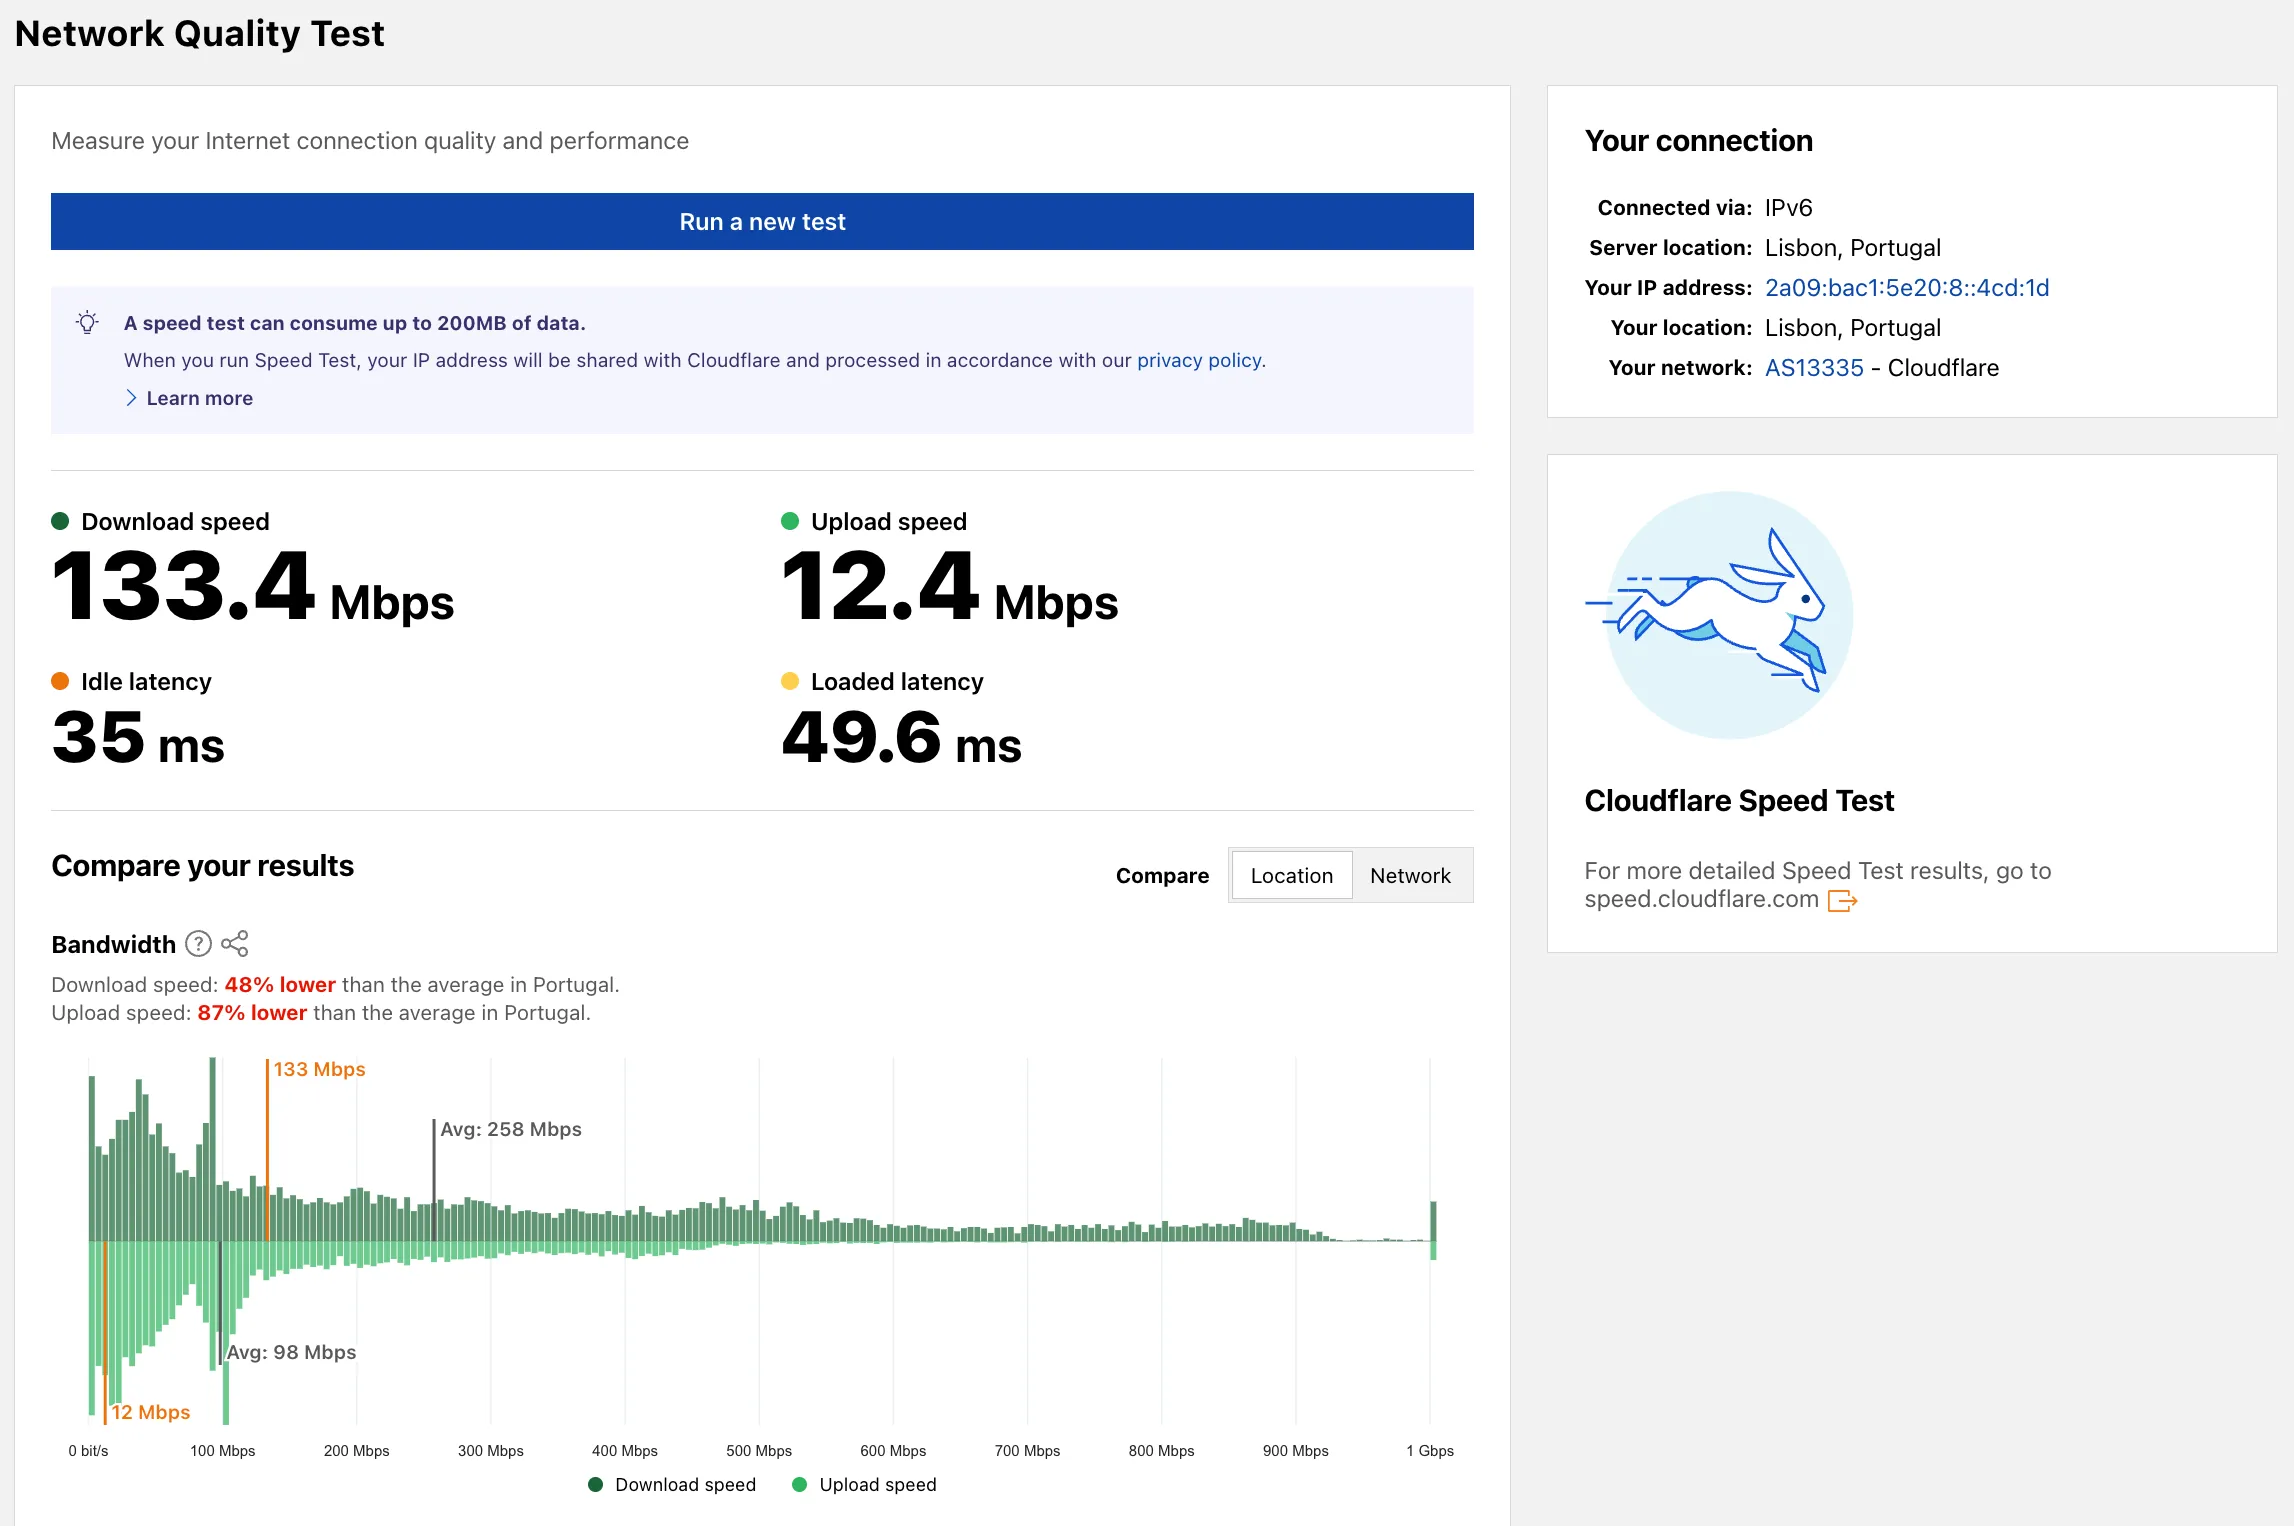
Radar now includes a Network Quality Test ↗ page. The tool measures Internet connection quality and performance, showing connection details such as IP address, server location, network (ASN), and IP version. For more detailed speed test results, the page links to speed.cloudflare.com ↗.
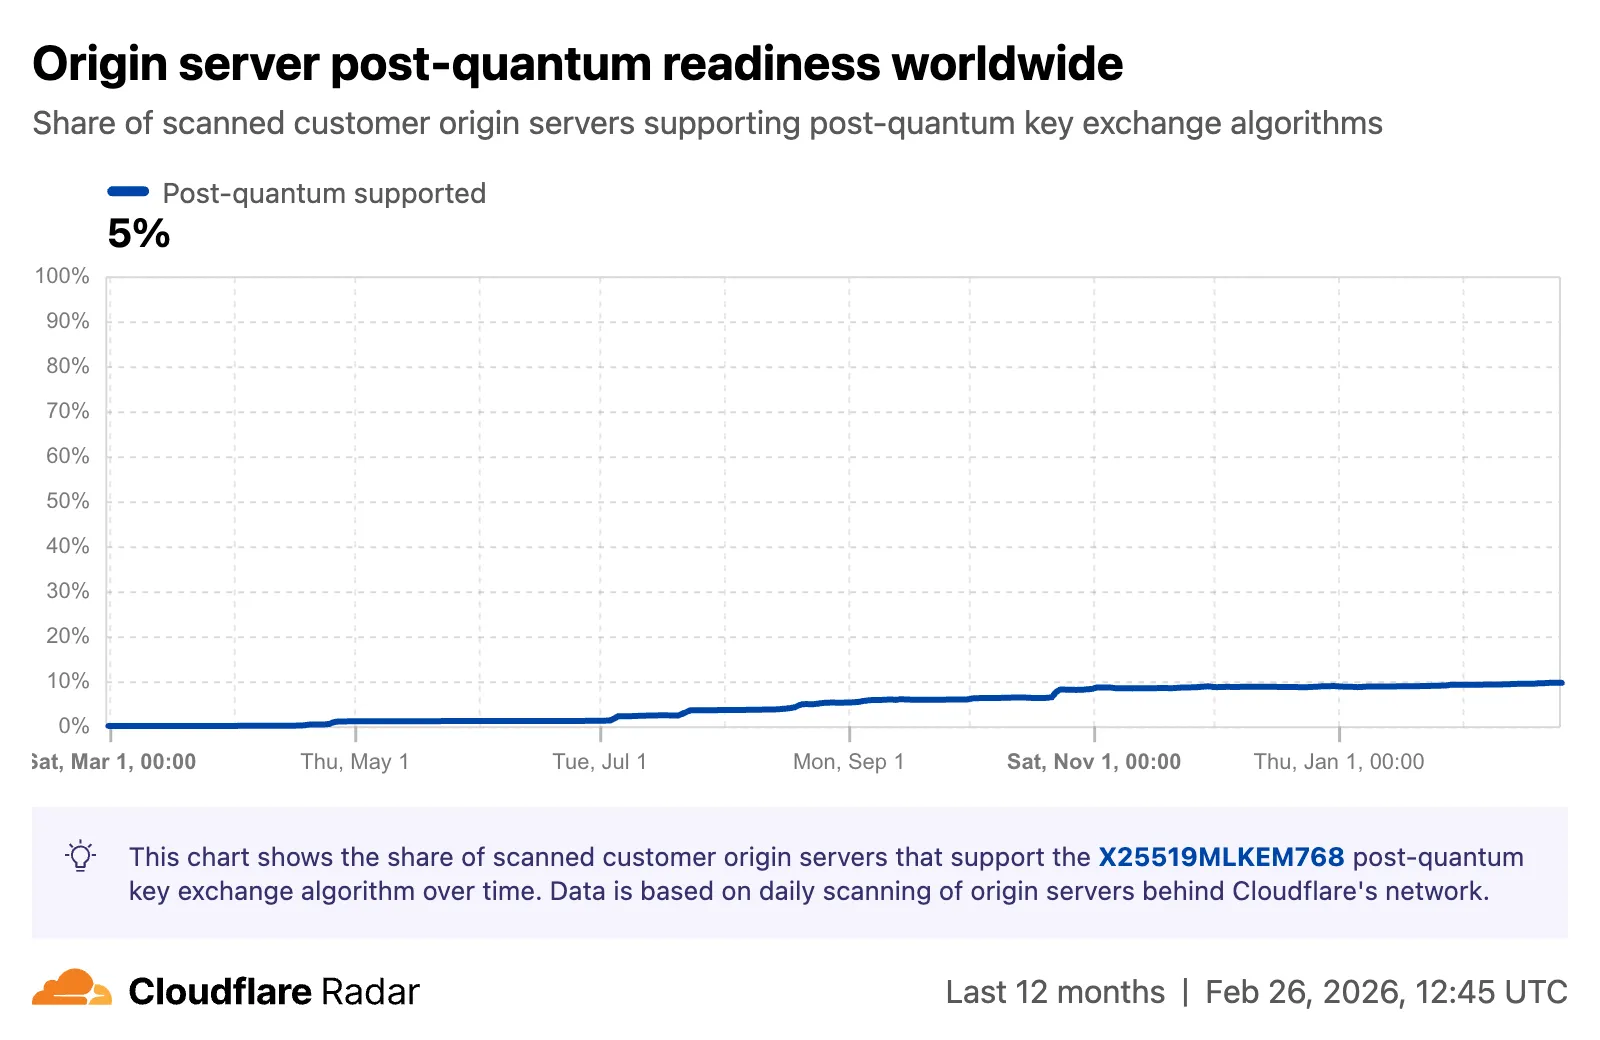
Radar now tracks post-quantum encryption support on origin servers, provides a tool to test any host for post-quantum compatibility, and introduces a Key Transparency dashboard for monitoring end-to-end encrypted messaging audit logs.
The new
Post-QuantumAPI provides the following endpoints:/post_quantum/tls/support- Tests whether a host supports post-quantum TLS key exchange./post_quantum/origin/summary/{dimension}- Returns origin post-quantum data summarized by key agreement algorithm./post_quantum/origin/timeseries_groups/{dimension}- Returns origin post-quantum timeseries data grouped by key agreement algorithm.
The new Post-Quantum Encryption ↗ page shows the share of customer origins supporting X25519MLKEM768, derived from daily automated TLS scans of TLS 1.3-compatible origins. The scanner tests for algorithm support rather than the origin server's configured preference.
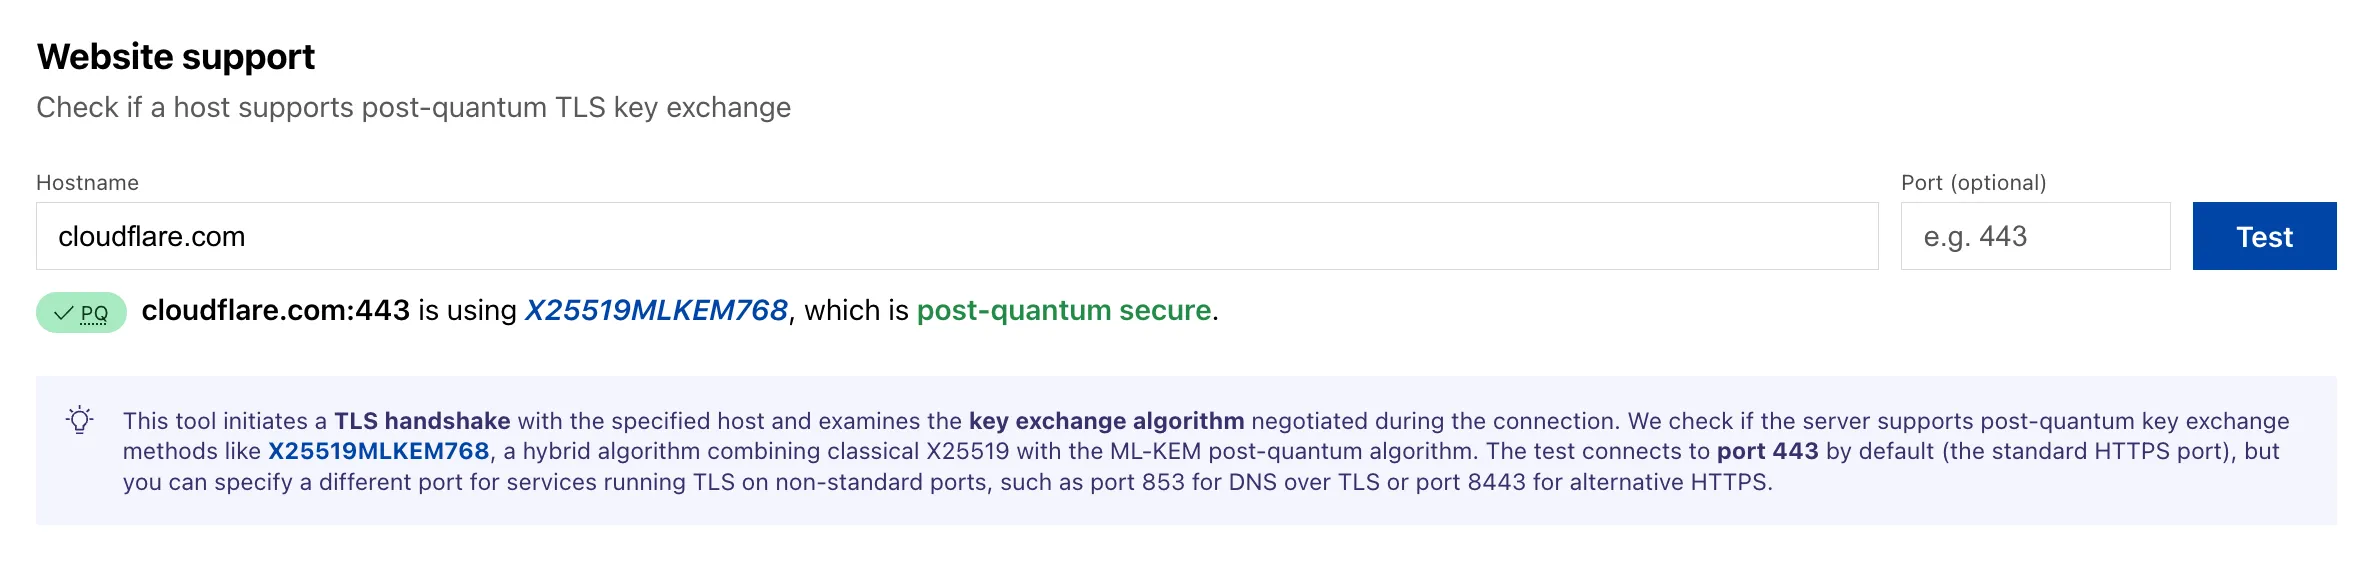
A host test tool allows checking any publicly accessible website for post-quantum encryption compatibility. Enter a hostname and optional port to see whether the server negotiates a post-quantum key exchange algorithm.
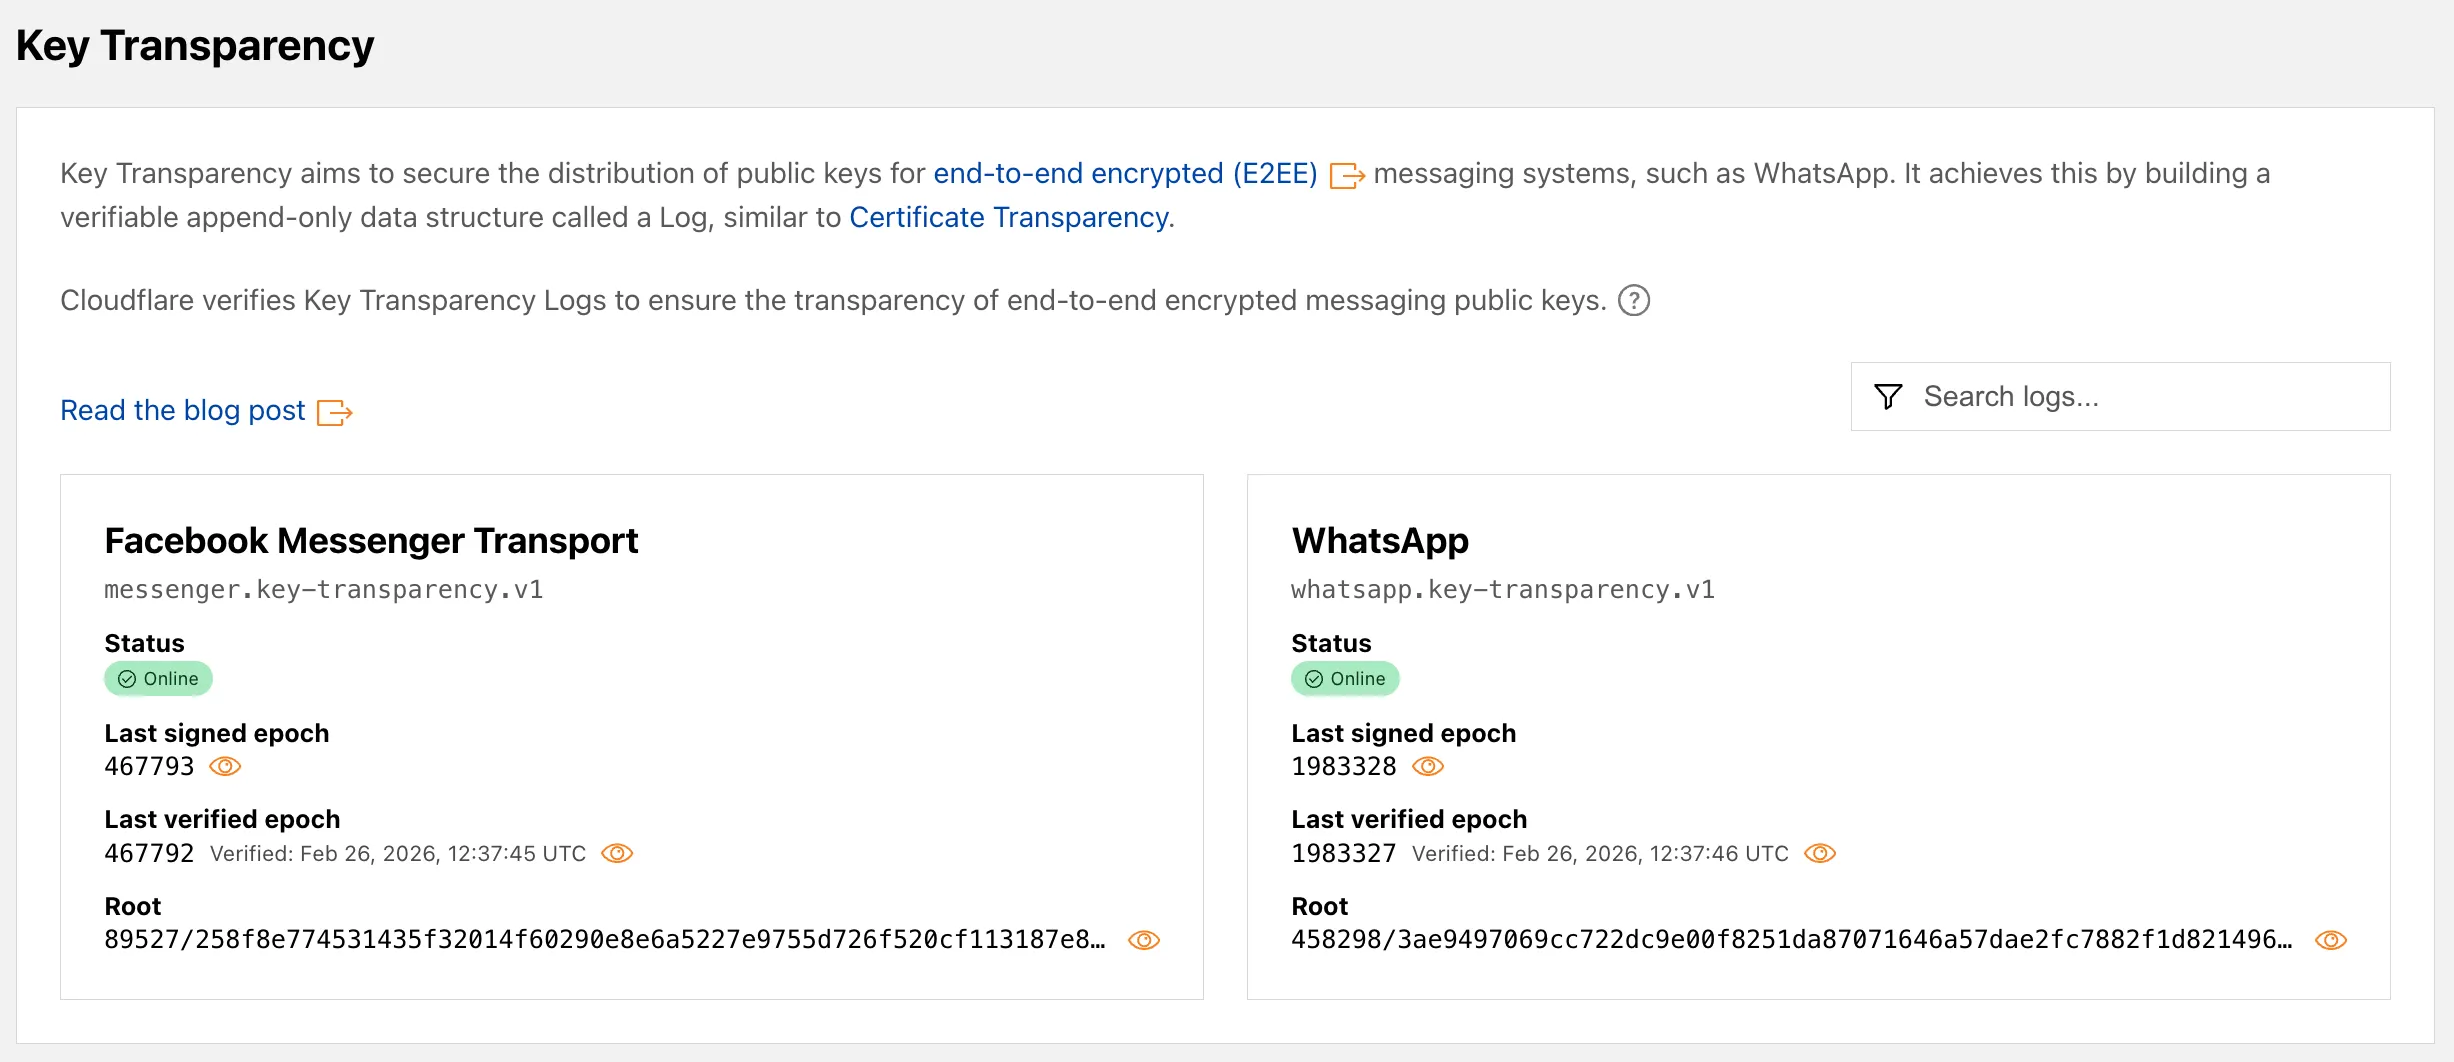
A new Key Transparency ↗ section displays the audit status of Key Transparency logs for end-to-end encrypted messaging services. The page launches with two monitored logs: WhatsApp and Facebook Messenger Transport.
Each log card shows the current status, last signed epoch, last verified epoch, and the root hash of the Auditable Key Directory tree. The data is also available through the Key Transparency Auditor API.
Learn more about these features in our blog post ↗ and check out the Post-Quantum Encryption ↗ and Key Transparency ↗ pages to explore the data.
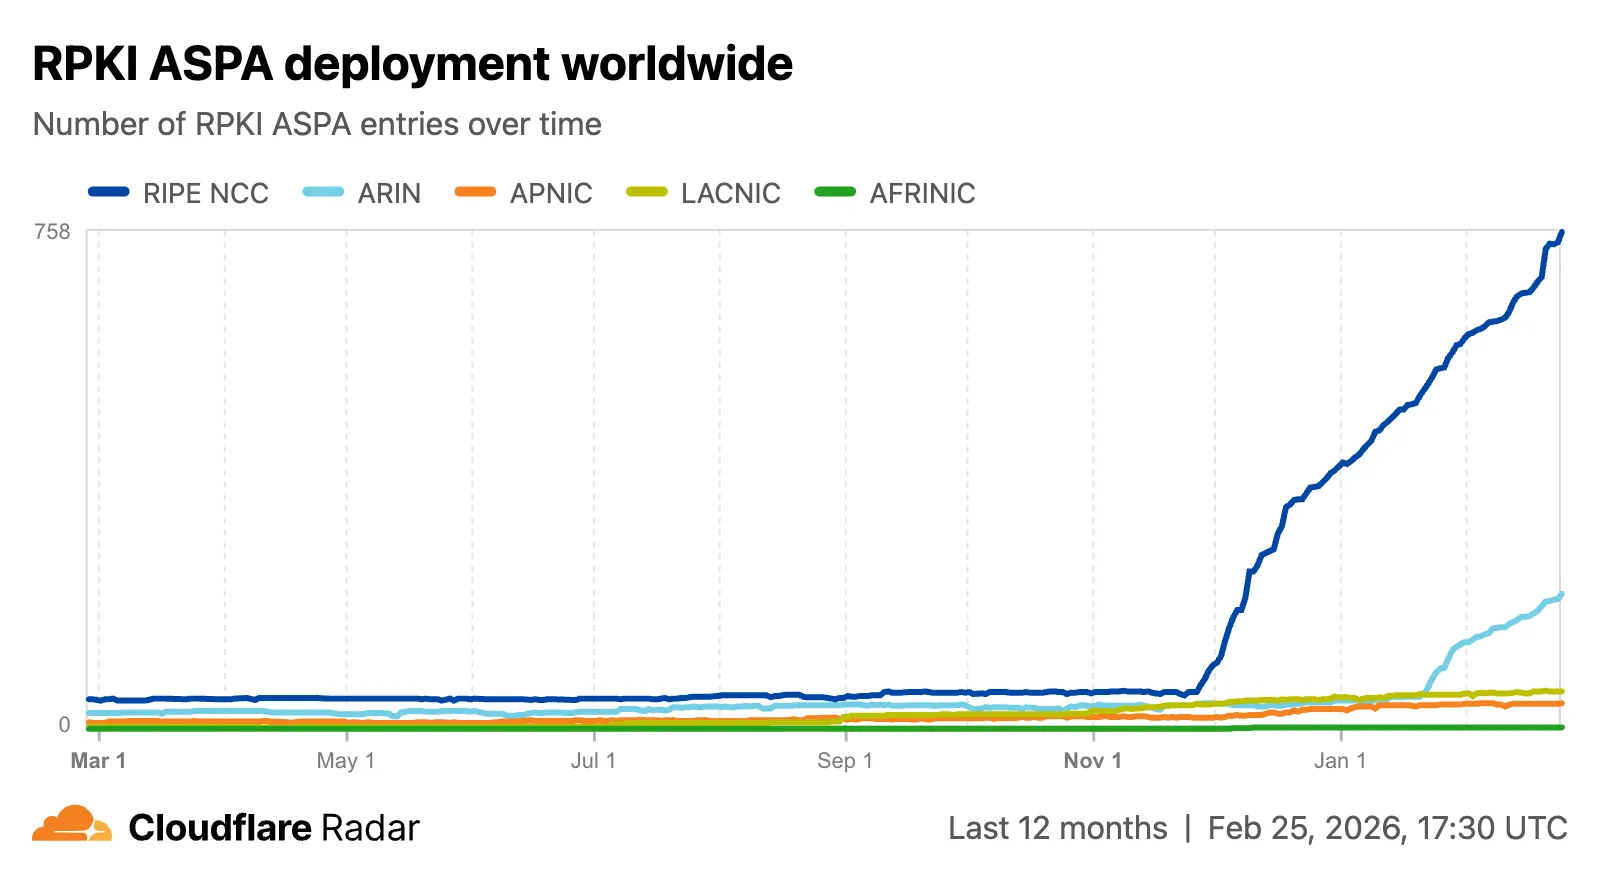
Radar now includes Autonomous System Provider Authorization (ASPA) ↗ deployment insights, providing visibility into the adoption and verification of ASPA objects across the global routing ecosystem.
The new
ASPAAPI provides the following endpoints:/bgp/rpki/aspa/snapshot- Retrieves current or historical ASPA objects./bgp/rpki/aspa/changes- Retrieves changes to ASPA objects over time./bgp/rpki/aspa/timeseries- Retrieves ASPA object counts over time as a timeseries.
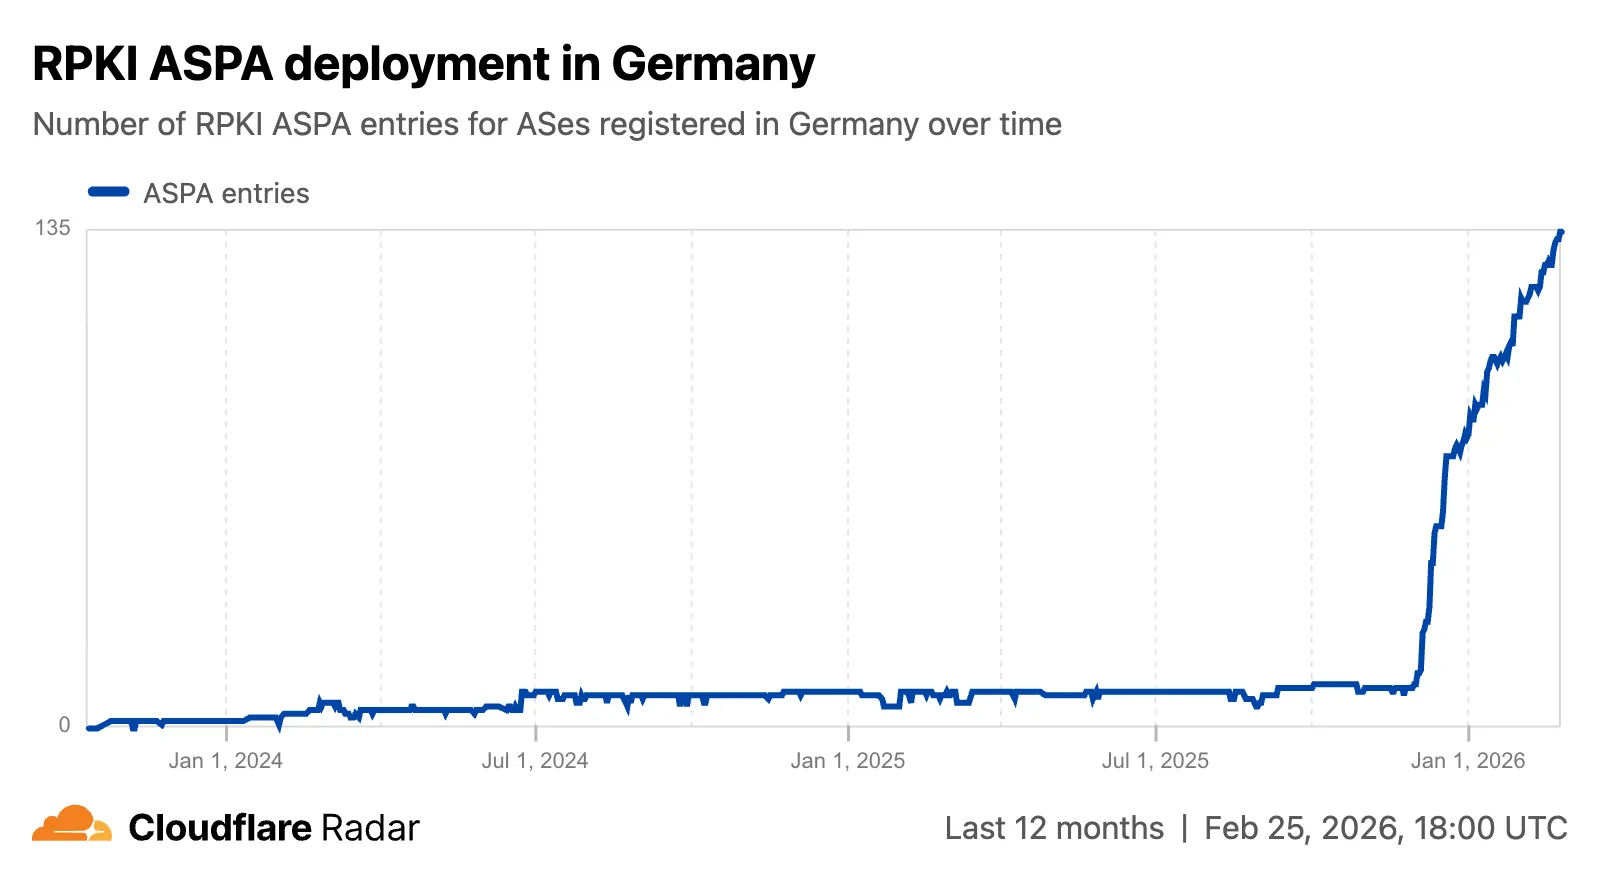
The global routing page ↗ now shows the ASPA deployment trend over time by counting daily ASPA objects.
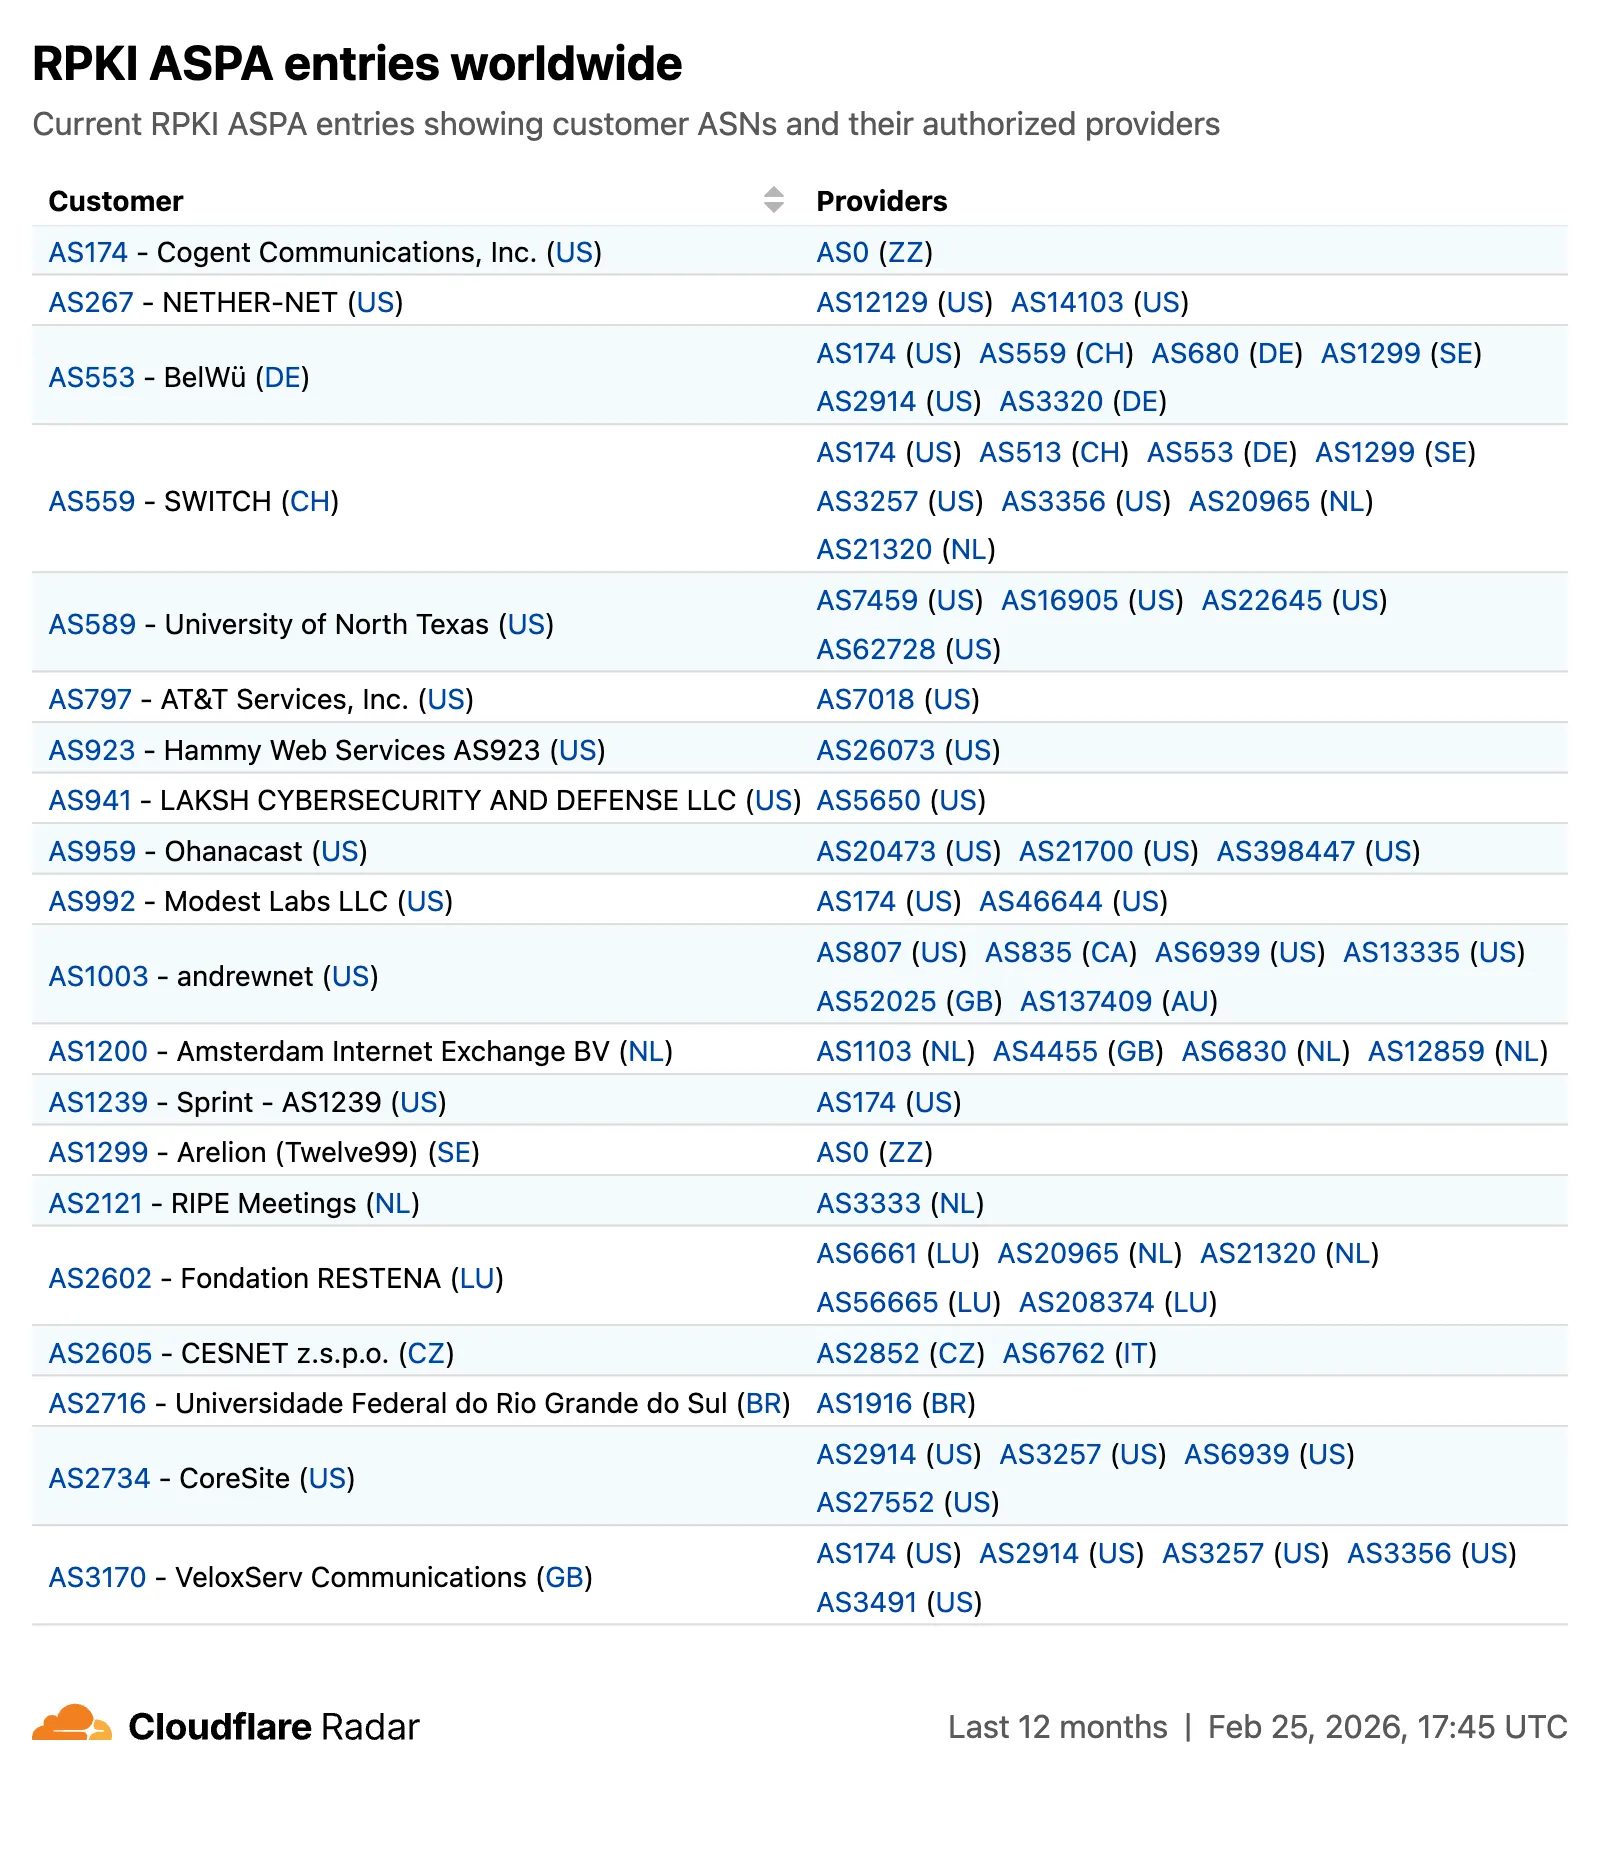
The global routing page also displays the most recent ASPA objects, searchable by ASN or AS name.
On country and region routing pages, a new widget shows the ASPA deployment rate for ASNs registered in the selected country or region.
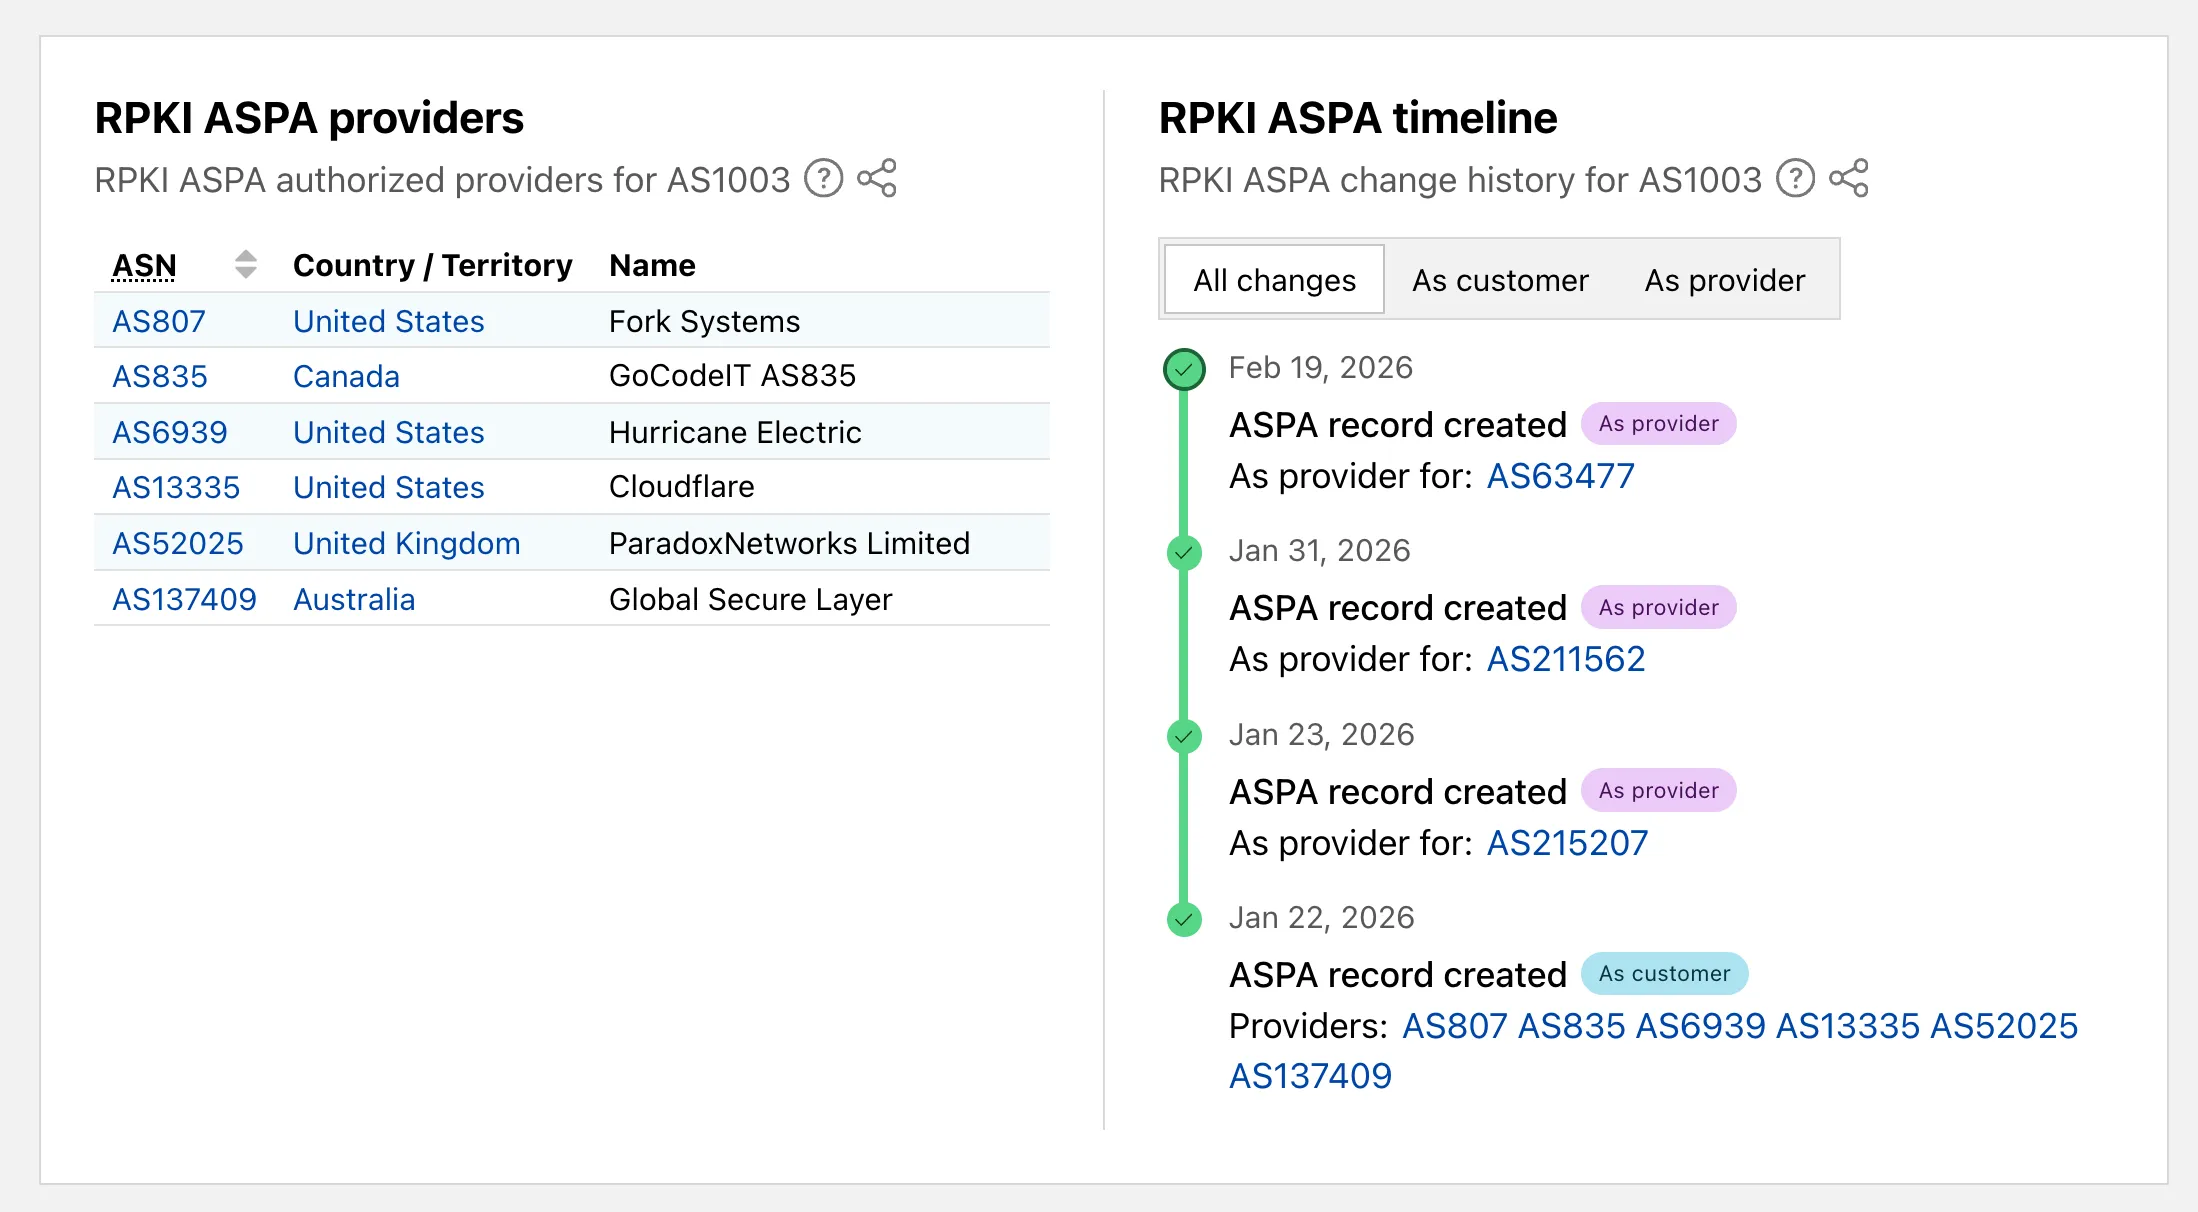
On AS routing pages, the connectivity table now includes checkmarks for ASPA-verified upstreams. All ASPA upstreams are listed in a dedicated table, and a timeline shows ASPA changes at daily granularity.
Check out the Radar routing page ↗ to explore the data.
TL;DR: You can now create and save custom configurations of the Threat Events dashboard, allowing you to instantly return to specific filtered views — such as industry-specific attacks or regional Sankey flows — without manual reconfiguration.
Threat intelligence is most effective when it is personalized. Previously, analysts had to manually re-apply complex filters (like combining specific industry datasets with geographic origins) every time they logged in. This update provides material value by:
- Analysts can now jump straight into "Known Ransomware Infrastructure" or "Retail Sector Targets" views with a single click, eliminating repetitive setup tasks
- Teams can ensure everyone is looking at the same data subsets by using standardized saved views, reducing the risk of missing critical patterns due to inconsistent filtering.
Cloudforce One subscribers can start saving their custom views now in Application Security > Threat Intelligence > Threat Events ↗.
Digital Experience Monitoring (DEX) provides visibility into WARP device connectivity and performance to any internal or external application.
Now, all DEX logs are fully compatible with Cloudflare's Customer Metadata Boundary (CMB) setting for the 'EU' (European Union), which ensures that DEX logs will not be stored outside the 'EU' when the option is configured.
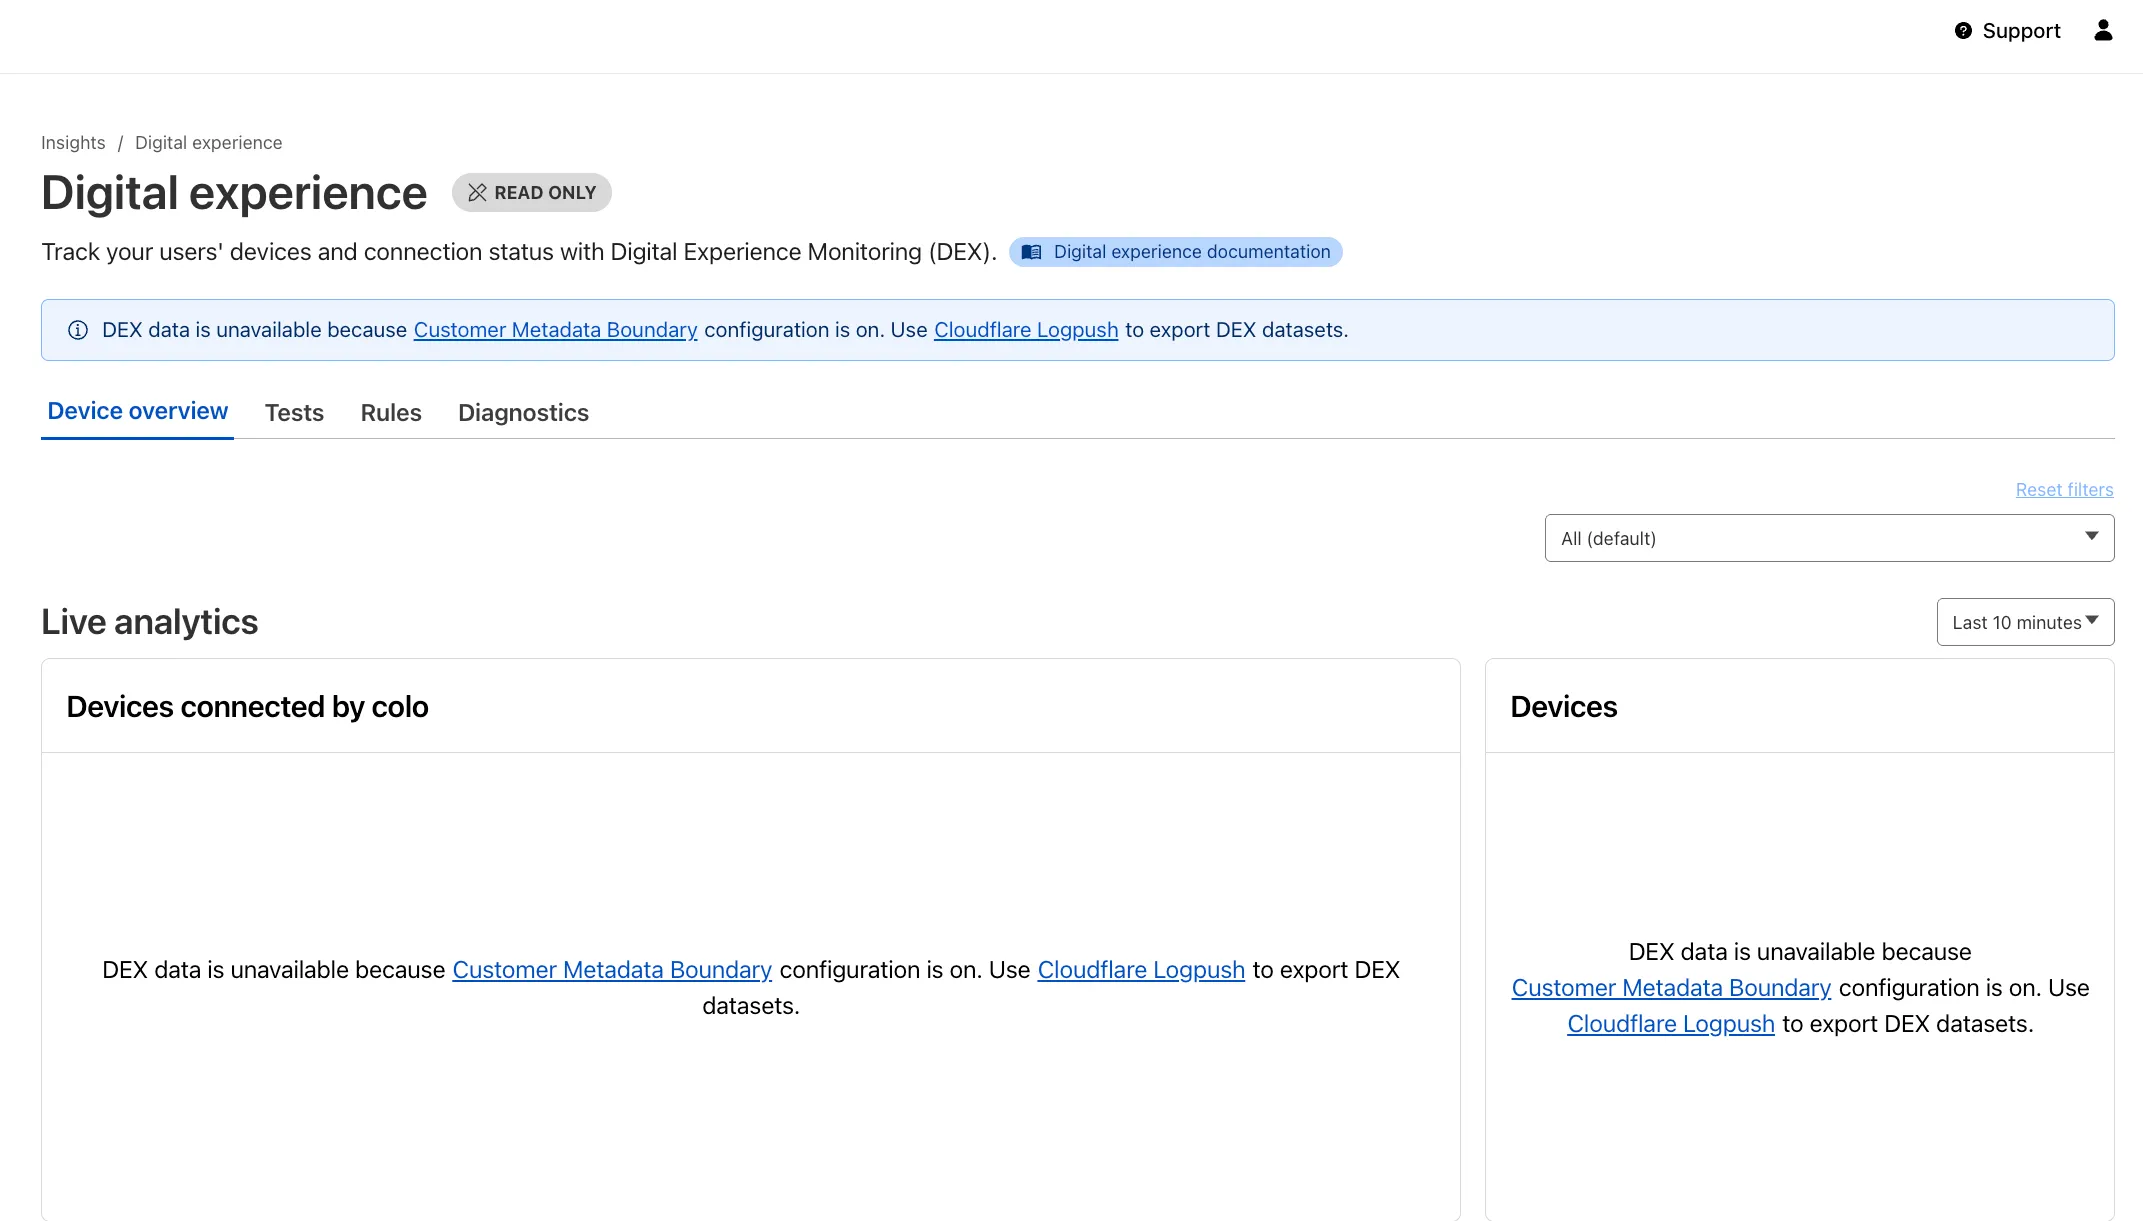
If a Cloudflare One customer using DEX enables CMB 'EU', they will not see any DEX data in the Cloudflare One dashboard. Customers can ingest DEX data via LogPush, and build their own analytics and dashboards.
If a customer enables CMB in their account, they will see the following message in the Digital Experience dashboard: "DEX data is unavailable because Customer Metadata Boundary configuration is on. Use Cloudflare LogPush to export DEX datasets."
We have introduced dynamic visualizations to the Threat Events dashboard to help you better understand the threat landscape and identify emerging patterns at a glance.
What's new:
- Sankey Diagrams: Trace the flow of attacks from country of origin to target country to identify which regions are being hit hardest and where the threat infrastructure resides.
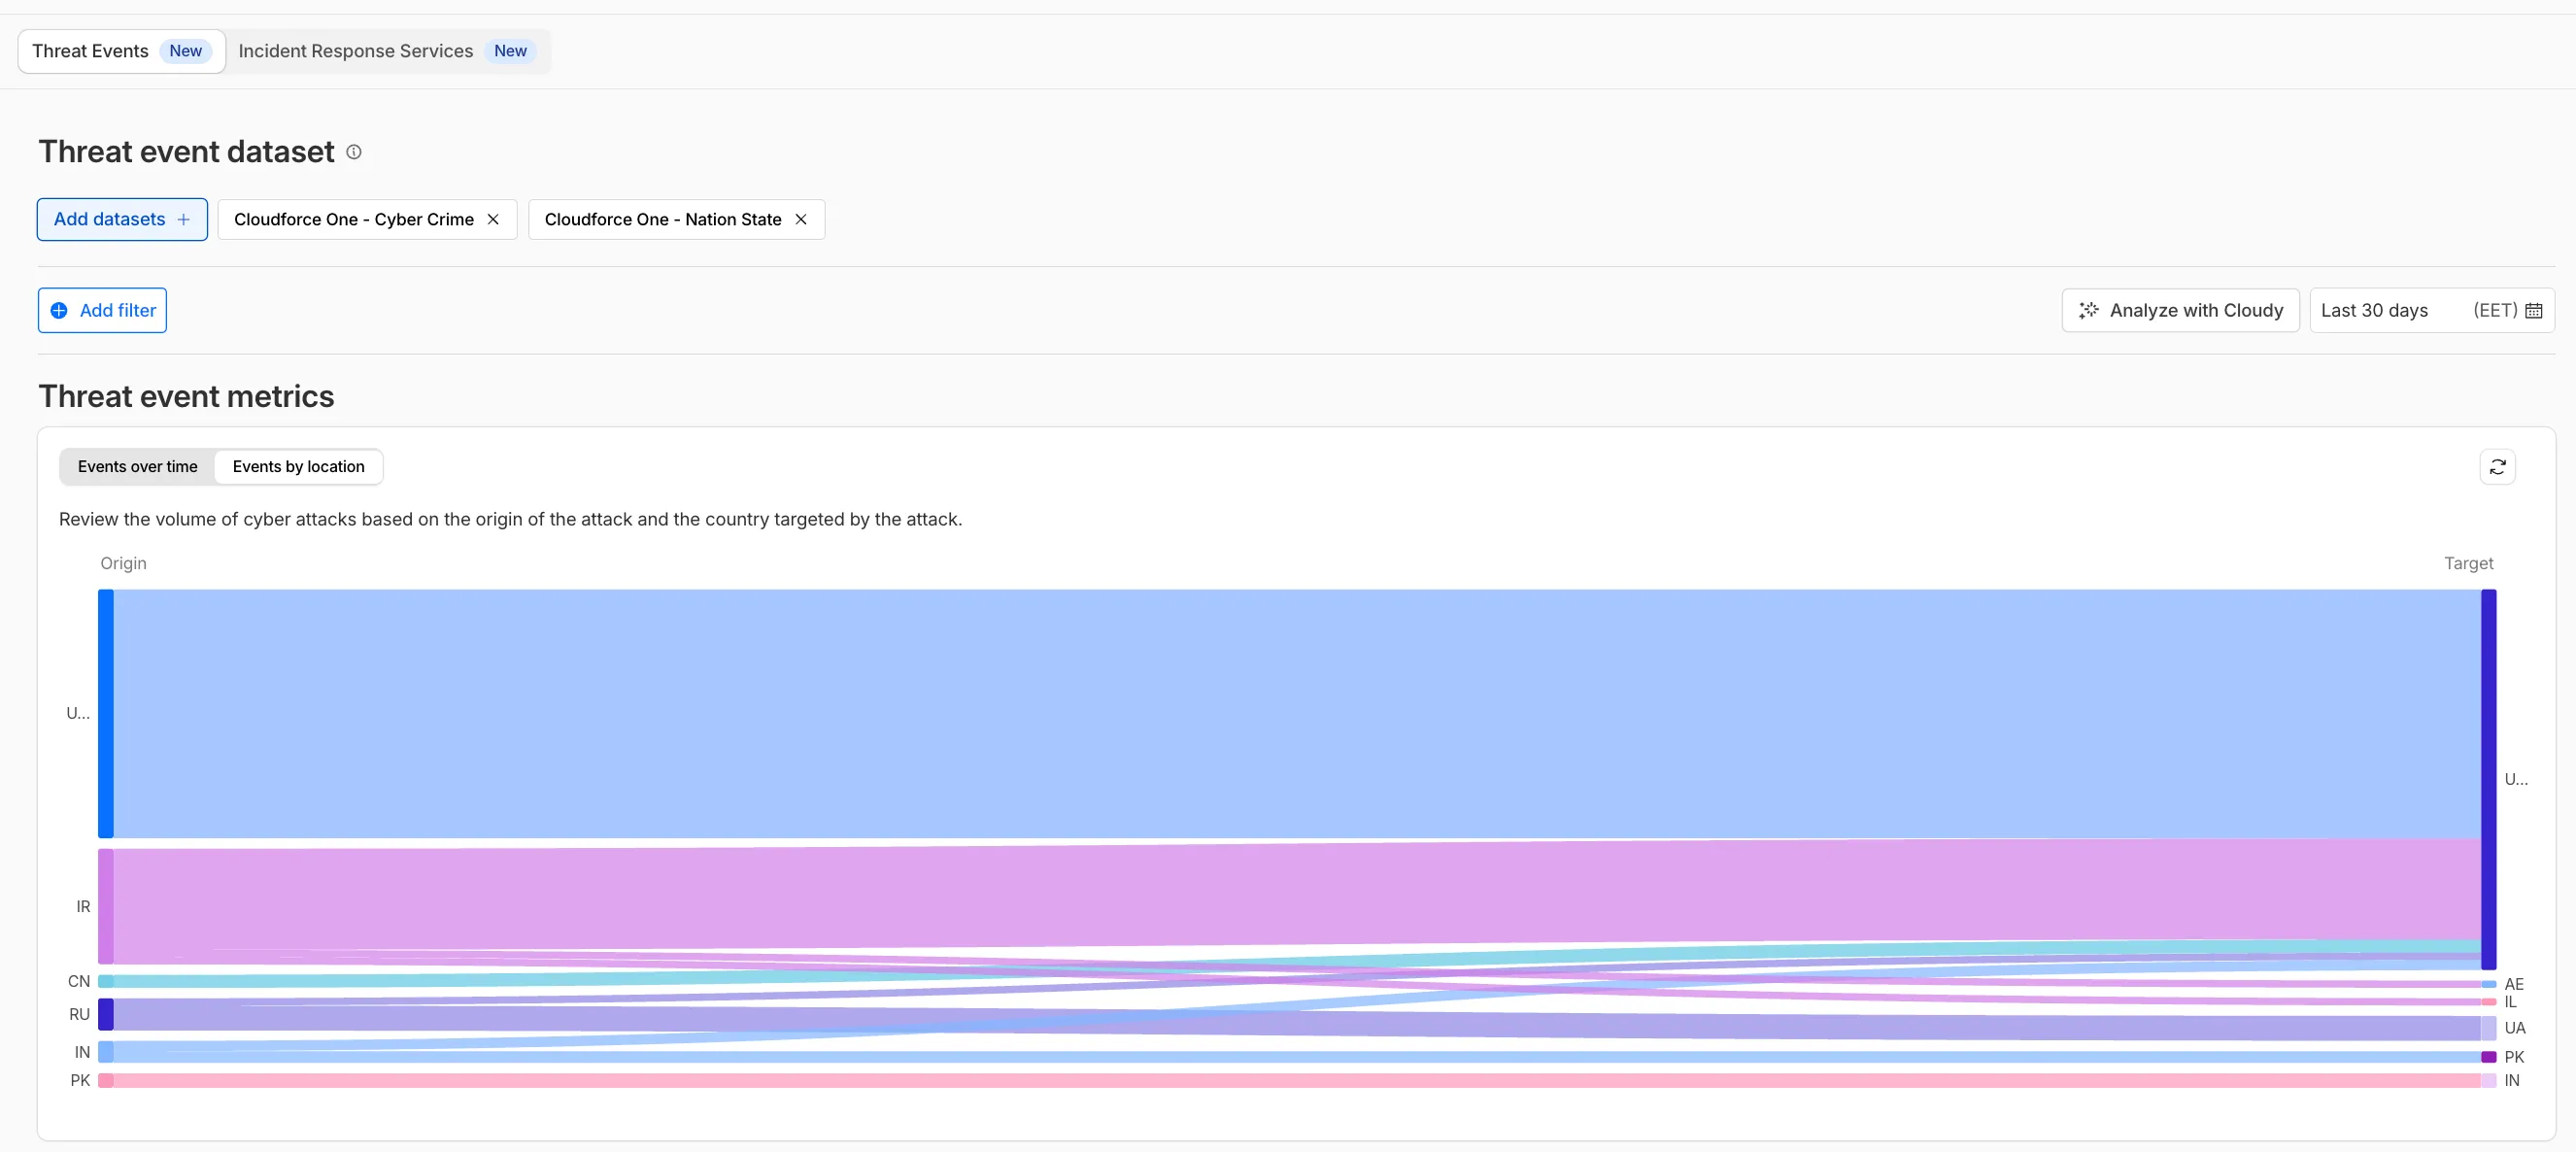
- Dataset Distribution over time: Instantly pivot your view to understand if a specific campaign is targeting your sector or if it is a broad-spectrum commodity attack.
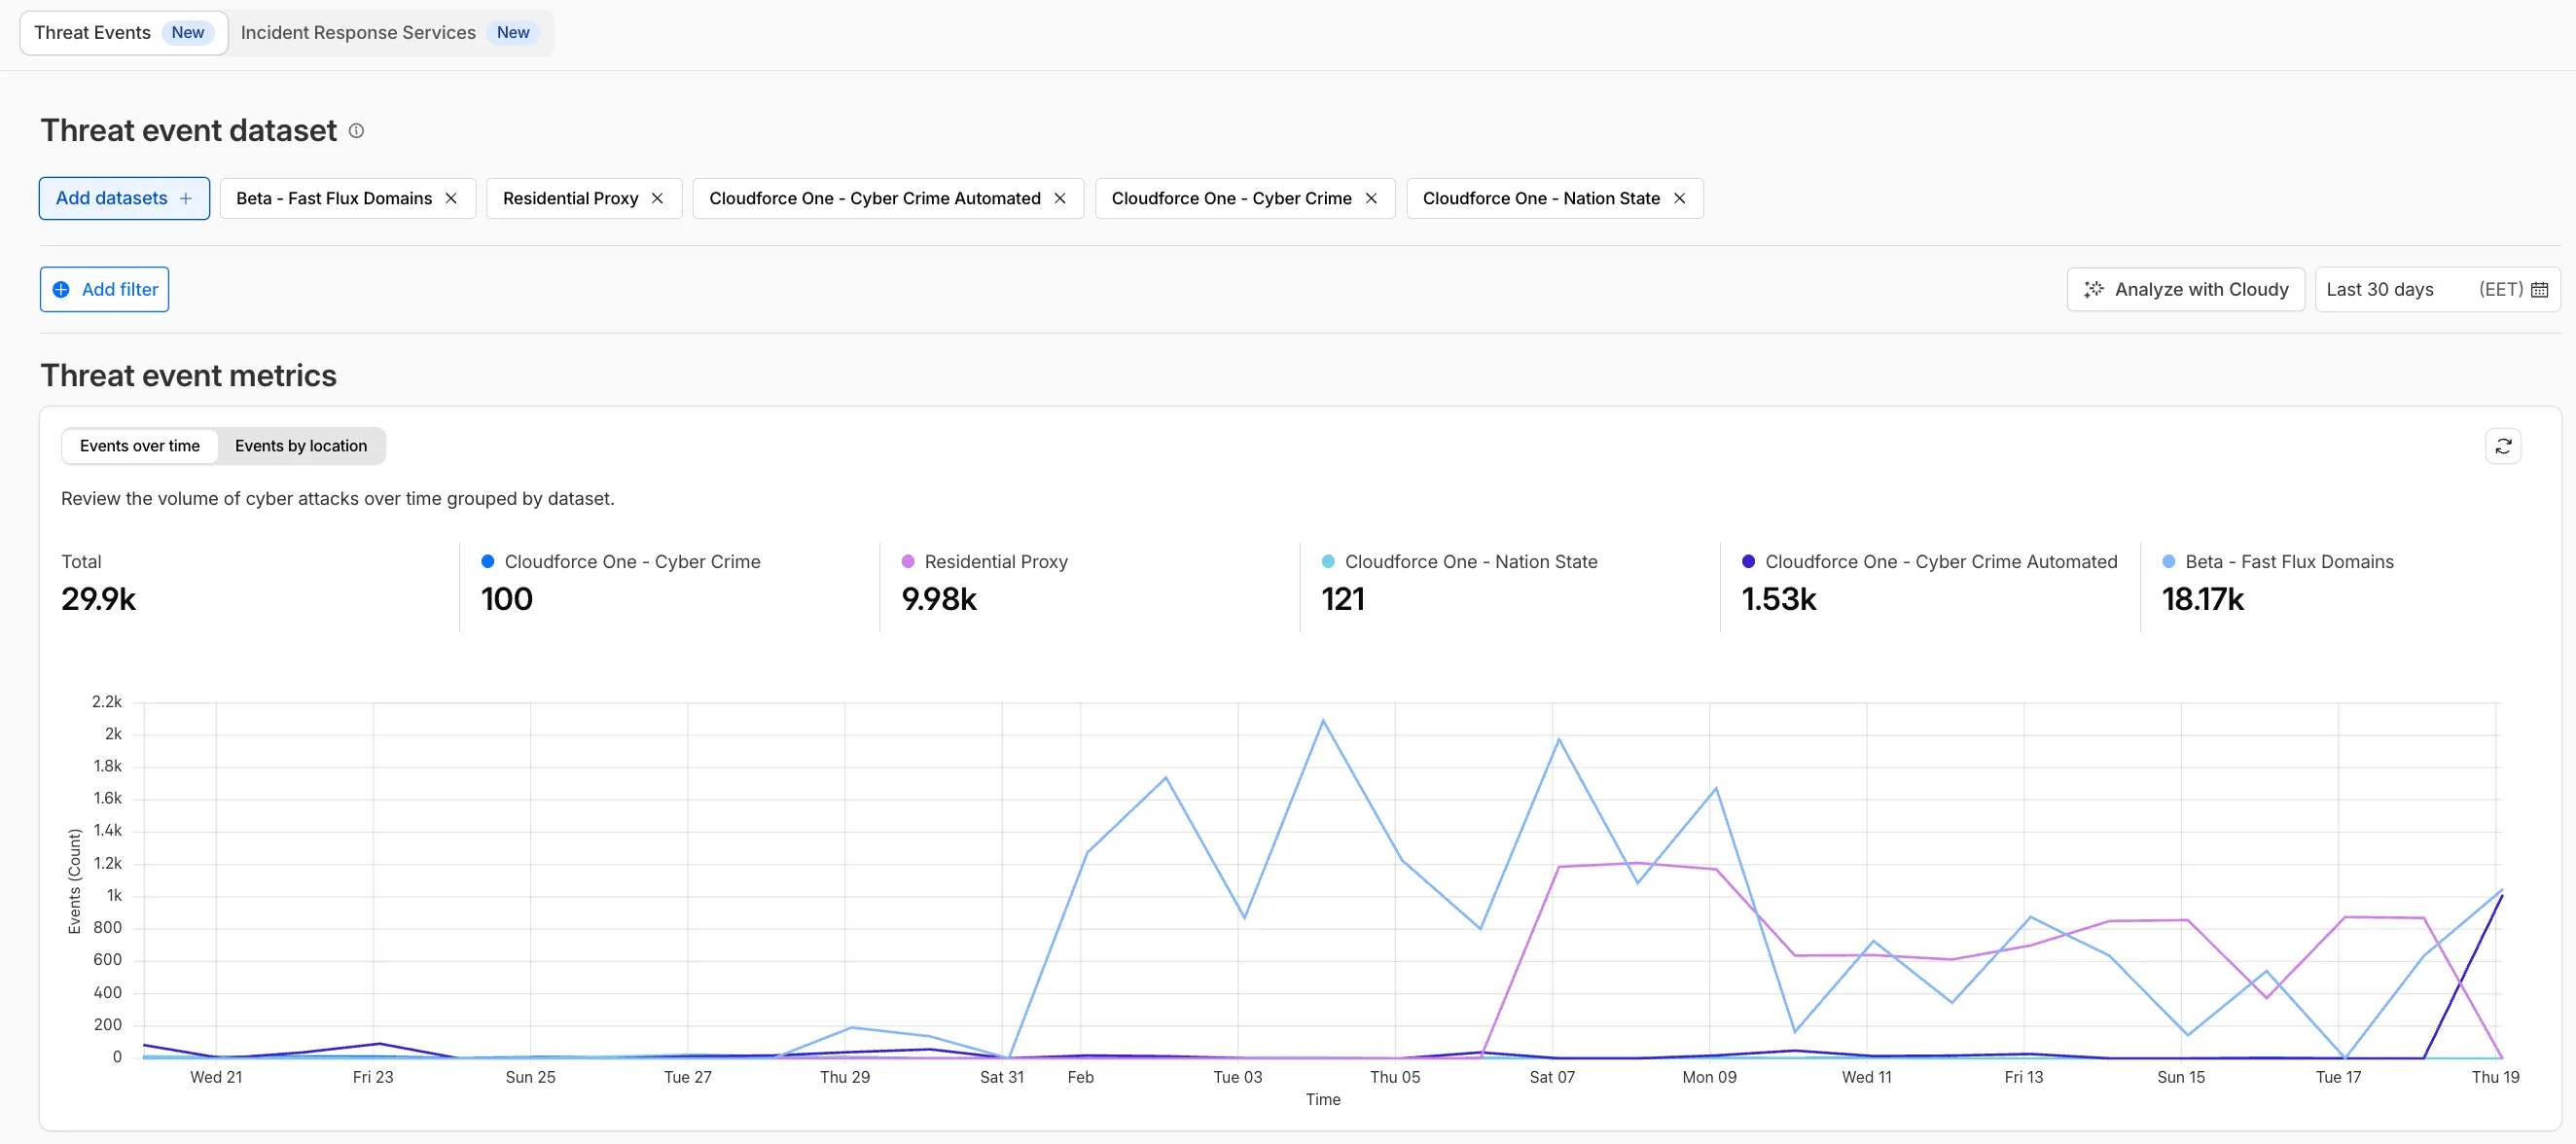
- Enhanced Filtering: Use these visual tools to filter and drill down into specific attack vectors directly from the charts.
Cloudforce One subscribers can explore these new views now in Application Security > Threat Intelligence > Threat Events ↗.
The Server-Timing header now includes a new
cfWorkermetric that measures time spent executing Cloudflare Workers, including any subrequests performed by the Worker. This helps developers accurately identify whether high Time to First Byte (TTFB) is caused by Worker processing or slow upstream dependencies.Previously, Worker execution time was included in the
edgemetric, making it harder to identify true edge performance. The newcfWorkermetric provides this visibility:Metric Description edgeTotal time spent on the Cloudflare edge, including Worker execution originTime spent fetching from the origin server cfWorkerTime spent in Worker execution, including subrequests but excluding origin fetch time Server-Timing: cdn-cache; desc=DYNAMIC, edge; dur=20, origin; dur=100, cfWorker; dur=7In this example, the edge took 20ms, the origin took 100ms, and the Worker added just 7ms of processing time.
The
cfWorkermetric is enabled by default if you have Real User Monitoring (RUM) enabled. Otherwise, you can enable it using Rules.This metric is particularly useful for:
- Performance debugging: Quickly determine if latency is caused by Worker code, external API calls within Workers, or slow origins.
- Optimization targeting: Identify which component of your request path needs optimization.
- Real User Monitoring (RUM): Access detailed timing breakdowns directly from response headers for client-side analytics.
For more information about Server-Timing headers, refer to the W3C Server Timing specification ↗.
We are updating naming related to some of our Networking products to better clarify their place in the Zero Trust and Secure Access Service Edge (SASE) journey.
We are retiring some older brand names in favor of names that describe exactly what the products do within your network. We are doing this to help customers build better, clearer mental models for comprehensive SASE architecture delivered on Cloudflare.
- Magic WAN → Cloudflare WAN
- Magic WAN IPsec → Cloudflare IPsec
- Magic WAN GRE → Cloudflare GRE
- Magic WAN Connector → Cloudflare One Appliance
- Magic Firewall → Cloudflare Network Firewall
- Magic Network Monitoring → Network Flow
- Magic Cloud Networking → Cloudflare One Multi-cloud Networking
No action is required by you — all functionality, existing configurations, and billing will remain exactly the same.
For more information, visit the Cloudflare One documentation.
Radar now includes content type insights for AI bot and crawler traffic. The new
content_typedimension and filter shows the distribution of content types returned to AI crawlers, grouped by MIME type category.The content type dimension and filter are available via the following API endpoints:
Content type categories:
- HTML - Web pages (
text/html) - Images - All image formats (
image/*) - JSON - JSON data and API responses (
application/json,*+json) - JavaScript - Scripts (
application/javascript,text/javascript) - CSS - Stylesheets (
text/css) - Plain Text - Unformatted text (
text/plain) - Fonts - Web fonts (
font/*,application/font-*) - XML - XML documents and feeds (
text/xml,application/xml,application/rss+xml,application/atom+xml) - YAML - Configuration files (
text/yaml,application/yaml) - Video - Video content and streaming (
video/*,application/ogg,*mpegurl) - Audio - Audio content (
audio/*) - Markdown - Markdown documents (
text/markdown) - Documents - PDFs, Office documents, ePub, CSV (
application/pdf,application/msword,text/csv) - Binary - Executables, archives, WebAssembly (
application/octet-stream,application/zip,application/wasm) - Serialization - Binary API formats (
application/protobuf,application/grpc,application/msgpack) - Other - All other content types
Additionally, individual bot information pages ↗ now display content type distribution for AI crawlers that exist in both the Verified Bots and AI Bots datasets.
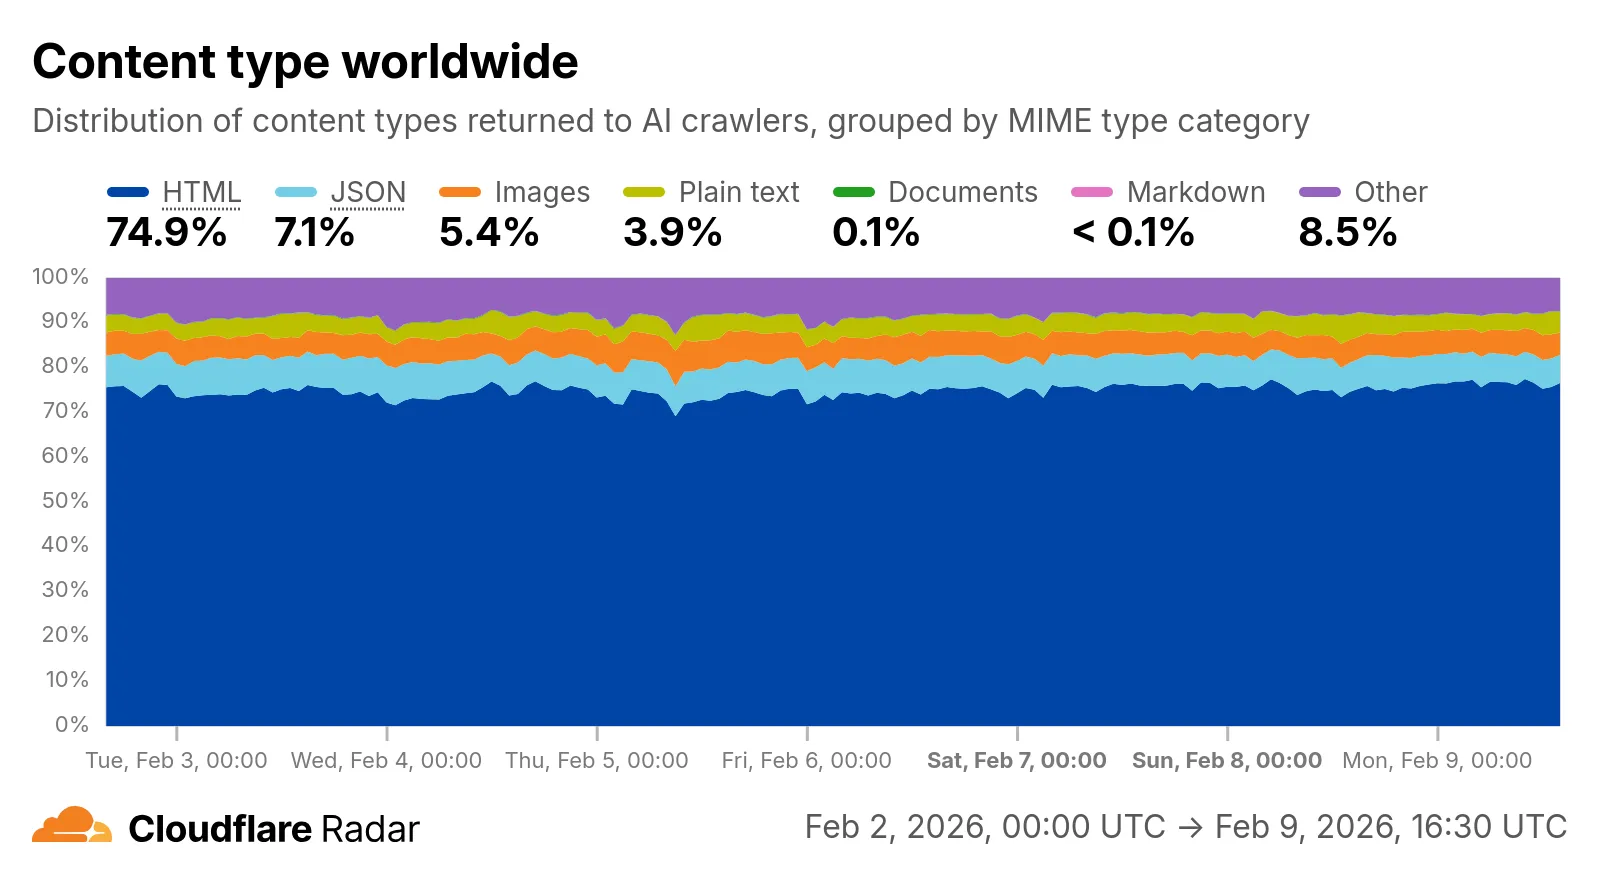
Check out the AI Insights page ↗ to explore the data.
- HTML - Web pages (
We have significantly upgraded our Logo Matching capabilities within Brand Protection. While previously limited to approximately 100% matches, users can now detect a wider range of brand assets through a redesigned matching model and UI.
- Configurable match thresholds: Users can set a minimum match score (starting at 75%) when creating a logo query to capture subtle variations or high-quality impersonations.
- Visual match scores: Allow users to see the exact percentage of the match directly in the results table, highlighted with color-coded lozenges to indicate severity.
- Direct logo previews: Available in the Cloudflare dashboard — similar to string matches — to verify infringements at a glance.
- Expose sophisticated impersonators who use slightly altered logos to bypass basic detection filters.
- Faster triage of the most relevant threats immediately using visual indicators, reducing the time spent manually reviewing matches.
Ready to protect your visual identity? Learn more in our Brand Protection documentation.
Log Explorer now supports multiple concurrent queries with the new Tabs feature. Work with multiple queries simultaneously and pivot between datasets to investigate malicious activity more effectively.
- Multiple tabs: Open and switch between multiple query tabs to compare results across different datasets.
- Quick filtering: Select the filter button from query results to add a value as a filter to your current query.
- Pivot to new tab: Use Cmd + click on the filter button to start a new query tab with that filter applied.
- Preserved progress: Your query progress is preserved on each tab if you navigate away and return.
For more information, refer to the Log Explorer documentation.
Identifying threat actors can be challenging, because naming conventions often vary across the security industry. To simplify your research, Cloudflare Threat Events now include an Also known as field, providing a list of common aliases and industry-standard names for the groups we track.
This new field is available in both the Cloudflare dashboard and via the API. In the dashboard, you can view these aliases by expanding the event details side panel (under the Attacker field) or by adding it as a column in your configurable table view.
- Easily map Cloudflare-tracked actors to the naming conventions used by other vendors without manual cross-referencing.
- Quickly identify if a detected threat actor matches a group your team is already monitoring via other intelligence feeds.
For more information on how to access this data, refer to the Threat Events API documentation ↗.
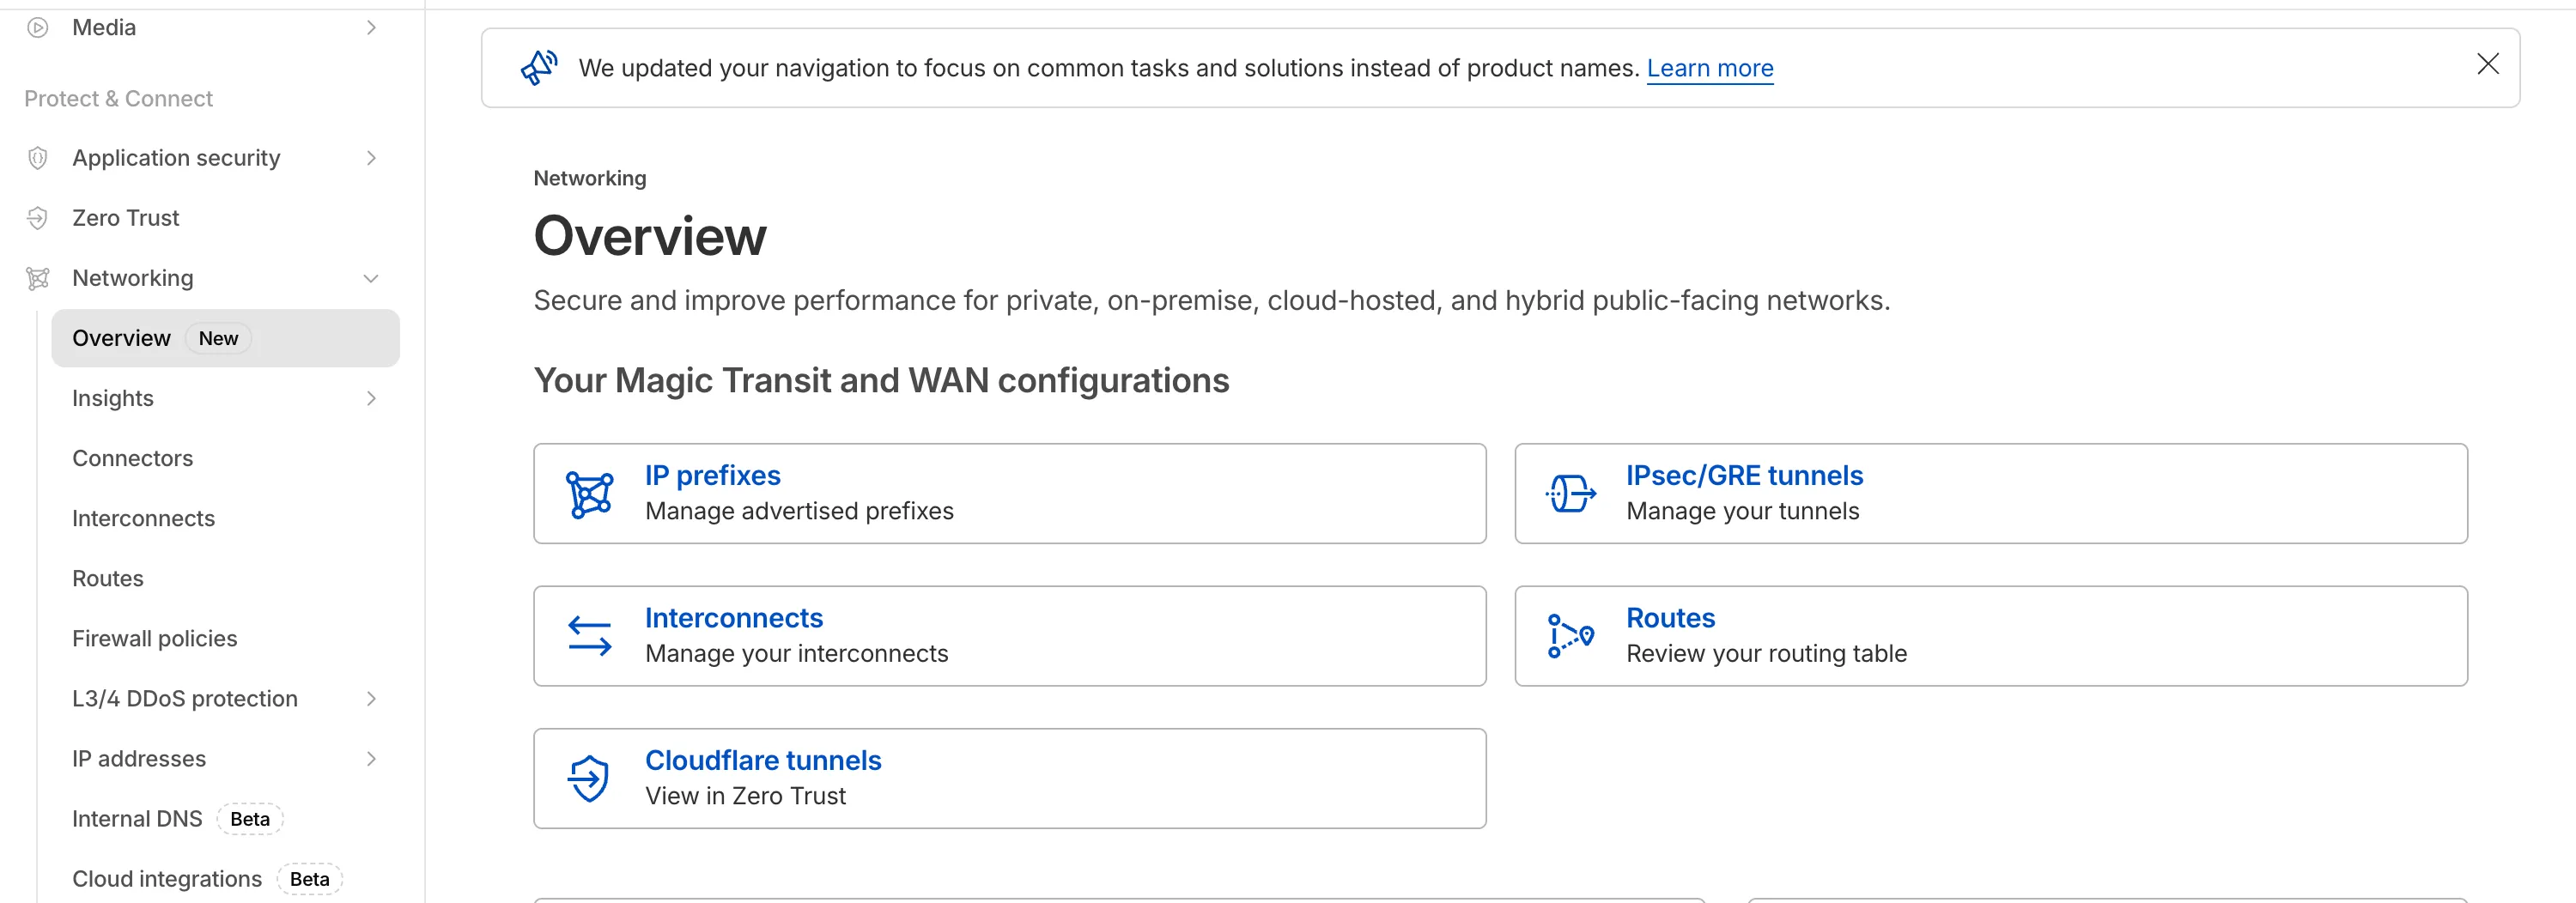
The Network Services menu structure in Cloudflare's dashboard has been updated to reflect solutions and capabilities instead of product names. This will make it easier for you to find what you need and better reflects how our services work together.
Your existing configurations will remain the same, and you will have access to all of the same features and functionality.
The changes visible in your dashboard may vary based on the products you use. Overall, changes relate to Magic Transit ↗, Magic WAN ↗, and Magic Firewall ↗.
Summary of changes:
- A new Overview page provides access to the most common tasks across Magic Transit and Magic WAN.
- Product names have been removed from top-level navigation.
- Magic Transit and Magic WAN configuration is now organized under Routes and Connectors. For example, you will find IP Prefixes under Routes, and your GRE/IPsec Tunnels under Connectors.
- Magic Firewall policies are now called Firewall Policies.
- Magic WAN Connectors and Connector On-Ramps are now referenced in the dashboard as Appliances and Appliance profiles. They can be found under Connectors > Appliances.
- Network analytics, network health, and real-time analytics are now available under Insights.
- Packet Captures are found under Insights > Diagnostics.
- You can manage your Sites from Insights > Network health.
- You can find Magic Network Monitoring under Insights > Network flow.
If you would like to provide feedback, complete this form ↗. You can also find these details in the January 7, 2026 email titled [FYI] Upcoming Network Services Dashboard Navigation Update.
We have expanded the reporting capabilities of the Cloudflare URL Scanner. In addition to existing JSON and HAR exports, users can now generate and download a PDF report directly from the Cloudflare dashboard. This update streamlines how security analysts can share findings with stakeholders who may not have access to the Cloudflare dashboard or specialized tools to parse JSON and HAR files.
Key Benefits:
- Consolidate scan results, including screenshots, security signatures, and metadata, into a single, portable document
- Easily share professional-grade summaries with non-technical stakeholders or legal teams for faster incident response
What’s new:
- PDF Export Button: A new download option is available in the URL Scanner results page within the Cloudflare dashboard
- Unified Documentation: Access all scan details—from high-level summaries to specific security flags—in one offline-friendly file
To get started with the URL Scanner and explore our reporting capabilities, visit the URL Scanner API documentation ↗.
We are excited to announce that Cloudflare Threat Events now supports the STIX2 (Structured Threat Information Expression) format. This was a highly requested feature designed to streamline how security teams consume and act upon our threat intelligence.
By adopting this industry-standard format, you can now integrate Cloudflare's threat events data more effectively into your existing security ecosystem.
-
Eliminate the need for custom parsers, as STIX2 allows for "out of the box" ingestion into major Threat Intel Platforms (TIPs), SIEMs, and SOAR tools.
-
STIX2 provides a standardized way to represent relationships between indicators, sightings, and threat actors, giving your analysts a clearer picture of the threat landscape.
For technical details on how to query events using this format, please refer to our Threat Events API Documentation ↗.
-