Turnstile Analytics shows widget statistics across traffic dimensions like hostname, country, browser, and IP address. Use these metrics to identify where challenge activity is highest and whether specific sources are failing or bypassing challenges.
- Top Hostnames: If the Turnstile widget is placed across multiple hostnames, this will display the highest traffic hostnames where challenges are being issued.
- Top Browsers: A breakdown of browsers that are most commonly encountering Turnstile challenges, helping customers spot trends in visitor traffic.
- Top Countries: View the top originating countries for visitors completing challenges, which can help identify regional traffic anomalies.
- Top User Agents: Identify which user agents are generating the most Turnstile challenge requests.
- Top ASNs ↗: Displays the highest volume of challenges issued from specific Autonomous System Numbers (ASNs), helping customers detect potential bot activity.
- Top Operating Systems: Shows which operating systems are most common among visitors passing or failing challenges.
- Top Source IPs ↗: Identify the highest-volume IP addresses issuing Turnstile challenges, which can be useful in identifying attack sources or repeated challenge failures.
To see an overview of your widget analytics:
Go to Turnstile ↗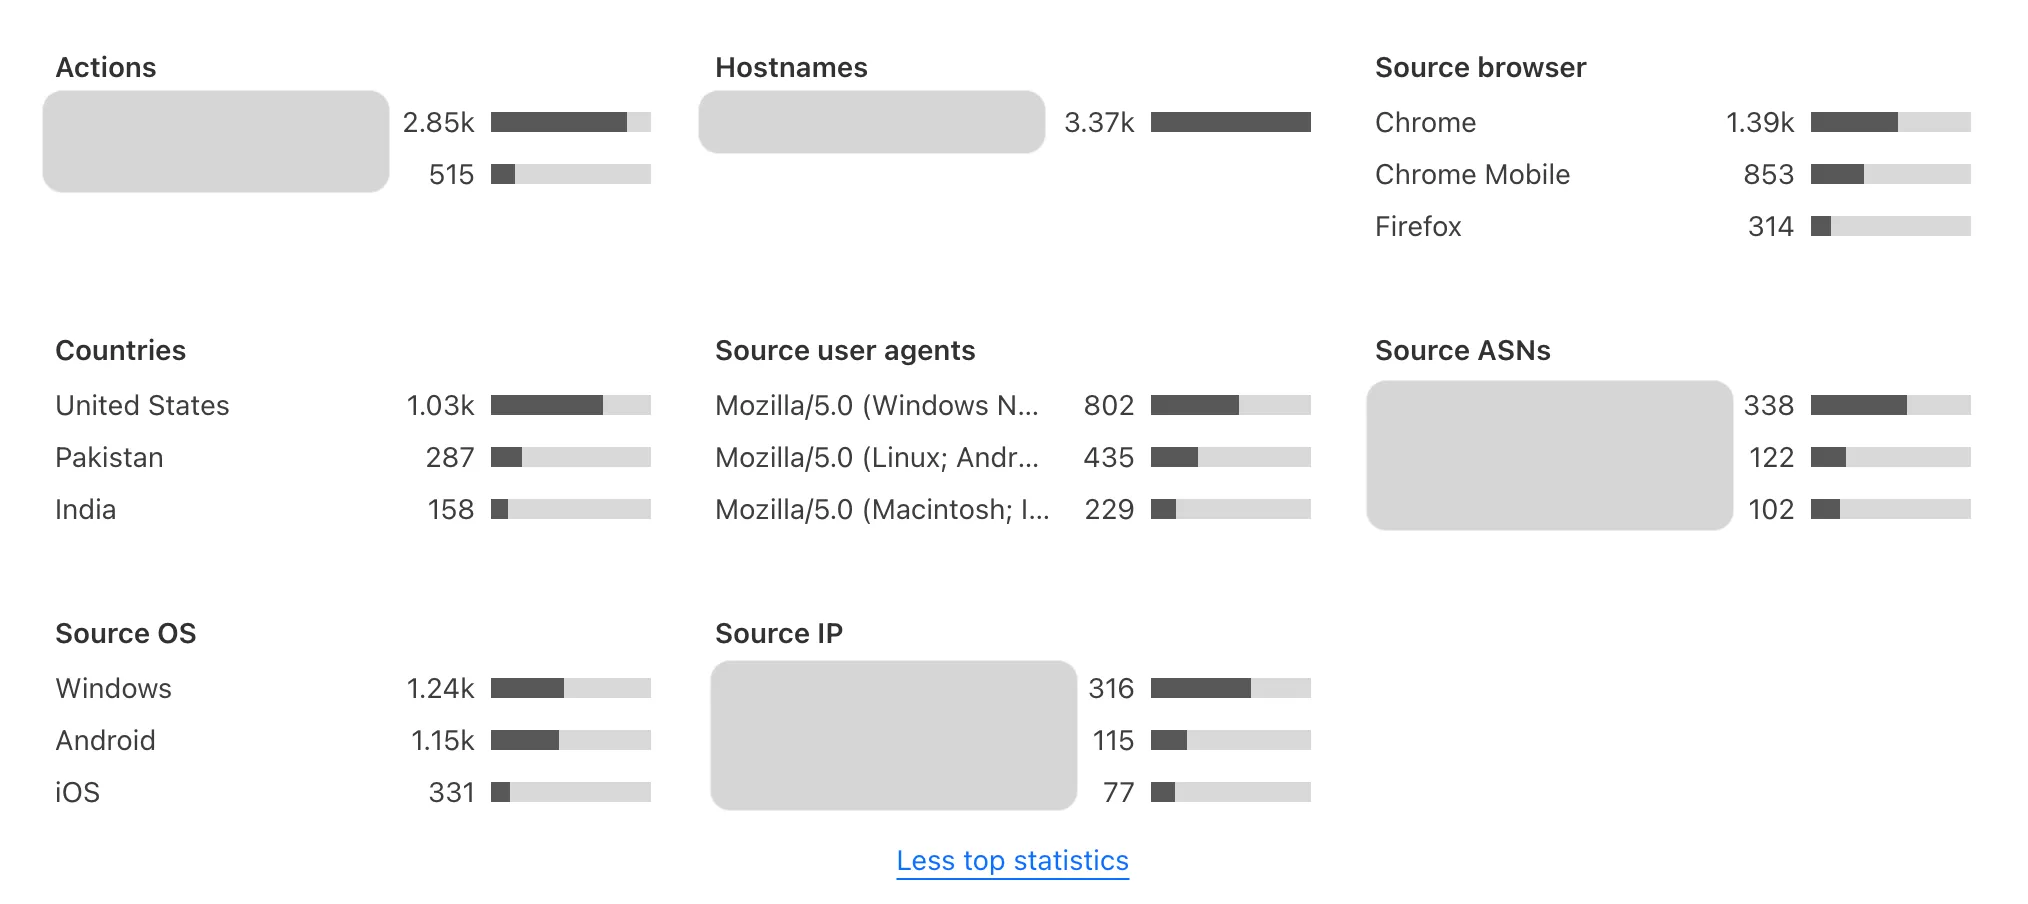
The metrics show changes in the solve rate, widget traffic, and top actions for your widget.
Refer to the pages below for more information about Turnstile Analytics: