Bot Analytics
Business and Enterprise customers without Bot Management can use Bot Analytics to dynamically examine bot traffic. These dashboards offer less functionality than Bot Management for Enterprise but still help you understand bot traffic on your domain.
You can access Bot Analytics by going to the Cloudflare dashboard ↗, and selecting your account and domain.
Old dashboard: Security > Bots.
New dashboard: Security > Analytics > Bot analysis.
For a full tour of Bot Analytics, see our blog post ↗. At a high level, the tool includes:
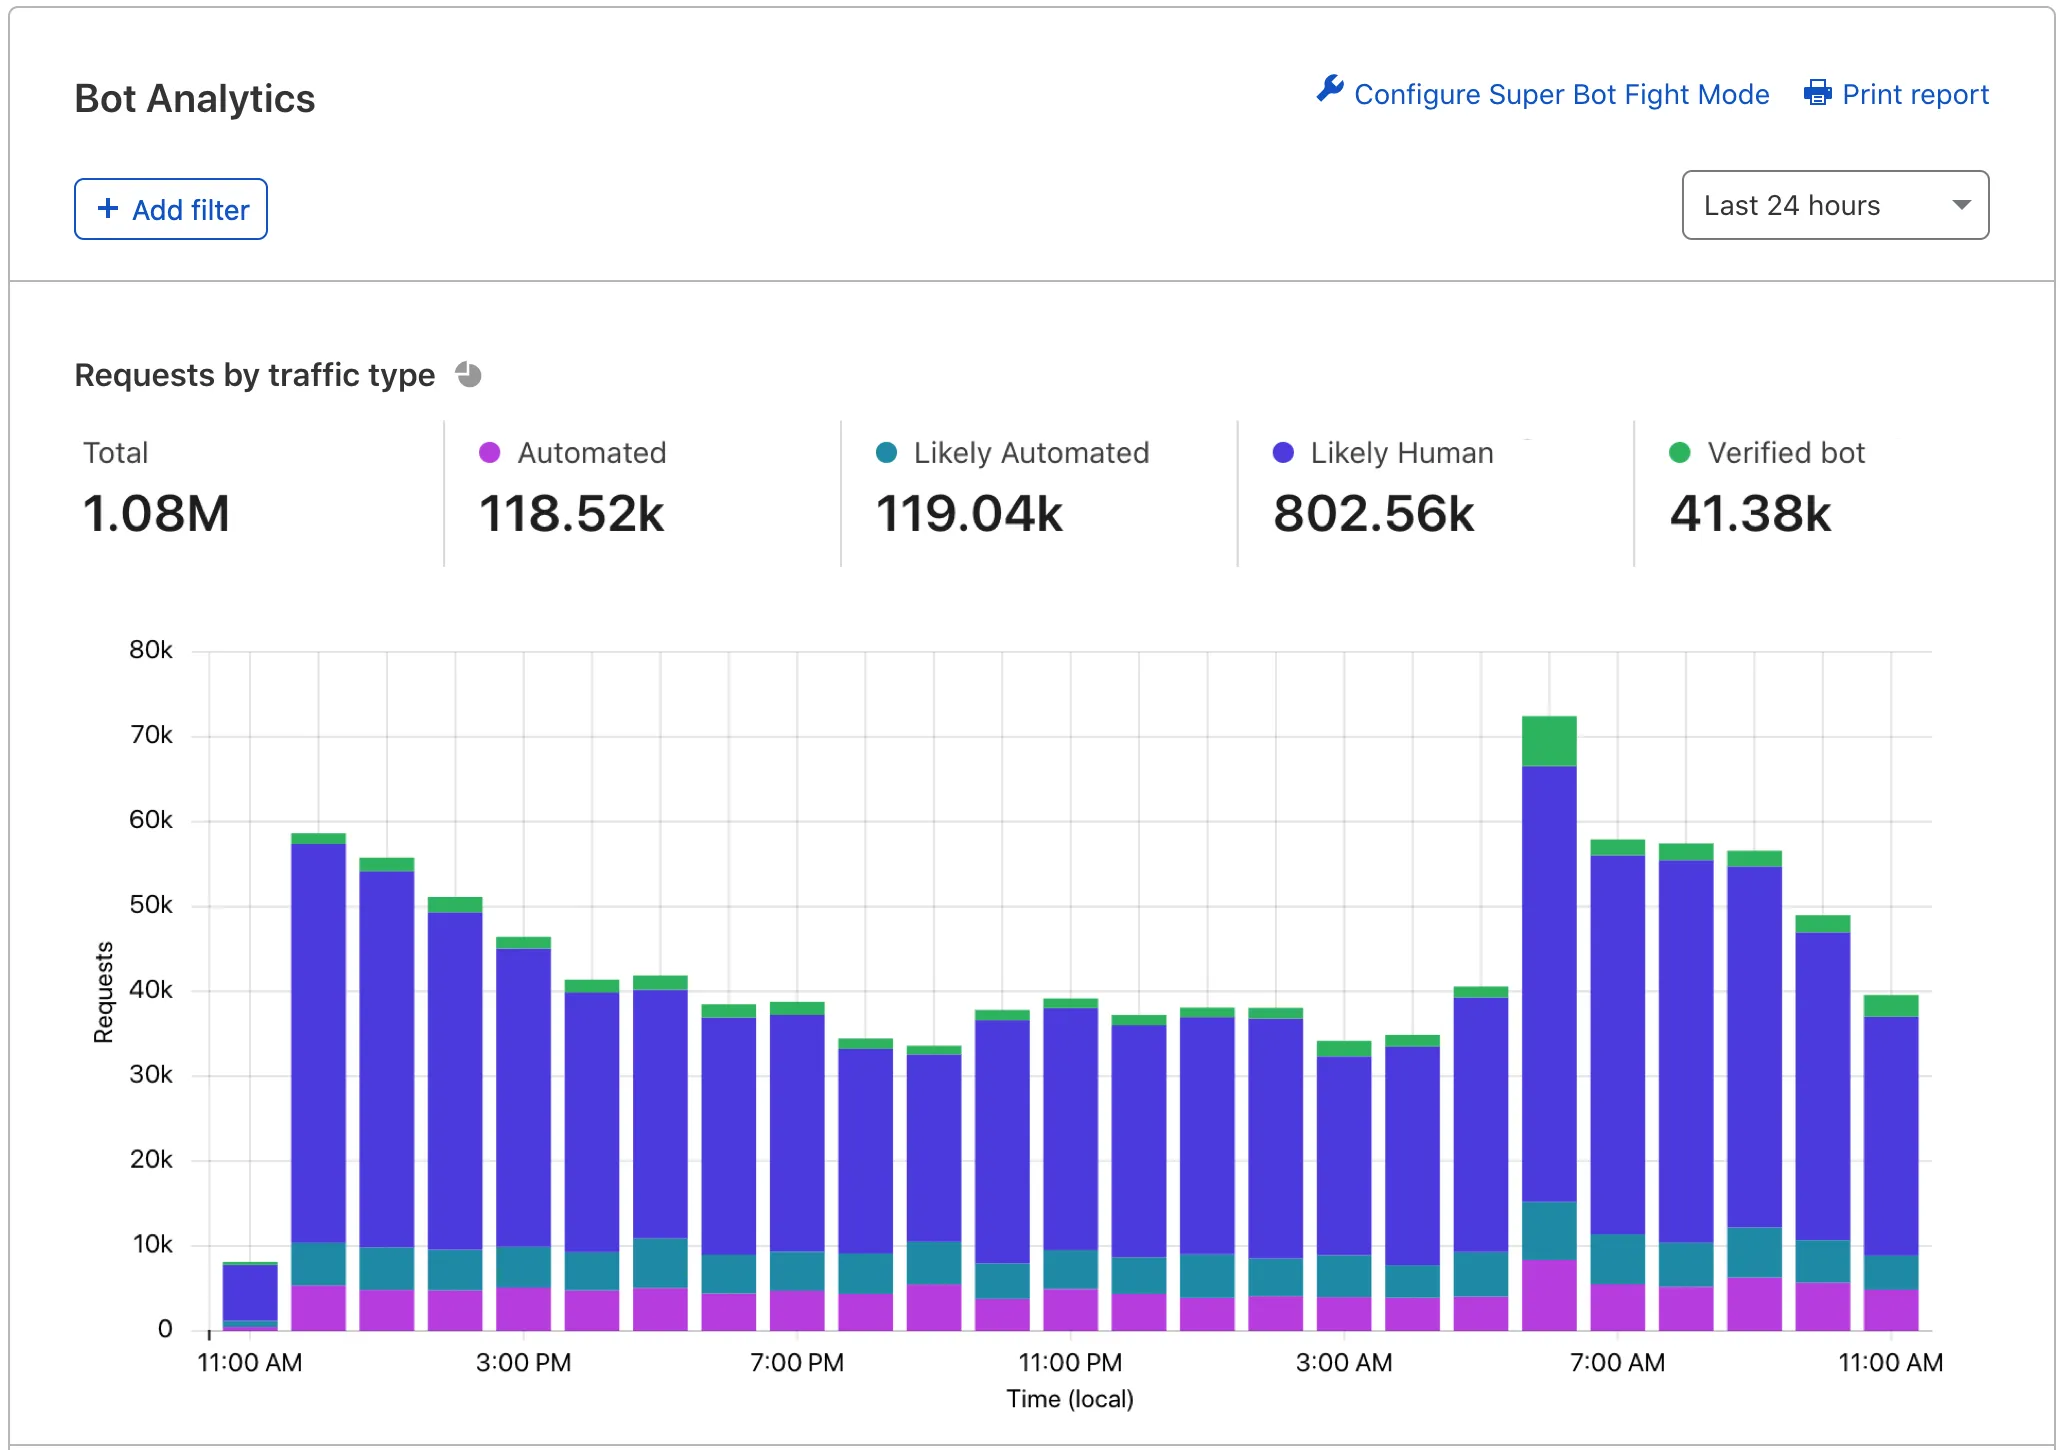
- Requests by traffic type: View your total domain traffic segmented vertically by traffic type. Keep an eye on automated and likely automated traffic.
- Requests by detection source: Identify the most common detection engines used to score your traffic. Hover over a tooltip to learn more about each engine.
- Top requests by attribute: View more detailed information on specific IP addresses and other characteristics.
Bot Analytics shows up to 72 hours of data at a time and can display data up to 30 days old. Bot Analytics displays data in real time in most cases.
Cloudflare uses adaptive bitrate technology to show sampled data — most customers will see a 1-10% sample depending on how much information they are trying to view. Tooltips on the page will display the current sample rate.
Business and Enterprise customers without Bot Management can use Bot Analytics to:
- Understand bot traffic
- Study recent attacks to find trends and detailed information
- Learn more about Cloudflare’s detection engines with real data
For more details and granular control over bot traffic, consider upgrading to Bot Management for Enterprise.
Enterprise customers with Bot Management can use Bot Analytics to dynamically examine bot traffic.
You can access Bot Analytics by going to the Cloudflare dashboard ↗, and selecting your account and domain.
Old dashboard: Security > Bots.
New dashboard: Security > Analytics > Bot analysis.
For a full tour of Bot Analytics, see our blog post ↗. At a high level, the tool includes:
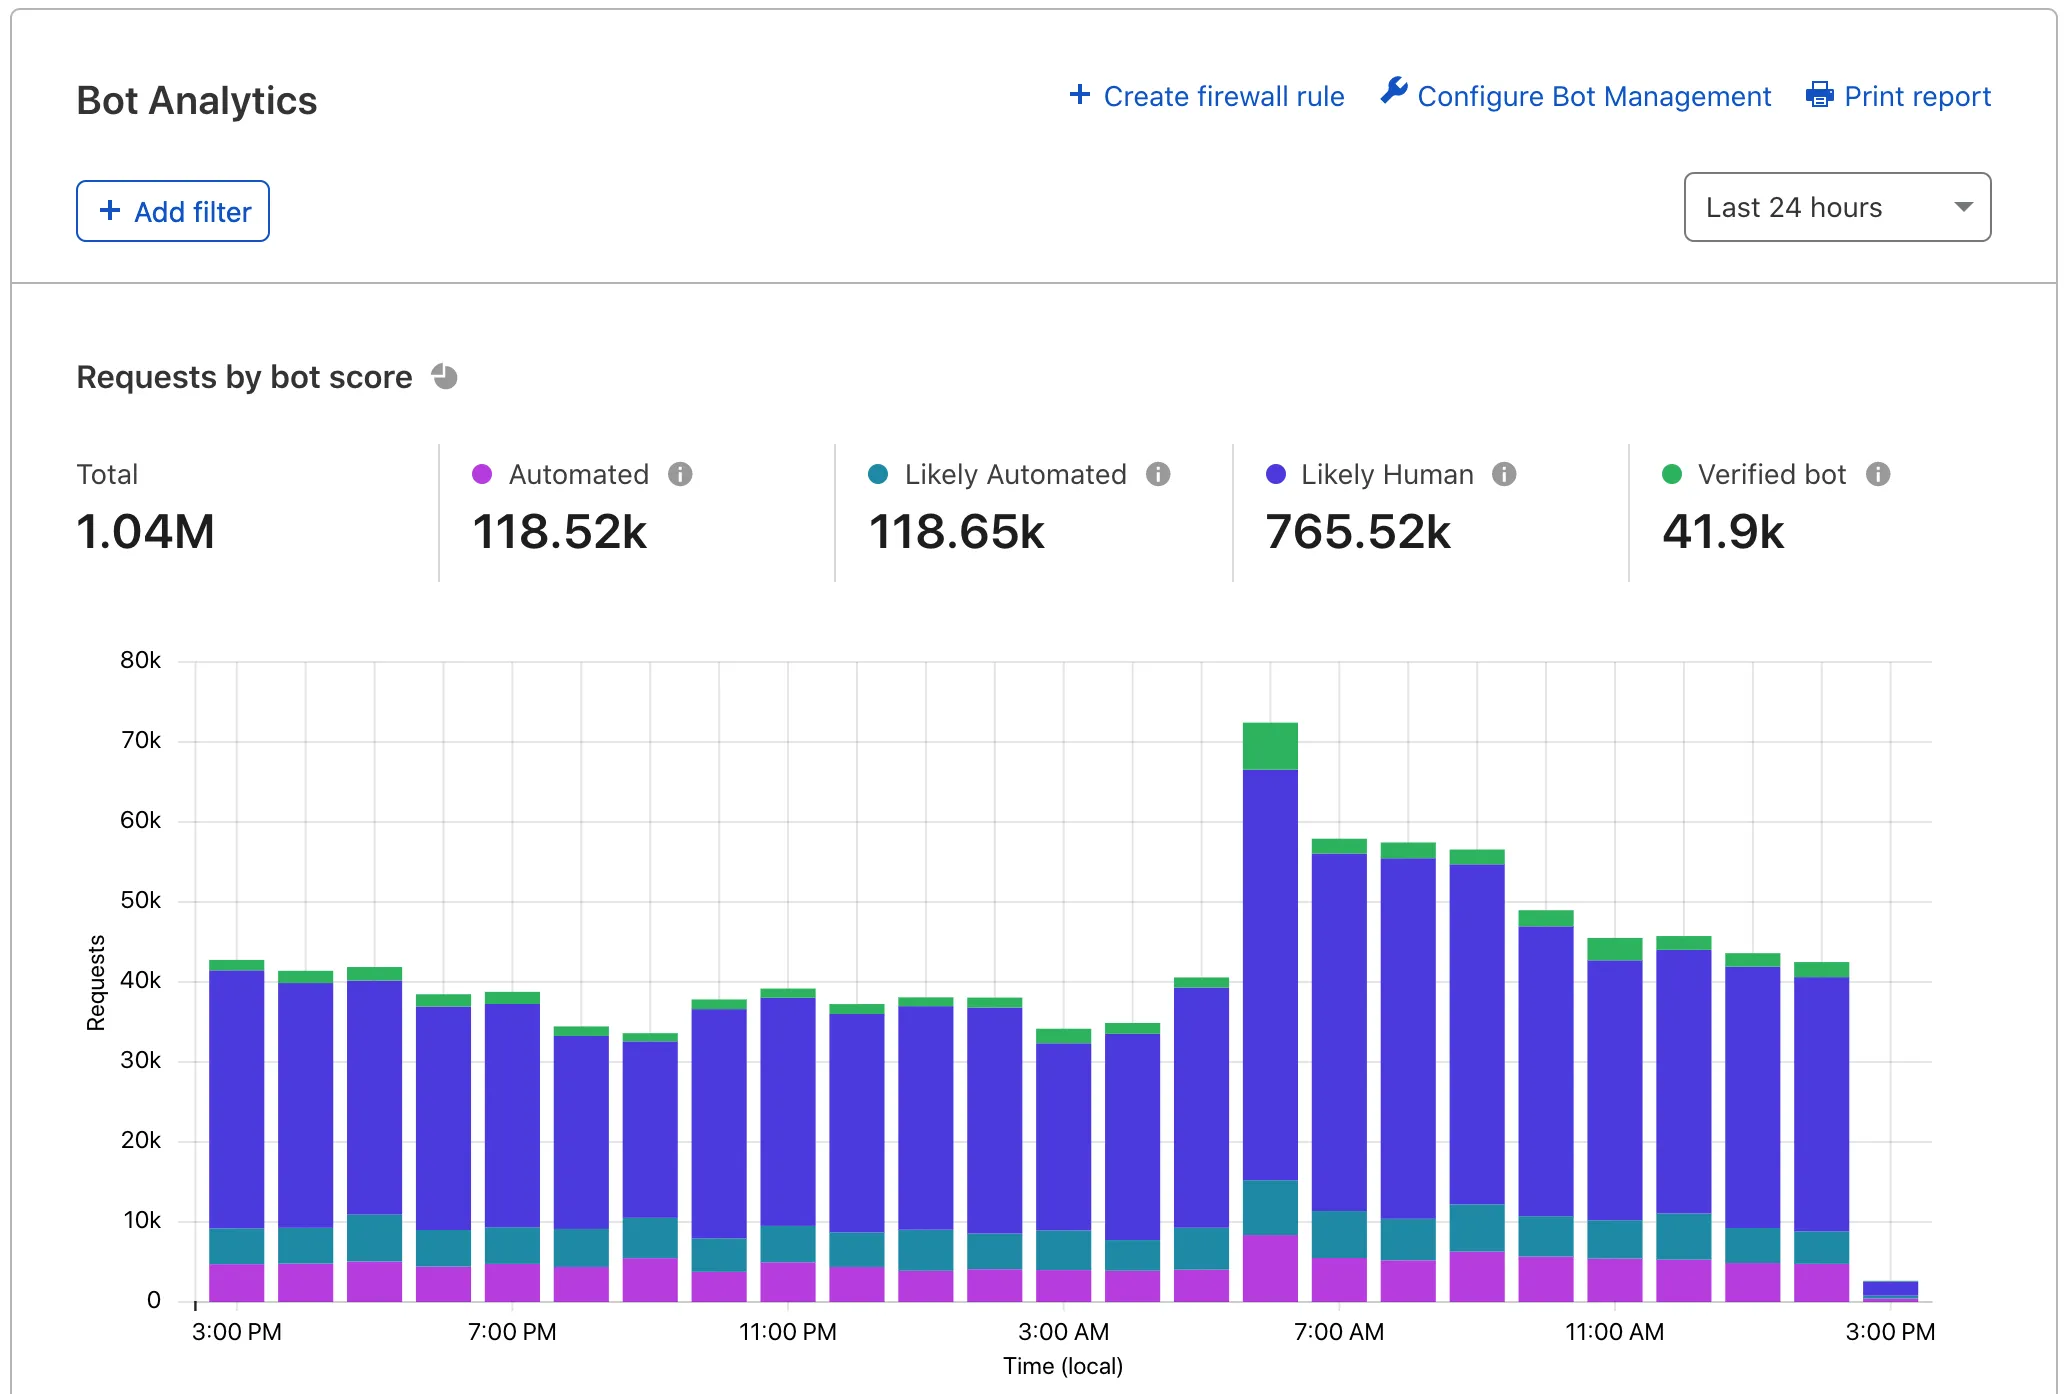
- Requests by bot score: View your total domain traffic and segment it vertically by traffic type. Keep an eye on automated and likely automated traffic.
- Bot score distribution: View the number of requests assigned a bot score 1 through 99.
- Bot score source: Identify the most common detection engines used to score your traffic. Hover over a tooltip to learn more about each engine.
- Top requests by attribute: View more detailed information on specific IP addresses and other characteristics.
Bot Analytics shows up to one week of data at a time and can display data up to 30 days old. Bot Analytics displays data in real time in most cases.
Cloudflare uses adaptive bitrate technology to show sampled data — most customers will see a 1-10% sample depending on how much information they are trying to view. Tooltips on the page will display the current sample rate.
Bot Management customers can use Bot Analytics to:
- Understand traffic during your onboarding phase.
- Tune WAF custom rules to be effective but not overly aggressive.
- Study recent attacks to find trends and detailed information.
- Learn more about Cloudflare’s detection engines with real data.
Data from Bot Analytics is also available via the GraphQL API. You can access bot scores, bot sources, , and bot decisions (automated, likely automated, etc.), and more.
Read the GraphQL Analytics API documentation for more information about GraphQL and basic querying.