Make comparisons
When comparing time series, across locations/time ranges/etc., in endpoints that normalize values using min-max, you must do so in the same request. This is done by asking for multiple series. All values will then be normalized using the same minimum and maximum value and can safely be compared against each other.
NetFlows values are normalized using min0-max, so we will use it as an example. Refer to Get NetFlow time series for more information.
In the following example, we will compare the traffic change across two different locations — United States and Portugal. The example will use alpha-2 codes ↗ for the last seven days:
curl "https://api.cloudflare.com/client/v4/radar/netflows/timeseries?name=us_data&dateRange=7d&location=US&name=pt_data&dateRange=7d&location=PT&format=json" \--header "Authorization: Bearer <API_TOKEN>"In the example above we are asking for two timeseries. The first series has the following parameters:
name=us_data&dateRange=7d&location=US
The second series has the following parameters:
name=pt_data&dateRange=7d&location=PT
All of these parameters are arrays, and it is the position in the array that defines the series the filter belongs to. Refer to NetFlow's endpoint for more information on the available parameters.
The response (shortened below for brevity) uses the provided name property to wrap the timestamps and corresponding values. If we chart this data, it becomes obvious that Cloudflare received much less traffic from Portugal than from the United States.
{ "success": true, "errors": [], "result": { "us_data": { "timestamps": [ "2022-10-26T17:00:00Z", "2022-11-02T15:00:00Z" ], "values": [ "0.871752", "1" ] }, "pt_data": { "timestamps": [ "2022-10-26T17:00:00Z", "2022-11-02T15:00:00Z" ], "values": [ "0.020457", "0.012313" ] }, "meta": { "dateRange": { "startTime": "2022-10-26T17:00:00Z", "endTime": "2022-11-02T17:00:00Z" }, "aggInterval": "ONE_HOUR", // ... } }}Comparisons can be made in most endpoints, not just endpoints that use min-max.
In the next example, we will compare the United States across different date ranges using the shortcuts 7d and 7dControl. These mean the last seven days and the last seven days before those, respectively — or, in other words, this week versus the previous week.
curl "https://api.cloudflare.com/client/v4/radar/netflows/timeseries?name=this_week&dateRange=7d&location=US&name=previous_week&dateRange=7dControl&location=US&format=json" \--header "Authorization: Bearer <API_TOKEN>"The first series has these parameters:
name=this_week&dateRange=7d&location=US
The second series has the following parameters:
name=previous_week&dateRange=7dControl&location=US
Now, in the result property, you should get something like this:
{ "this_week": { "timestamps": [ "2022-10-27T13:00:00Z", "2022-10-27T14:00:00Z", "...", "2022-11-03T12:00:00Z" ], "values": [ "0.794321", "1", "...", "0.718433"] }, "previous_week": { "timestamps": [ "2022-10-20T13:00:00Z", "2022-10-20T14:00:00Z", "...", "2022-10-27T12:00:00Z" ], "values": [ "0.774392", "0.835071", "...", "0.720181"] }}Examining this information, we can conclude that the maximum value was reached at 2022-10-27T14:00:00Z (all Radar timestamps are in Coordinated Universal Time (UTC)). We can also check what the date range shortcuts 7d and 7dControl were resolved to at the time this was run.
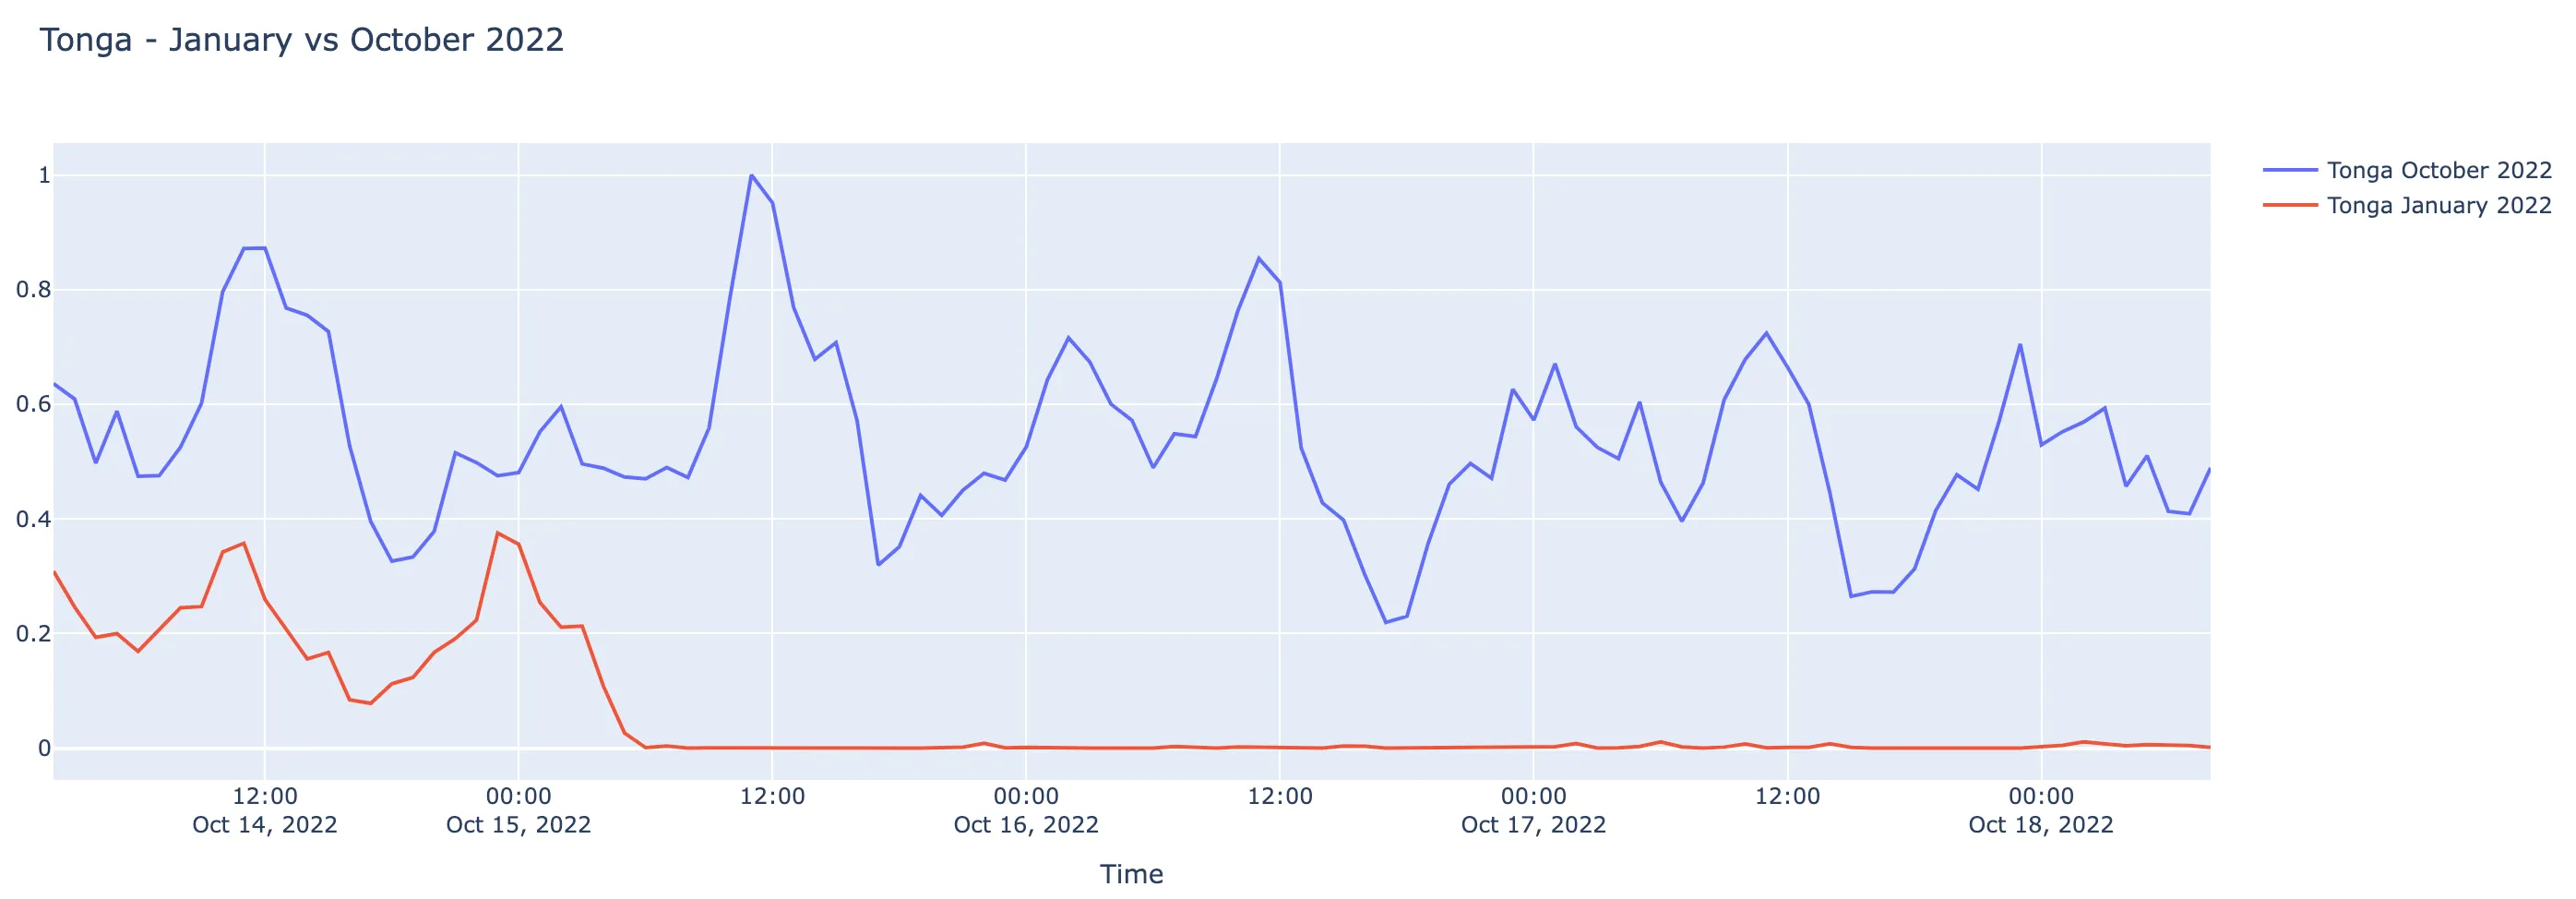
You can also request for specific timestamps. In the following example, we will ask for data relative to Tonga ↗ in October versus January 2022, when there was an outage.
curl "https://api.cloudflare.com/client/v4/radar/netflows/timeseries?name=tonga&dateStart=2022-10-15T02%3A00%3A00Z&dateEnd=2022-10-15T05%3A00%3A00Z&location=TO&name=tonga_outage&dateStart=2022-01-15T02%3A00%3A00Z&dateEnd=2022-01-15T05%3A00%3A00Z&location=TO&format=json&aggInterval=1h" \--header "Authorization: Bearer <API_TOKEN>"The first series has these parameters (URL encoded):
name=tonga&dateStart=2022-10-15T02%3A00%3A00Z&dateEnd=2022-10-15T05%3A00%3A00Z%&location=TO
The second series has these parameters:
name=tonga_outage&dateStart=2022-01-15T02%3A00%3A00Z&&dateEnd=2022-01-15T05%3A00%3A00Z&location=TO
In the above example, we requested for an aggregation interval of one hour (aggInterval=1h), so that the results could be shown in this page. format and aggInterval are not arrays, as specified in the API reference, and apply globally to all series in the request.
The result property should return a response like this:
{ "tonga": { "timestamps": ["2022-10-15T02:00:00Z", "2022-10-15T03:00:00Z", "2022-10-15T04:00:00Z", "2022-10-15T05:00:00Z"], "values": ["1.0", "0.832473", "0.820083", "0.79408"] }, "tonga_outage": { "timestamps": ["2022-01-15T02:00:00Z", "2022-01-15T03:00:00Z", "2022-01-15T04:00:00Z", "2022-01-15T05:00:00Z"], "values": ["0.354105", "0.357287", "0.181811", "0.044198"] }}This shows how traffic dropped to almost zero during the outage. If we chart it and set the end date to January 18 to make it clearer, we get the following:
Refer to the Investigate section to drill down on the data Radar returns, such as NetFlows.