
Custom Dashboards are now available to all Cloudflare customers. Build personalized views that highlight the metrics most critical to your infrastructure and security posture, moving beyond standard product dashboards.
This update significantly expands the data available for visualization. Build charts based on any of the 100+ datasets available via the Cloudflare GraphQL API, covering everything from WAF events and Workers metrics to Load Balancing and Zero Trust logs.
For Log Explorer customers, you can now turn raw log queries directly into dashboard charts. When you identify a specific pattern or spike while investigating logs, save that query as a visualization to monitor those signals in real-time without leaving the dashboard.
- Unified visibility: Consolidate signals from different Cloudflare products (for example, HTTP Traffic and R2 Storage) into a single view.
- Flexible monitoring: Create charts that focus on specific status codes, ASN regions, or security actions that matter to your business.
- Expanded limits: Log Explorer customers can create up to 100 dashboards (up from 25 for standard customers).
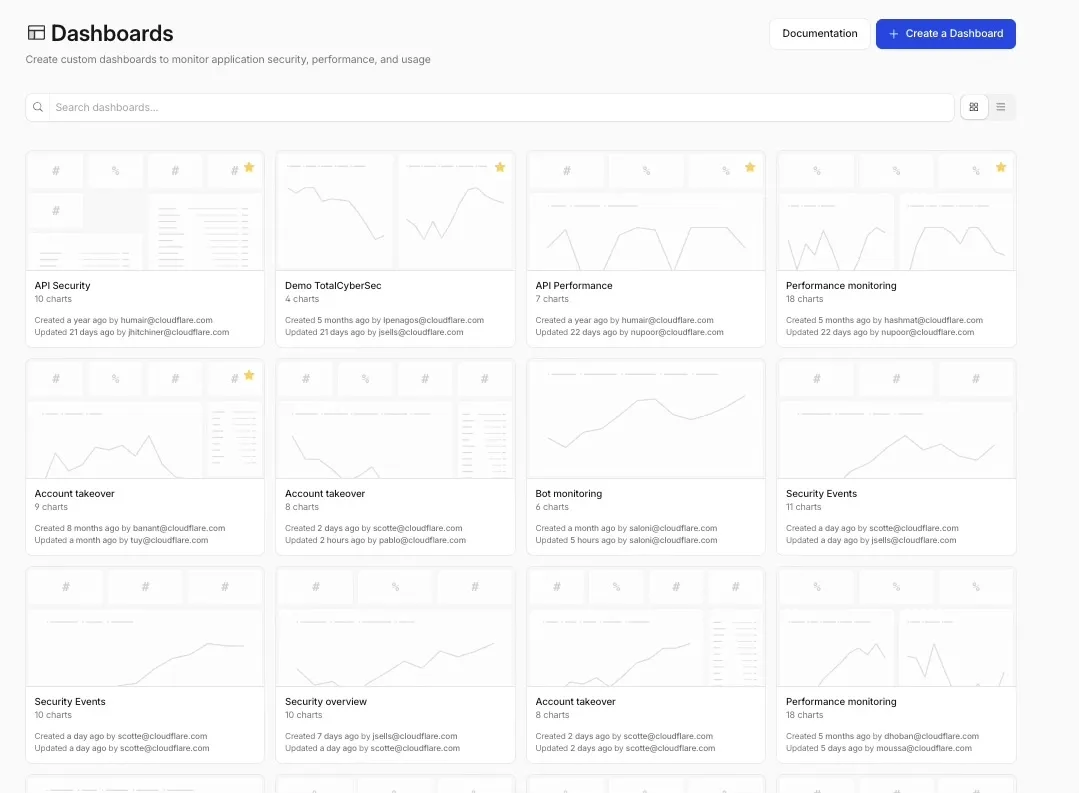
To get started, refer to the Custom Dashboards documentation.
The Server-Timing header now includes a new
cfWorkermetric that measures time spent executing Cloudflare Workers, including any subrequests performed by the Worker. This helps developers accurately identify whether high Time to First Byte (TTFB) is caused by Worker processing or slow upstream dependencies.Previously, Worker execution time was included in the
edgemetric, making it harder to identify true edge performance. The newcfWorkermetric provides this visibility:Metric Description edgeTotal time spent on the Cloudflare edge, including Worker execution originTime spent fetching from the origin server cfWorkerTime spent in Worker execution, including subrequests but excluding origin fetch time Server-Timing: cdn-cache; desc=DYNAMIC, edge; dur=20, origin; dur=100, cfWorker; dur=7In this example, the edge took 20ms, the origin took 100ms, and the Worker added just 7ms of processing time.
The
cfWorkermetric is enabled by default if you have Real User Monitoring (RUM) enabled. Otherwise, you can enable it using Rules.This metric is particularly useful for:
- Performance debugging: Quickly determine if latency is caused by Worker code, external API calls within Workers, or slow origins.
- Optimization targeting: Identify which component of your request path needs optimization.
- Real User Monitoring (RUM): Access detailed timing breakdowns directly from response headers for client-side analytics.
For more information about Server-Timing headers, refer to the W3C Server Timing specification ↗.
The cached/uncached classification logic used in Zone Overview analytics has been updated to improve accuracy.
Previously, requests were classified as "cached" based on an overly broad condition that included blocked 403 responses, Snippets requests, and other non-cache request types. This caused inflated cache hit ratios — in some cases showing near-100% cached — and affected approximately 15% of requests classified as cached in rollups.
The condition has been removed from the Zone Overview page. Cached/uncached classification now aligns with the heuristics used in HTTP Analytics, so only requests genuinely served from cache are counted as cached.
What changed:
- Zone Overview — Cache ratios now reflect actual cache performance.
- HTTP Analytics — No change. HTTP Analytics already used the correct classification logic.
- Historical data — This fix applies to new requests only. Previously logged data is not retroactively updated.
The GraphQL Analytics API now supports confidence intervals for
sumandcountfields on adaptive (sampled) datasets. Confidence intervals provide a statistical range around sampled results, helping verify accuracy and quantify uncertainty.- Supported datasets: Adaptive (sampled) datasets only.
- Supported fields: All
sumandcountfields. - Usage: The confidence
levelmust be provided as a decimal between 0 and 1 (e.g.0.90,0.95,0.99). - Default: If no confidence level is specified, no intervals are returned.
For examples and more details, see the GraphQL Analytics API documentation.
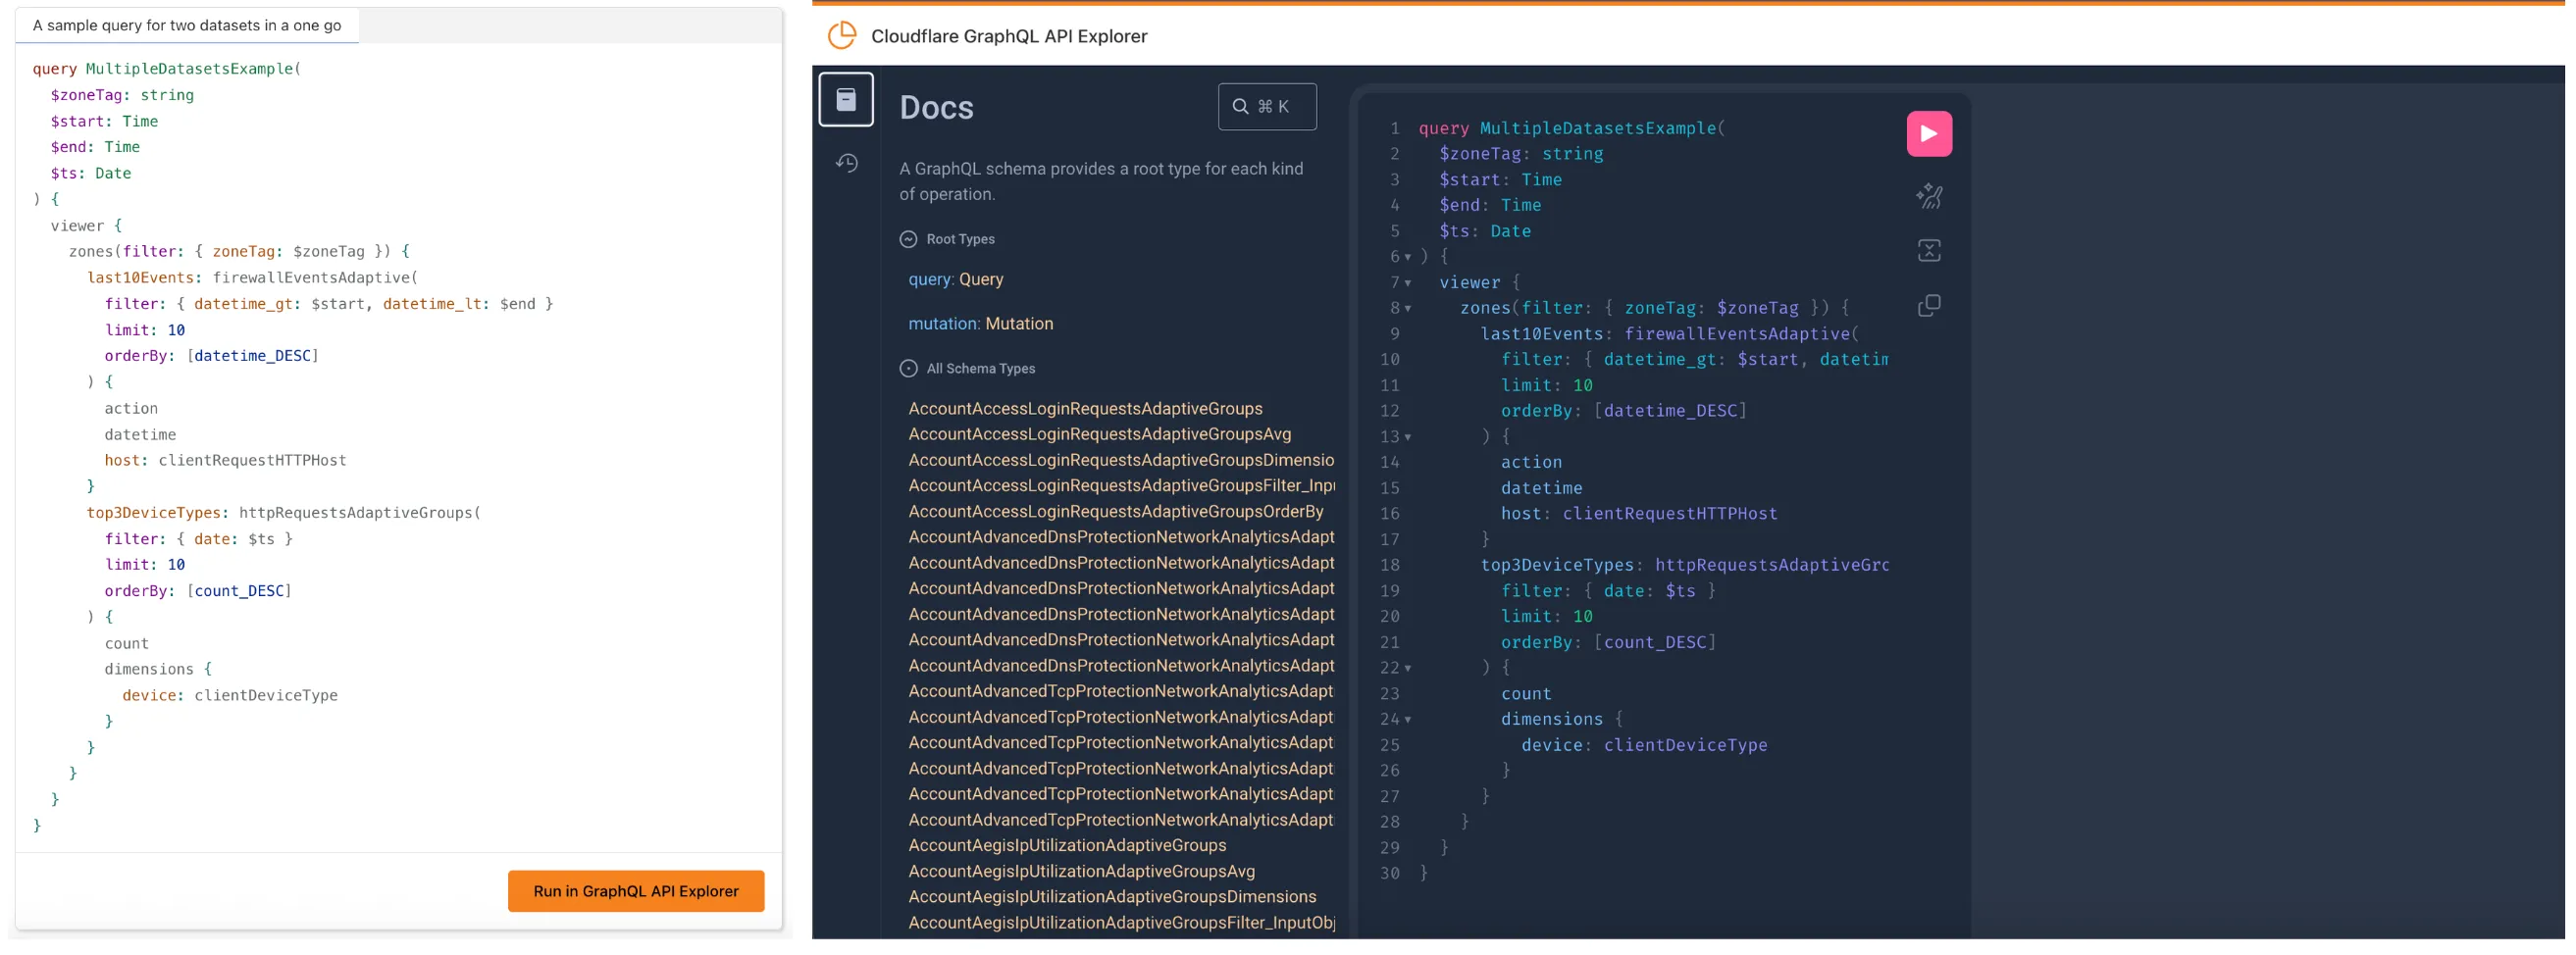
We’ve launched two powerful new tools to make the GraphQL Analytics API more accessible:
The new GraphQL API Explorer ↗ helps you build, test, and run queries directly in your browser. Features include:
- In-browser schema documentation to browse available datasets and fields
- Interactive query editor with autocomplete and inline documentation
- A "Run in GraphQL API Explorer" button to execute example queries from our docs
- Seamless OAuth authentication — no manual setup required
MCP Servers let you use natural language tools like Claude to generate structured queries against your data. See our blog post ↗ for details on how they work and which servers are available. The new GraphQL MCP server ↗ helps you discover and generate useful queries for the GraphQL Analytics API. With this server, you can:
- Explore what data is available to query
- Generate and refine queries using natural language, with one-click links to run them in the API Explorer
- Build dashboards and visualizations from structured query outputs
Example prompts include:
- “Show me HTTP traffic for the last 7 days for example.com”
- “What GraphQL node returns firewall events?”
- “Can you generate a link to the Cloudflare GraphQL API Explorer with a pre-populated query and variables?”
We’re continuing to expand these tools, and your feedback helps shape what’s next. Explore the documentation to learn more and get started.