Page load time
Page load time summary gives you an overview of how long your web page takes to load, broken down by area. To access Page load time:
- Go to Web Analytics ↗ from your account home page, and choose a website.
- Select Page load time.
Below is a list of all the components you can inspect:
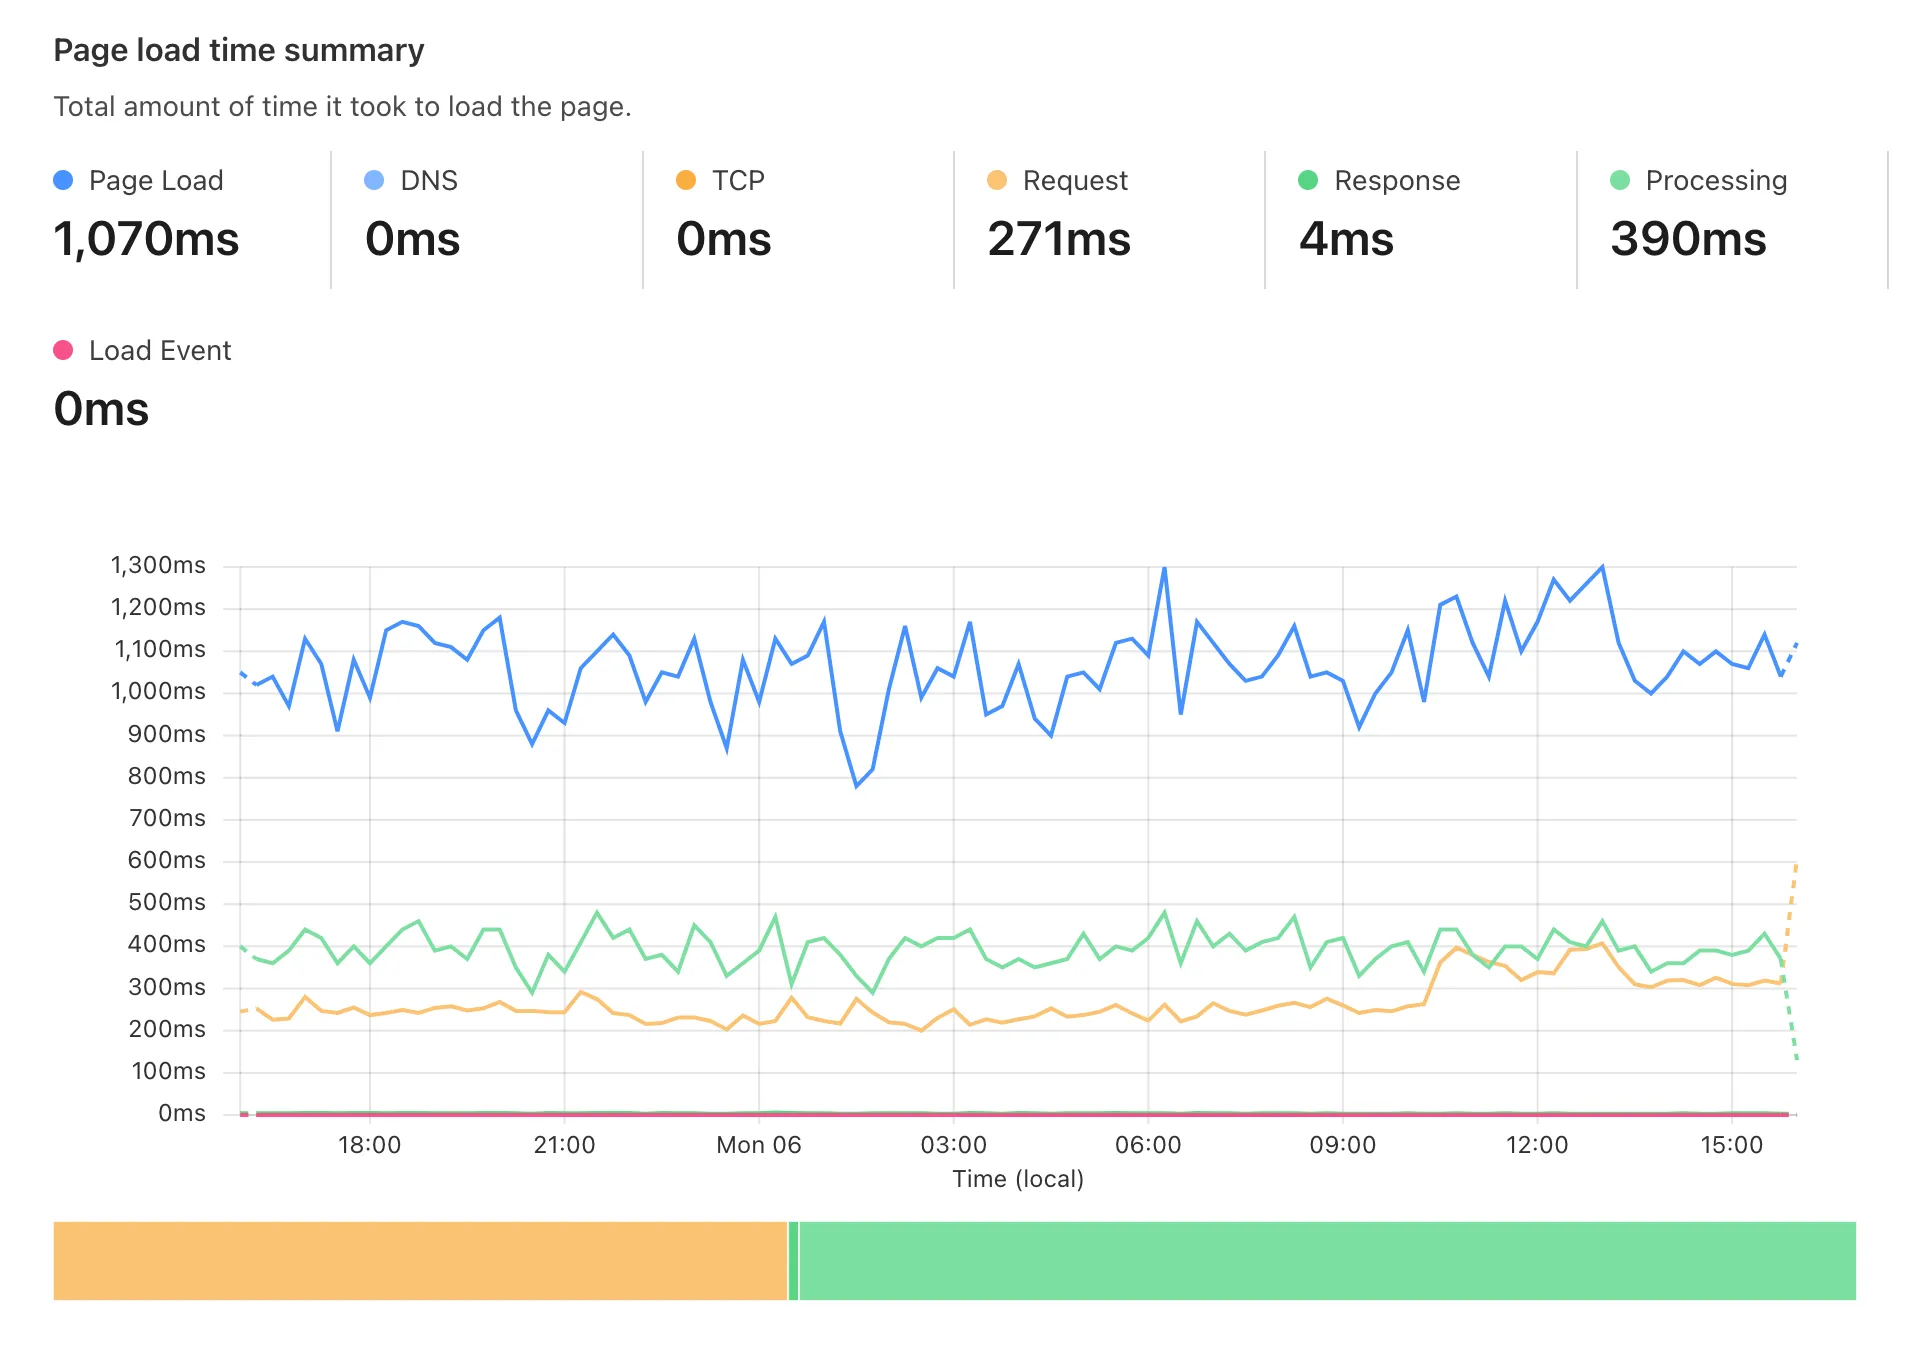
The total amount of time required to load the page. Note that page load time does not correspond to the sum of the other timings available in Web Analytics. This happens because the page load time also includes timings that are not displayed, such as pre-DNS lookup timings and unattributed gaps between timing metrics.
How long a DNS query takes. This could appear as zero for reused connections or content stored in the local cache (memory or disk).
How long it takes to establish a TCP connection with the server. If using HTTPS, this process includes TLS negotiation time.
The time elapsed between making an HTTP request and receiving the first byte of the response.
The time elapsed between the first byte and the last byte of the received response. Think of this as a resource download time.
How long it took to render the page. This includes loading any resources that block page rendering, including images, scripts, and style sheets. If this number is big, optimize your document architecture, resource size, or configure settings in the Cloudflare Speed app. This document process can be drilled down more with domInteractive, domContentLoadedEventStart, domContentLoadedEventEnd, and domComplete.
An event triggered by the browser when a document and its resources finish loading. The Load Event duration may be a useful metric if you have additional functions or any logic for the load event.
To make Web Analytics work, Cloudflare collects several types of data points. These are the additional data points collected for Paint Timings:
The time between navigation and when the browser renders the first pixels to the screen.
Time when the browser renders the first bit of content from the DOM.