Core Web Vitals
Core Web Vitals ↗ are high-level metrics designed by Google to capture the user experience. Three core Web Vitals metrics are measured: Largest Contentful Paint, First Input Delay, and Cumulative Layout Shift. Each of these metrics is automatically assigned a rating of Good, Needs Improvement, or Poor based on the industry standard methodology and testing designed by Google. Page load time statistics are supplemented by First Paint and First Contentful Paint.
Core Web Vitals enables you to easily pinpoint which elements in a web page are affecting the user's experience while browsing your website, in a visual form. To access Core Web Vitals:
-
In the Cloudflare dashboard, go to the Web Analytics page.
Go to Web analytics -
Select your website and select Core Web Vitals.
Core Web Vitals is divided into three main sections, each one with information about a specific feature that affects user experience:
- Largest Contentful Paint (LCP) ↗: Measures perceived load speed by the user. It returns how long the main content of the page takes to be loaded.
- Interaction to Next Paint (INP) ↗: Measures user interface responsiveness – how quickly a website responds to user interactions like clicks or key presses.
- Cumulative Layout Shift (CLS) ↗: Measures visual stability, that is, if there are shifts in the page layout as the various elements are being loaded into view.
Each of these metrics represents an impact to the user experience, which is quantified and graded by Web Analytics.
Cloudflare Web Analytics offers interactive exploration in Core Web Vitals by allowing you to filter data by URL, Browser, Operating System, Country, and Element.
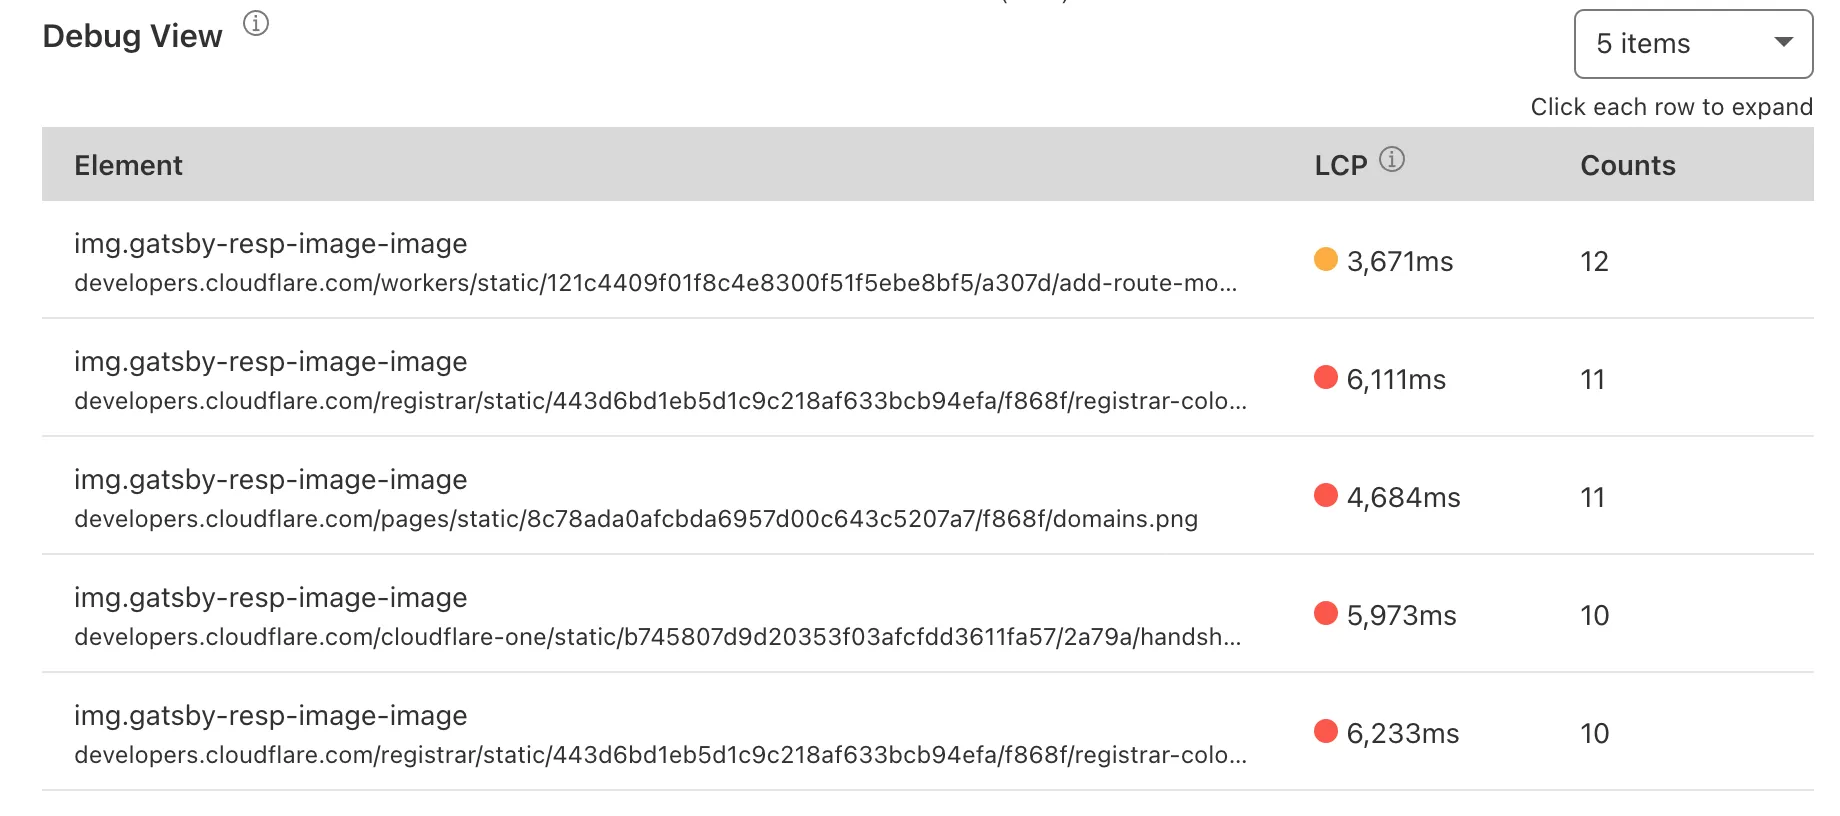
Below each graph, the Debug View section has the top five elements with a negative impact on each metric. Selecting the elements shown in the data table gives you more details about them.
Each table — LCP, INP, and CLS — also shows you the performance of these elements in the 75th percentile (P75) at a glance. Selecting in each row of the table lets you expand the element and have access to more information, including P50, P90 and P99 metrics.
These numbers refer to how an element performs relatively to others in your page. For example, if an element takes 3,900 ms to load and is in the 75 percentile, this means that it is slower to load than 75% of the elements in your page.
Web Analytics uses its lightweight JavaScript beacon to collect the information Vitals Explorer uses. It does not use any client-side state, such as cookies or localStorage, to collect usage metrics. Vitals Explorer also does not fingerprint individuals via their IP address, User Agent string, or any other data.
A CSS selector representing the DOM node. With this string, you can use document.querySelector(<element_name>) in the dev console of your browser to find out which DOM node has a negative impact on your scores/values.
The URL path at the time the Core Web Vitals are captured.
The metric value ↗ for each Core Web Vitals. This value is in milliseconds for LCP or NIP and a score for CLS.
The source URL (such as image, text, web fonts).
The source object's size in bytes.
Layout information is a JSON value that includes width, height, x axis position, y axis position, left, right, top, and bottom. These values represent the layout shifts that happen on the page.
Captures the layout information of the DOM element with the largest area, after the shift in the page has occurred. This JSON value is shown as Current in the Debug View section. To access it, scroll to the Cumulative Layout Shifts (CLS) graphic > Debug View. Select any element from that table to access the Layout Shifts section, where Current is presented.
Captures the layout information of the DOM element with the largest area, before the shift in the page has occurred. This JSON value is shown as Previous in the Debug View section. To access it, scroll to the Cumulative Layout Shifts (CLS) graphic > Debug View. Select any element from that table to access the Layout Shifts section, where Previous is presented.