
Network session analytics dashboard
The new Network session analytics dashboard is now available in Cloudflare One. This dashboard provides visibility into your network traffic patterns, helping you understand how traffic flows through your Cloudflare One infrastructure.
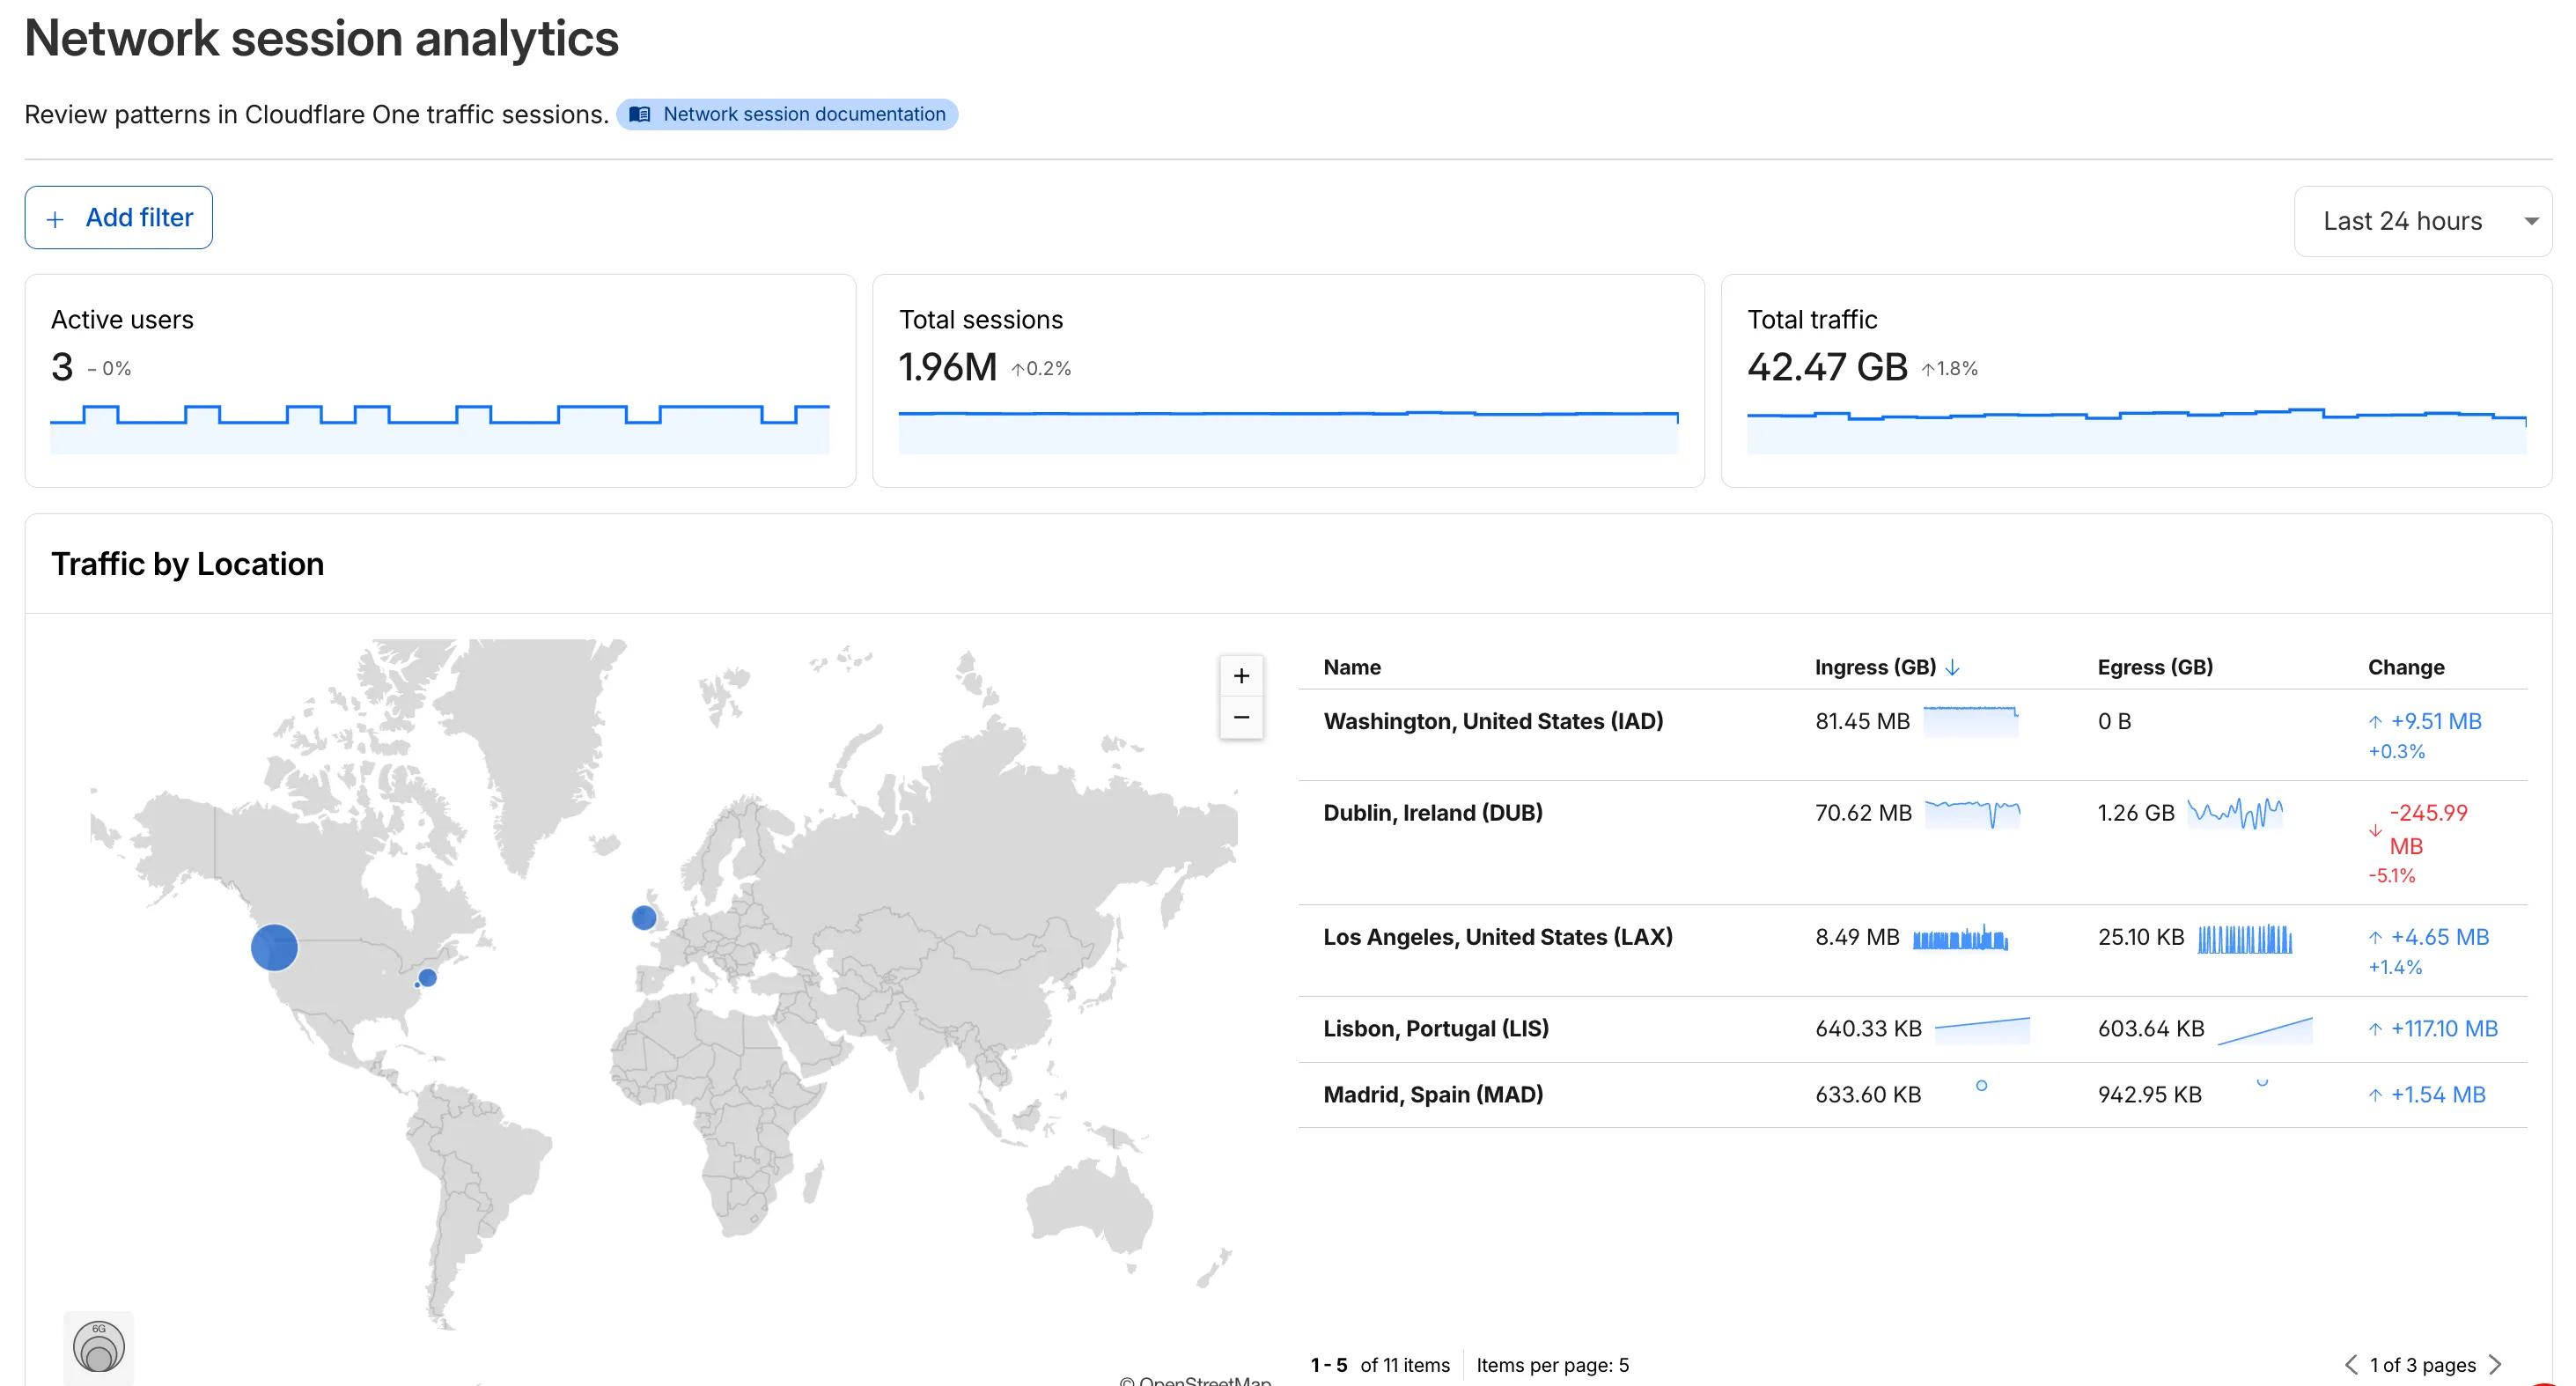
- Analyze geographic distribution: View a world map showing where your network traffic originates, with a list of top locations by session count.
- Monitor key metrics: Track session count, total bytes transferred, and unique users.
- Identify connection issues: Analyze connection close reasons to troubleshoot network problems.
- Review protocol usage: See which network protocols (TCP, UDP, ICMP) are most used.
- Summary metrics: Session count, bytes total, and unique users
- Traffic by location: World map visualization and location list with top traffic sources
- Top protocols: Breakdown of TCP, UDP, ICMP, and ICMPv6 traffic
- Connection close reasons: Insights into why sessions terminated (client closed, origin closed, timeouts, errors)
- Log in to Cloudflare One ↗.
- Go to Zero Trust > Insights > Dashboards.
- Select Network session analytics.
For more information, refer to the Network session analytics documentation.