
Visualize data, share links, and create exports with the new Workers Observability dashboard
The Workers Observability dashboard ↗ has some major updates to make it easier to debug your application's issues and share findings with your team.

You can now:
- Create visualizations — Build charts from your Worker data directly in a Worker's Observability tab
- Export data as JSON or CSV — Download logs and traces for offline analysis or to share with teammates
- Share events and traces — Generate direct URLs to specific events, invocations, and traces that open standalone pages with full context
- Customize table columns — Improved field picker to add, remove, and reorder columns in the events table
- Expandable event details — Expand events inline to view full details without leaving the table
- Keyboard shortcuts — Navigate the dashboard with hotkey support
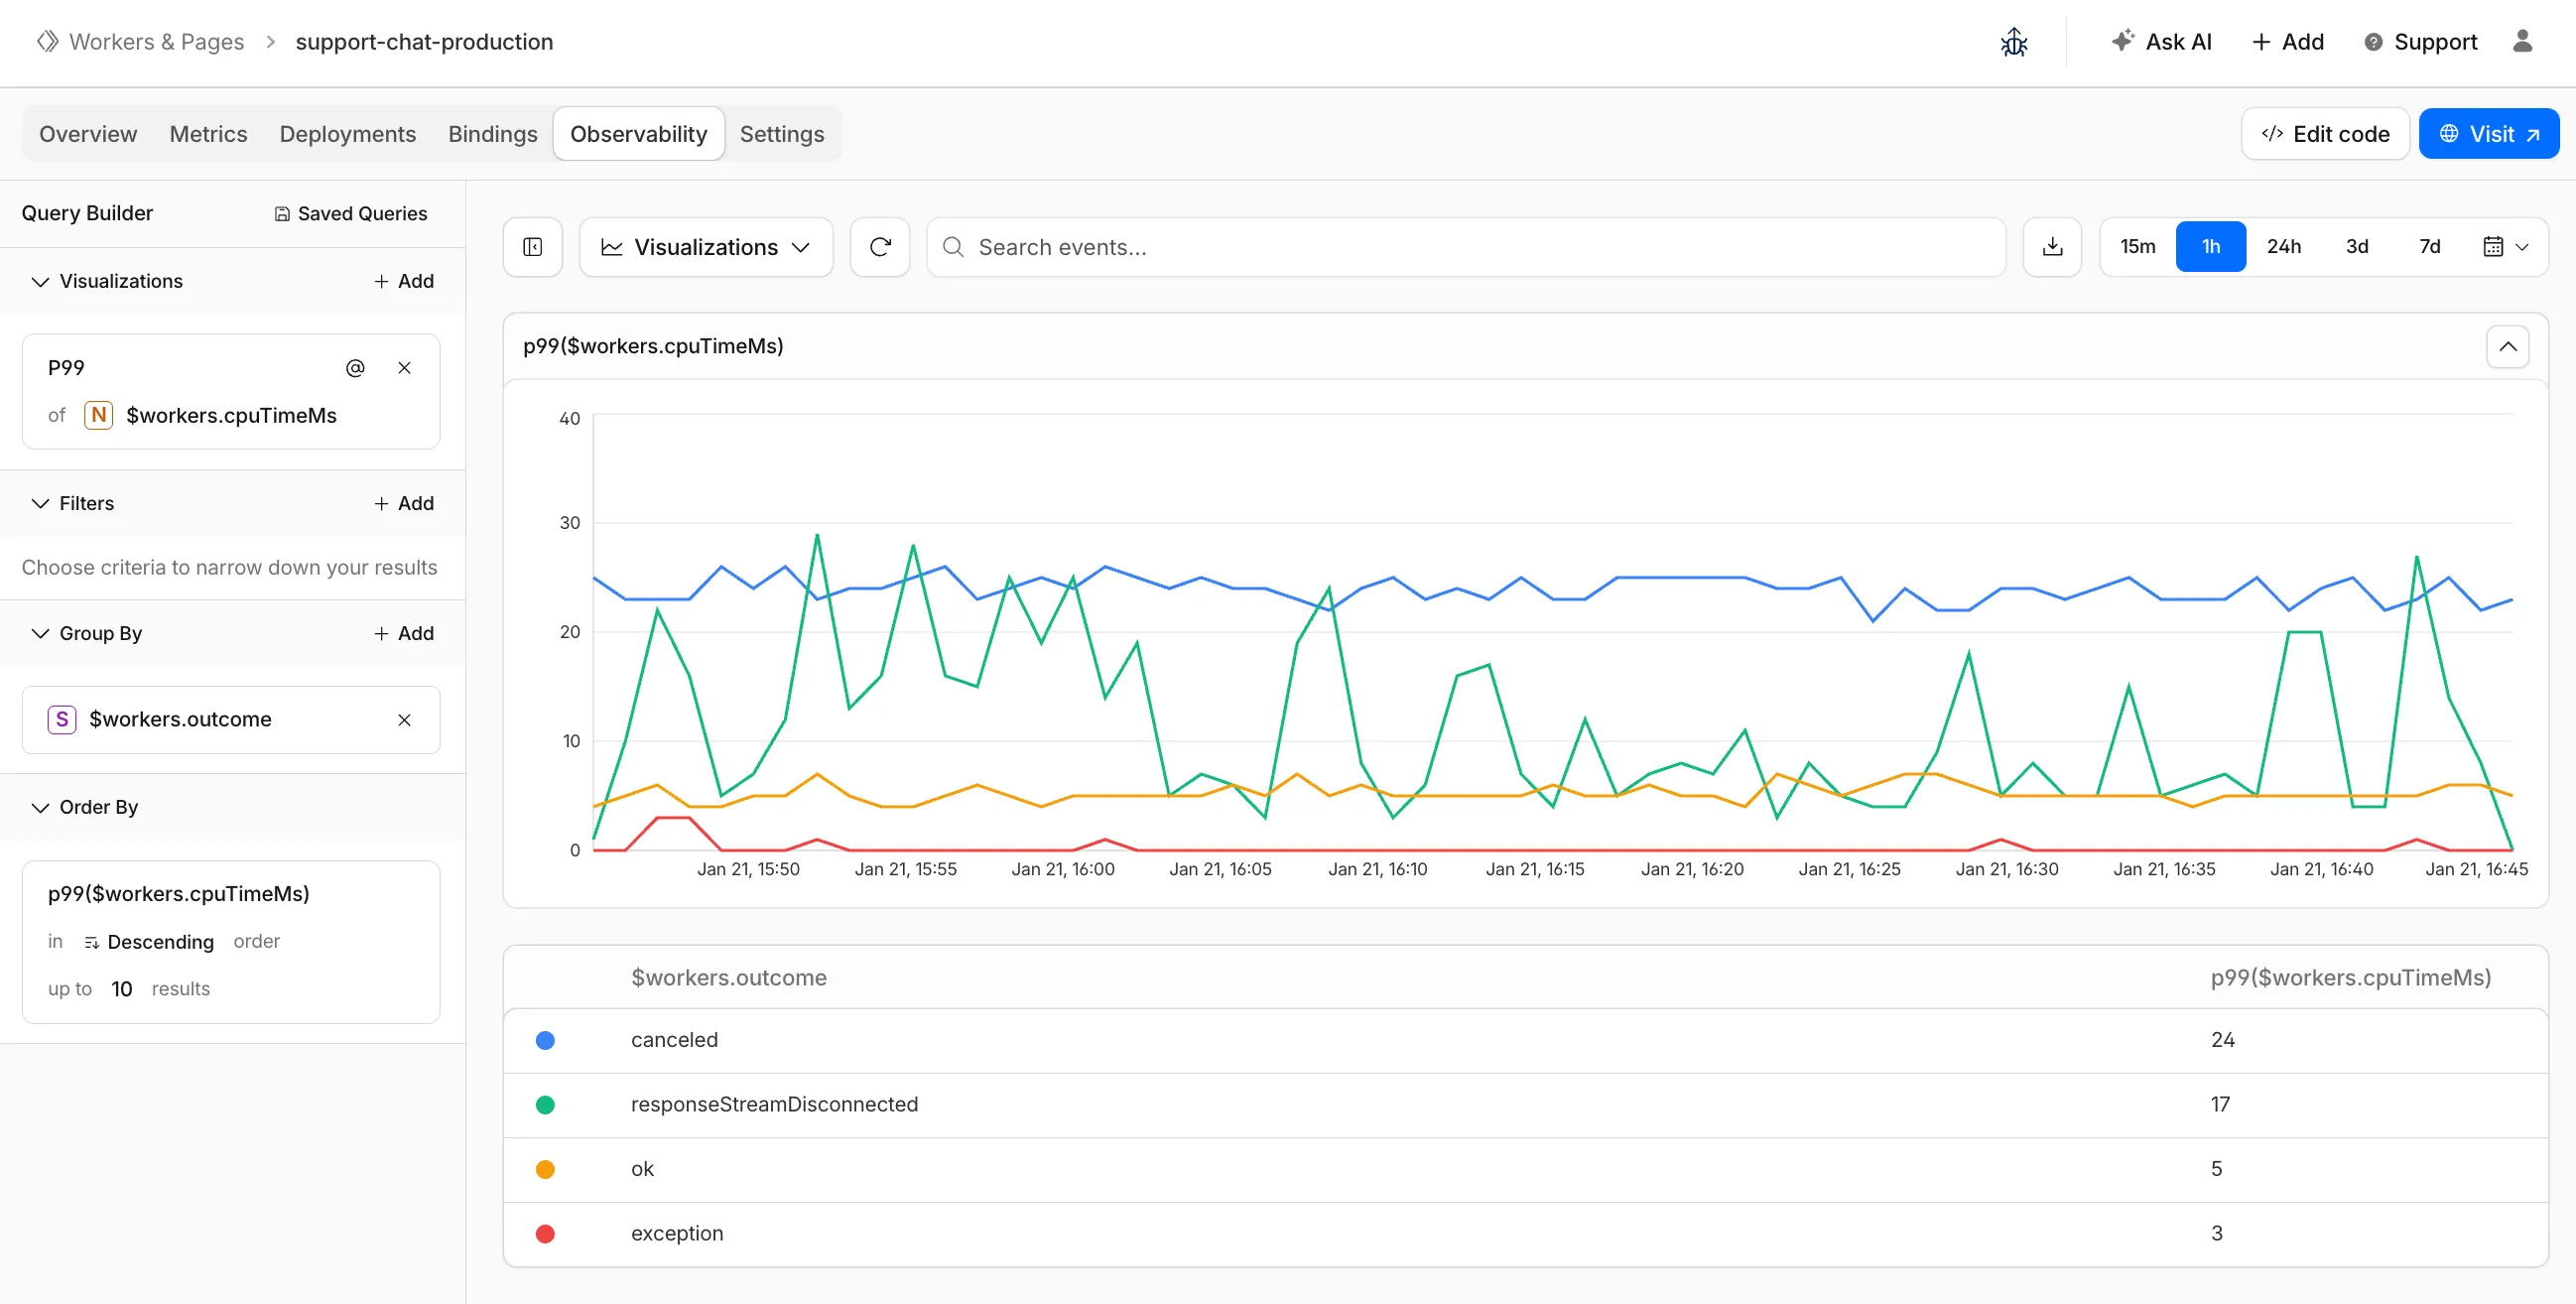
These updates are now live in the Cloudflare dashboard, both in a Worker's Observability tab and in the account-level Observability dashboard for a unified experience. To get started, go to Workers & Pages > select your Worker > Observability.