Turnstile Analytics
Turnstile Analytics provides you with a view of the top widget statistics across different metadata dimensions to understand where your traffic is coming from, which environments have the highest challenge activity, and whether certain sources are disproportionately failing or bypassing challenges, allowing you to fine-tune your security settings, apply more granular mitigations, and proactively respond to evolving threats.
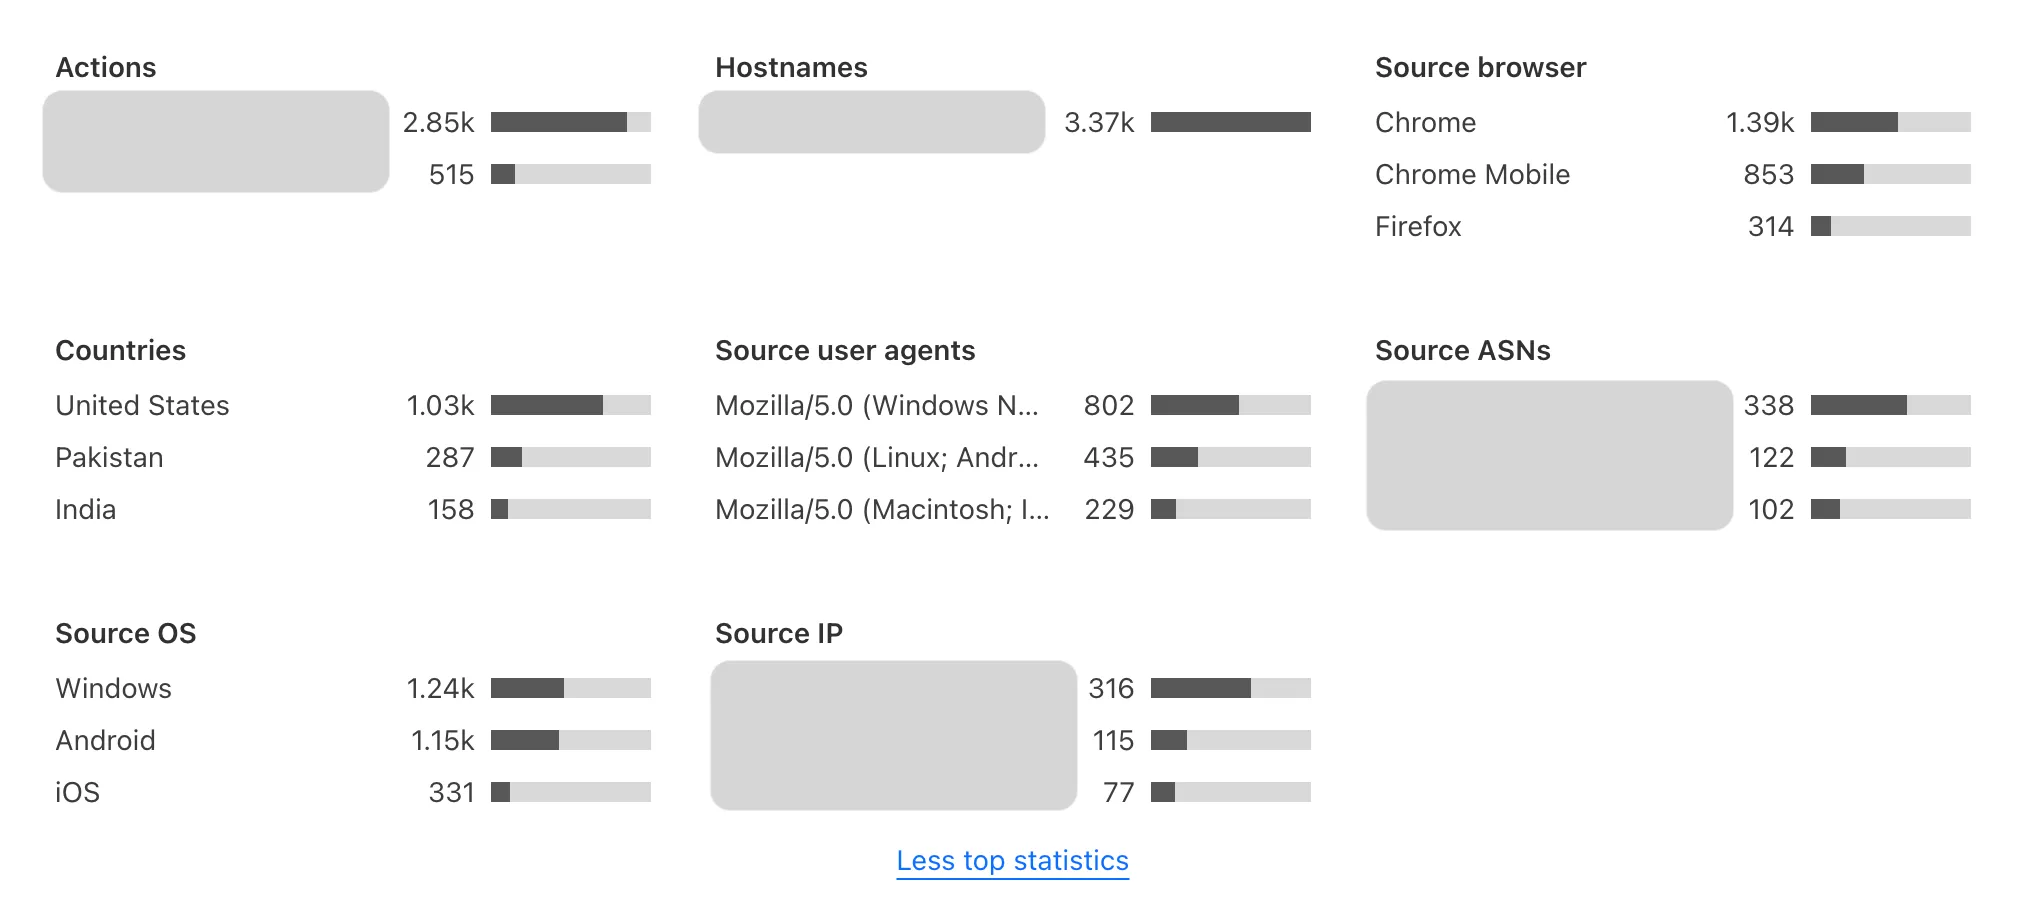
- Top Hostnames: If the Turnstile widget is placed across multiple hostnames, this will display the highest traffic hostnames where challenges are being issued.
- Top Browsers: A breakdown of browsers that are most commonly encountering Turnstile challenges, helping customers spot trends in visitor traffic.
- Top Countries: View the top originating countries for visitors completing challenges, which can help identify regional traffic anomalies.
- Top User Agents: Identify which user agents are generating the most Turnstile challenge requests.
- Top ASNs ↗: Displays the highest volume of challenges issued from specific Autonomous System Numbers (ASNs), helping customers detect potential bot activity.
- Top Operating Systems: Shows which operating systems are most common among visitors passing or failing challenges.
- Top Source IPs ↗: Identify the highest-volume IP addresses issuing Turnstile challenges, which can be useful in identifying attack sources or repeated challenge failures.
- Log in to the Cloudflare dashboard ↗ and select your account.
- Go to Turnstile and then navigate to your widget to see an overview of its analytics.
The metrics show changes in the solve rate, widget traffic, and top actions for your widget.
Refer to the pages below for more information about Turnstile Analytics:
Was this helpful?
- Resources
- API
- New to Cloudflare?
- Products
- Sponsorships
- Open Source
- Support
- Help Center
- System Status
- Compliance
- GDPR
- Company
- cloudflare.com
- Our team
- Careers
- 2025 Cloudflare, Inc.
- Privacy Policy
- Terms of Use
- Report Security Issues
- Trademark