Network Analytics v1
Access to Network Analytics requires the following:
- A Cloudflare Enterprise plan
- Cloudflare Magic Transit or Spectrum.
Cloudflare’s Network Analytics view provides near real-time visibility into network and transport-layer traffic patterns and DDoS attacks. Network Analytics visualizes packet and bit-level data, the same data available via the GraphQL Analytics API.
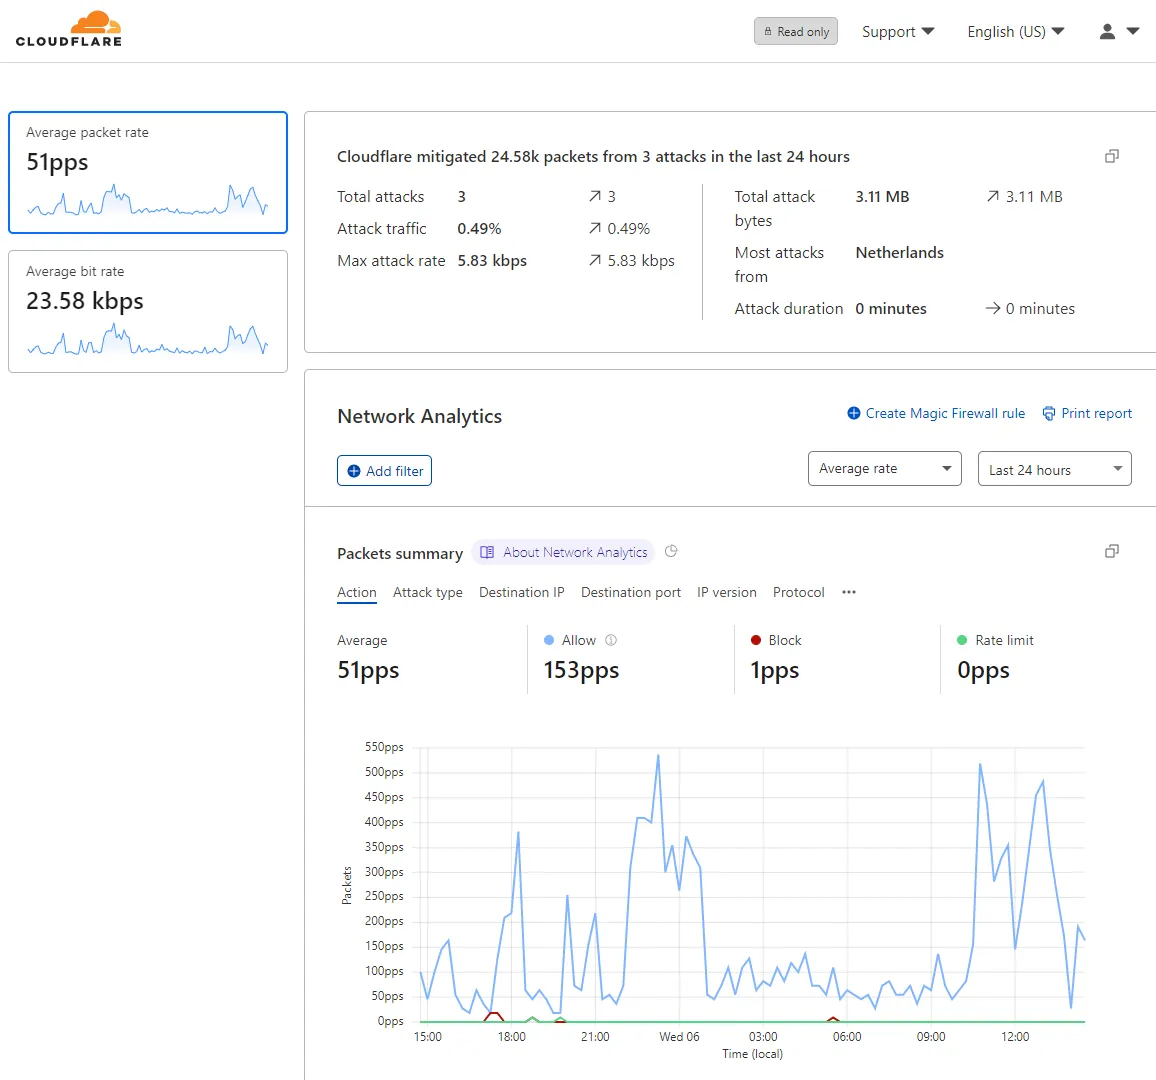
Network Analytics accelerates reporting and investigation of malicious traffic. You can filter data by these parameters:
- Mitigation action taken by Cloudflare
- Source IP, port, ASN
- Destination IP and port
- The Cloudflare data center city and country of where the traffic was observed
- Attack size, type, rate, and duration
- TCP flag
- IP version
- Protocol
Use Network Analytics to quickly identify key intelligence:
- Top attack vectors targeting the network
- Traffic mitigation over time, broken down by action
- Attack source, by country or data center
- Log in to the Cloudflare dashboard ↗ and select an account that has access to Magic Transit or Spectrum.
- Go to Account Home > Analytics & Logs > Network Analytics.
The headline and the side panels provide a summary of activity over the period selected in the timeframe drop-down list.
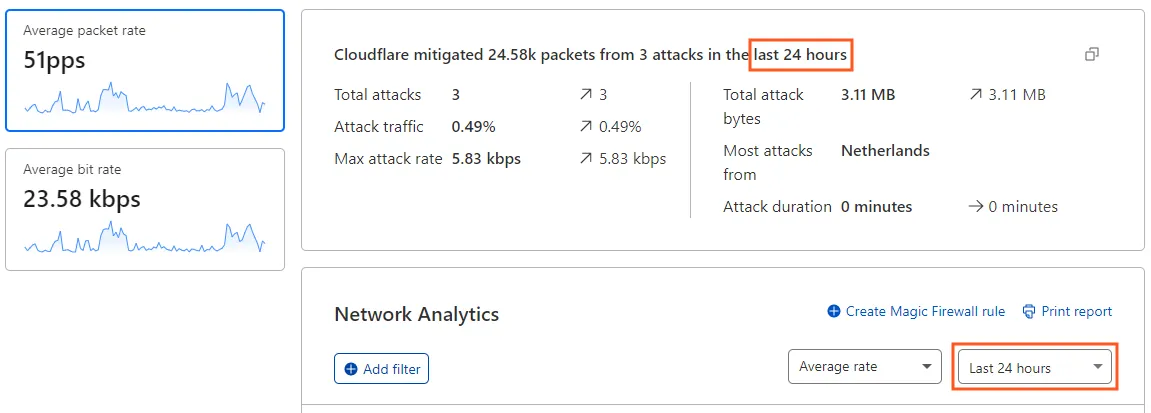
The headline provides the total packets or bits and the number of attacks detected and mitigated. When there is an attack in progress, the headline displays the maximum rate of packets (or bits) rather than the total count.
To toggle your view of the data, select the Packets or Bits side panels.
Use the timeframe drop-down list to change the time range over which Network Analytics displays data. When you select a timeframe, the entire view is updated to reflect your choice.
When you select Last 30 minutes, the Network Analytics view displays the data from the last 30 minutes, refreshing every 20 seconds. A Live notification appears next to the statistic drop-down list to let you know that the view keeps updating automatically:

When you select the Custom range option, you can specify a time range of up to 30 days throughout any period during the last 365 days.
Choose a statistic from the drop-down list to toggle between plotting Average rate and Total count.
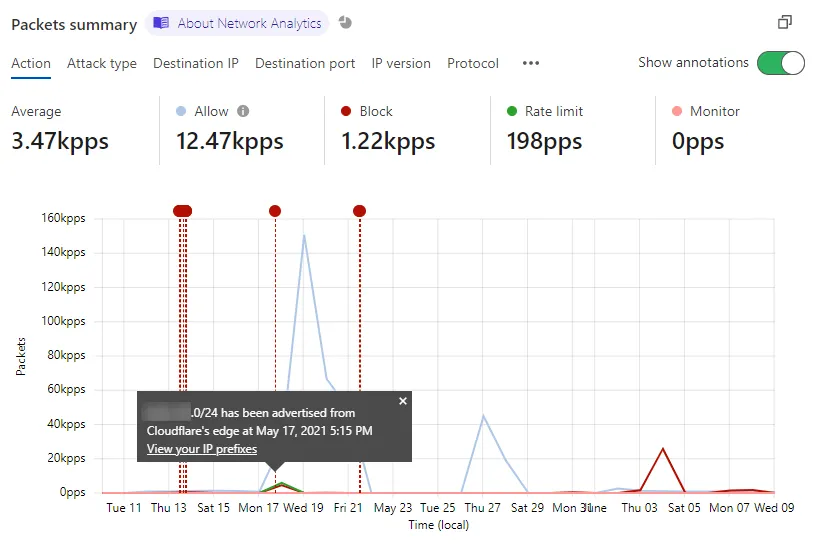
Enable the Show annotations toggle to show or hide annotations for advertised/withdrawn IP prefix events in the Network Analytics view. Select each annotation to get more details.
Select and drag to zoom in on a region of the chart. Using this technique you can zoom into a time range as short as three minutes.
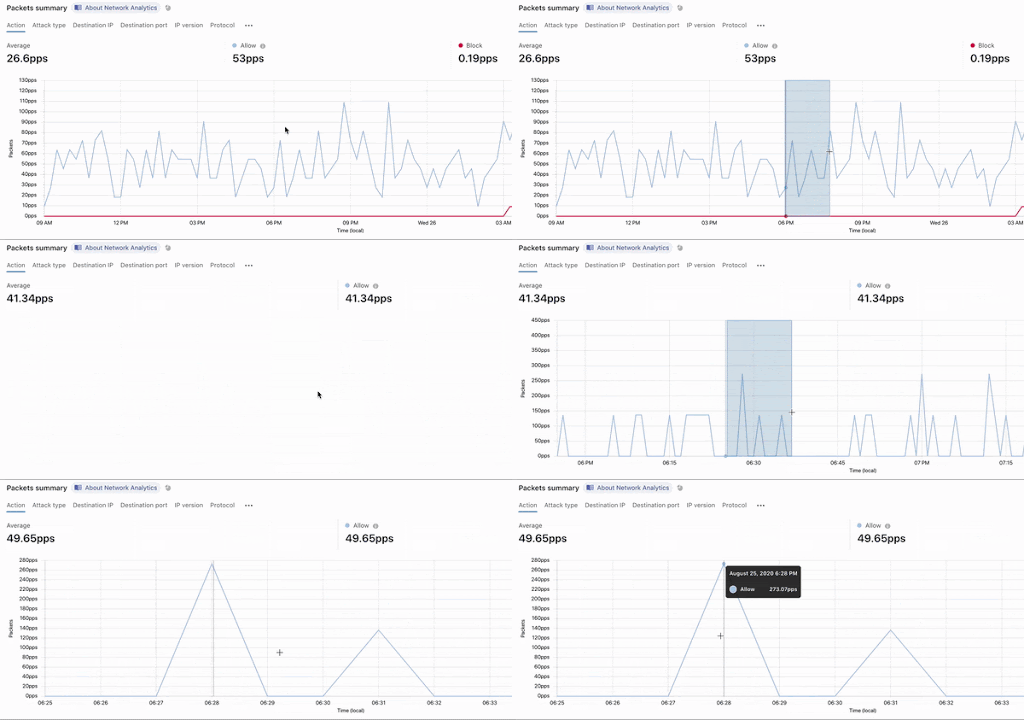
To zoom out, select X in the time range selector.
You can apply multiple filters and exclusions to adjust the scope of the data displayed in Network Analytics. Filters affect all the data displayed in the Network Analytics page.
There are two ways to filter Network Analytics data: use the Add filter button or select one of the stat filters.
Select Add filter to open the New filter popover. Specify a field, an operator, and a value to complete your filter expression. Select Apply to update the view.
When applying filters, observe these guidelines:
- Wildcards are not supported.
- You do not need to wrap values in quotes.
- When specifying an ASN number, leave out the AS prefix. For example, enter 1423 instead of AS1423.
To filter based on the type of data associated with one of the Network Analytics stats, use the Filter and Exclude buttons that display when you hover your pointer over the stat.
In this example, selecting Filter narrows the scope of the view to only traffic associated with the Allow action.
You can create a Magic Firewall rule that blocks all traffic matching the selected filters in Network Analytics. The currently supported filters are:
- Destination IP
- Protocol
- Source data center
- Source IP
- TCP flags
Other types of Network Analytics filters will not be added to the new rule definition. However, you can further configure the rule in Magic Firewall.
Do the following:
-
Apply one or more filters in Network Analytics.
-
Select Create Magic Firewall rule.

The Magic Firewall rule editor displays with the selected filters and values.
-
Review the rule definition in the Magic Firewall rule editor.
-
Select Add new.
The table below shows the range of fields, operators, and values you can use to filter Network Analytics.
| Field | Operators | Value |
|---|---|---|
| Action | Equals Does not equal | Allow: Traffic allowed through Cloudflare's automated DDoS protection systems. May also include traffic mitigated by Firewall Rules, flowtrackd and L7 rules. Block: Traffic blocked by Cloudflare's automated DDoS protection systems. Connection-tracking: Applies only exclusively to L7, as Magic Transit is excluded from scope and no conntrack ever runs for Magic Transit prefixes. Rate-limit: Can be applied per source IP, subnet or any connection. The decision is made programmatically based on heuristics. Monitor: Attacks which were identified but have chosen to simply observe and not mitigate with any rule. |
| Attack ID | Equals Does not equal | Attack number |
| Attack Type | Equals Does not equal | UDP Flood SYN Flood ACK Flood RST Flood LDAP Flood Christmas Flood FIN Flood GRE Flood ICMP Flood |
| Destination IP | Equals Does not equal | IP address |
| Destination Port | Equals Does not equal Greater than Greater than or equals Less than Less than or equals | Port number Port range |
| Destination IP range | Equals Does not equal | IP range & mask |
| IP Version | Equals Does not equal | 4 or 6 |
| Protocol | Equals Does not equal | TCP UDP ICMP GRE |
| Source ASN | Equals Does not equal | AS Number |
| Source Country | Equals Does not equal | Country name |
| Source data center | Equals Does not equal | Data center location |
| Source IP | Equals Does not equal | IP address |
| Source port | Equals Does not equal Greater than Greater than or equals Less than Less than or equals | Port number Port range |
| TCP Flag | Equals Does not equal Contains | SYN, SYN-ACK, FIN, ACK, RST |
You can plot Network Analytics data along a variety of dimensions. By default, Network Analytics displays data broken down by Action.
Select one of the Summary tabs to view the data along a different dimension.
You can choose from these options:
- Action
- Attack type
- Destination IP
- Destination port
- IP version
- Protocol
- Source ASN
- Source country
- Source data center
- Source IP
- Source port
- TCP flag
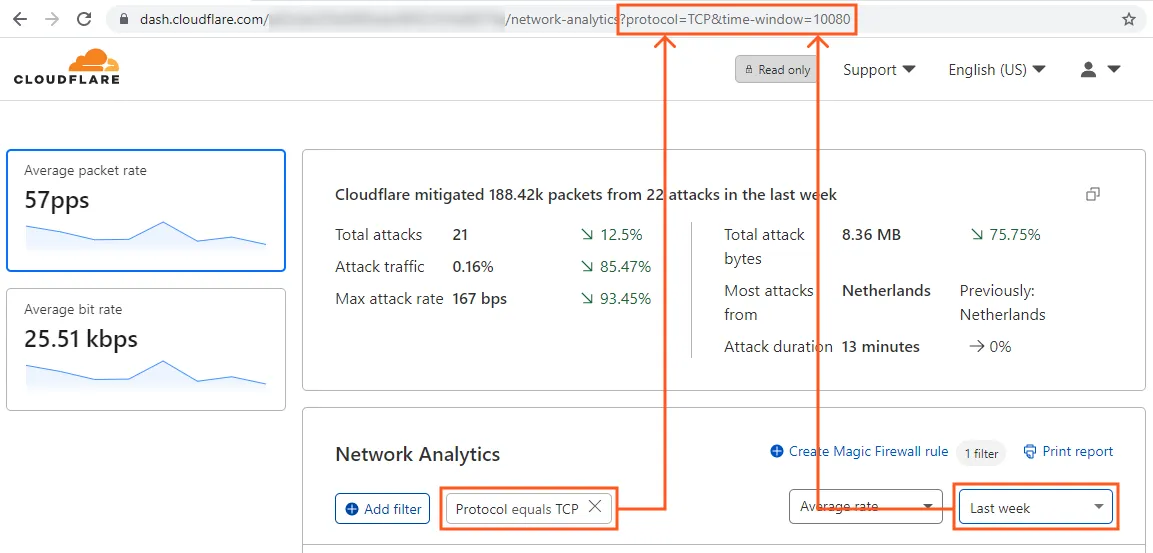
When you add filters and specify a time range in the Network Analytics page, the URL changes to reflect those parameters.
To share your view of the data, copy the URL and send it to other users so that they can work with the same view.
The Network Analytics Activity log shows up to 500 log events in the currently selected time range, paginated with 10 results per page per time range view. (The GraphQL Analytics API does not have this limitation.)
To display event details, select the expansion widget associated with the events.
To configure which columns display in the Activity log, select Edit columns.
This is particularly useful when you would like to identify a DDoS attack, during which you can specify the desired attributes such as IP addresses, max bit rate, and attack ID among others.
The Source Country, Source, and Destination panels display the top items in each view.
To select the number of items to display, use the drop-down list associated with the view.
To review the top data centers, select Data center from the drop-down list in the Source country view. The Source data center view replaces the Source country view.
You can export up to 500 raw events from the Activity log at a time. This option is useful when you need to combine and analyze Cloudflare data with data stored in a separate system or database, such as a SIEM system.
To export log data, select Export.
Choose either CSV or JSON format for rendering exported data. The downloaded file name will reflect the selected time range, using this pattern:
network-analytics-attacks-[start_time]-[end_time].jsonTo print or download a snapshot report from Network Analytics, select Print report. Your web browser's print interface displays options for printing or saving as a PDF.
Network Analytics currently has these limitations:
-
Network Analytics v1 provides insights on denial of service daemon (dosd) ↗ attacks. Although it provides a timely view of the data, it does not have a complete view of all events.
-
The following data sources are not available in Network Analytics v1:
- Firewall Rules (available in Network Analytics v2)
- Application layer rules
- Gatekeeper and manually applied rules
- flowtrackd ↗ (Advanced TCP protection) (available in Network Analytics v2)
- WARP traffic and Orange-clouded traffic
-
Data from Cloudflare services that proxy traffic, such as CDN, is not available in Network Analytics.
If you are using Network Analytics v2 (NAv2), the range of historical data you can query is 90 days.
Network Analytics v1 (NAv1) uses GraphQL nodes to roll up data into 1 minute, 1 hour, and 1 day IP flows. For example, the ipFlows1mGroups node stores data in minute-wise aggregations.
To identify the range of historical data you can query in NAv1, refer to this table. Use the notOlderThan column as an indicator of retention time.
GraphQL data nodes:
ipFlows1mGroupsipFlows1dGroups
When working with attack logs in the dashboard, keep the following in mind:
- Attack logs are stored with start and end timestamps, packet and bit statistics for minimum, maximum, and average data rate, as well as totals, attack type, and action taken.
- Source IP addresses are considered personally identifiable information. Therefore, Cloudflare only stores them for 30 days. After 30 days, source IP addresses are discarded, and the logs are rolled up first into 1-hour groups, then 1-day groups. The 1-hour rollups are stored for 6 month. The one day rollups are stored for 1 year.
For more information on querying and accessing log data, refer to the GraphQL Analytics API.
The destination IP is indicated as Unavailable, when the destination IP was not included in the real-time signature generated by our DDoS protection systems.
To view the destination IP, filter by Attack ID and scroll to the Destination section in the top items lists. When you filter on a specific Attack ID, the entire Network Analytics dashboard becomes an attack report.