
Investigate your Workers with the Query Builder in the new Observability dashboard
The Workers Observability dashboard ↗ offers a single place to investigate and explore your Workers Logs.
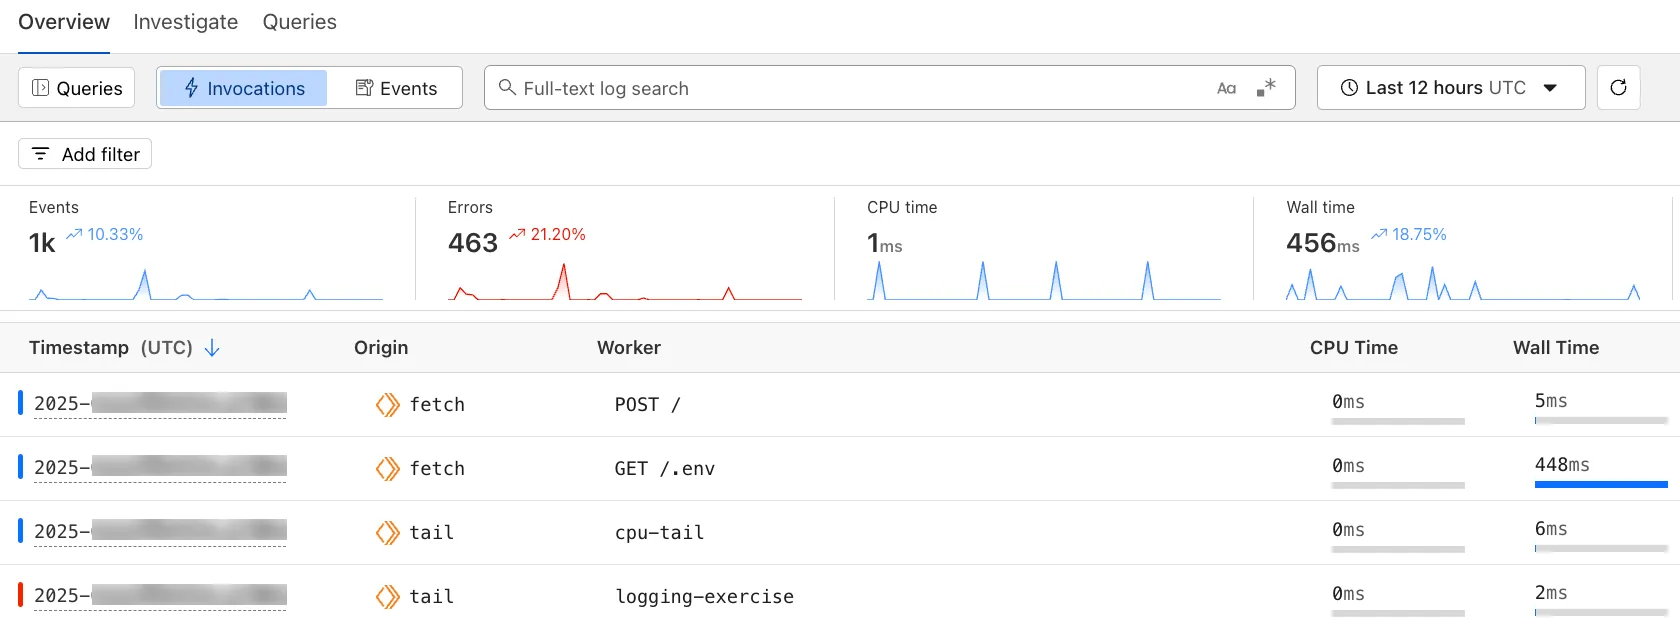
The Overview tab shows logs from all your Workers in one place. The Invocations view groups logs together by invocation, which refers to the specific trigger that started the execution of the Worker (i.e. fetch). The Events view shows logs in the order they were produced, based on timestamp. Previously, you could only view logs for a single Worker.
The Investigate tab presents a Query Builder, which helps you write structured queries to investigate and visualize your logs. The Query Builder can help answer questions such as:
- Which paths are experiencing the most 5XX errors?
- What is the wall time distribution by status code for my Worker?
- What are the slowest requests, and where are they coming from?
- Who are my top N users?
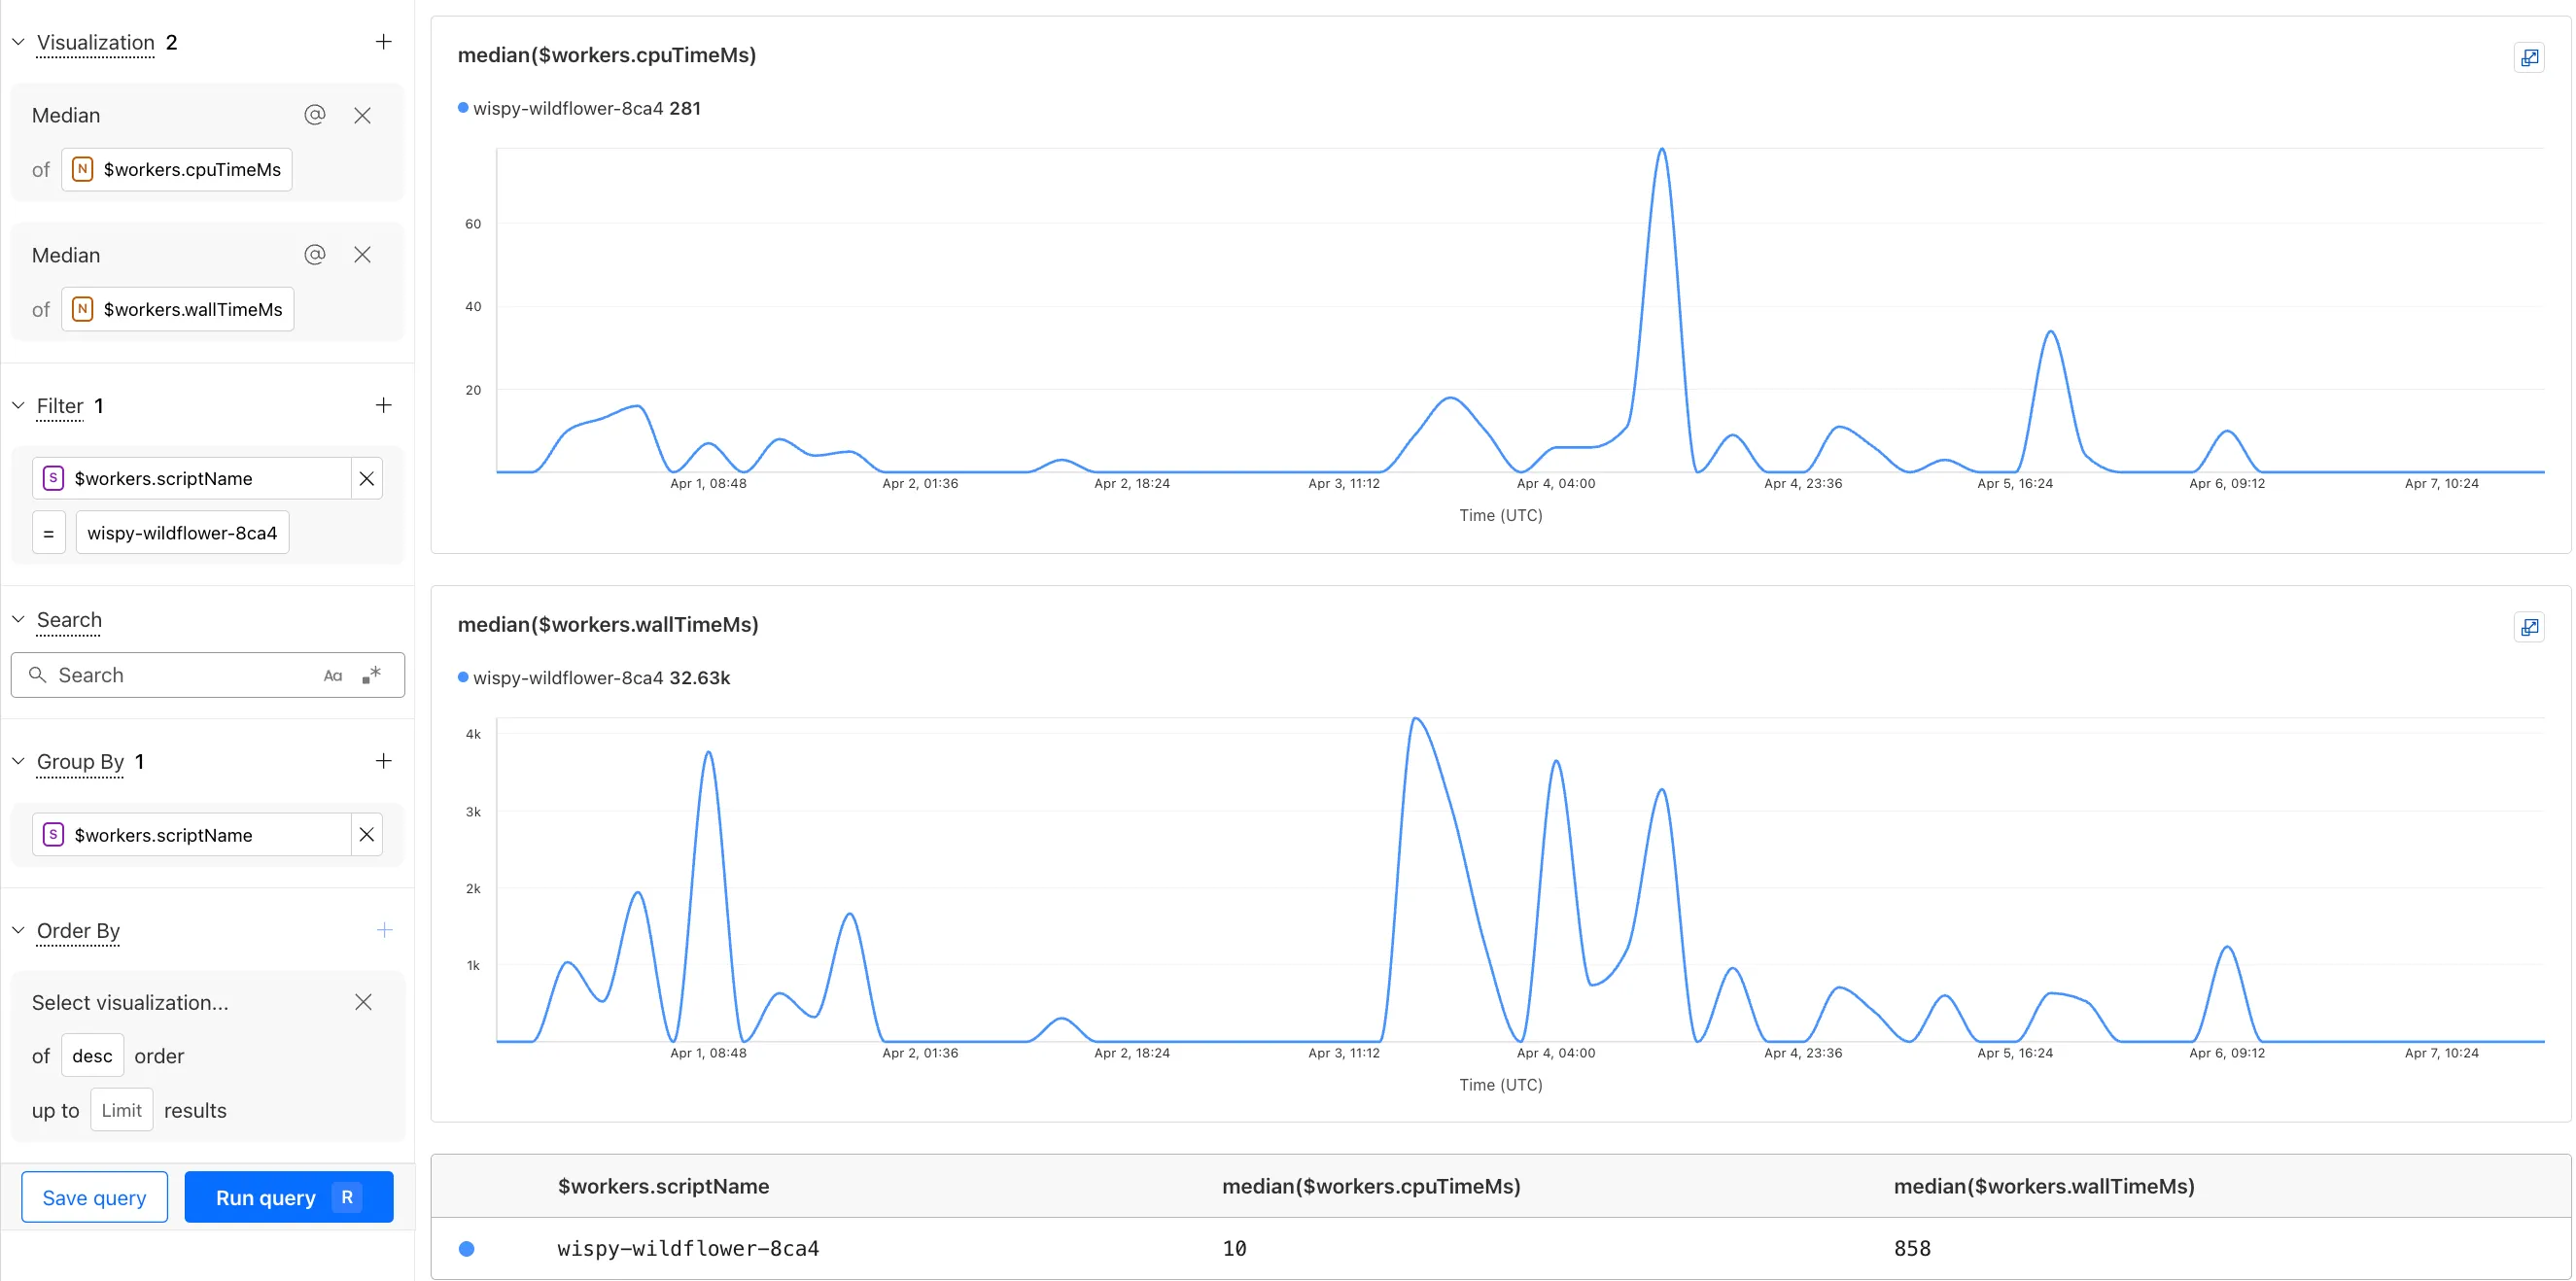
The Query Builder can use any field that you store in your logs as a key to visualize, filter, and group by. Use the Query Builder to quickly access your data, build visualizations, save queries, and share them with your team.
Workers Logs is now Generally Available. With a small change to your Wrangler configuration, Workers Logs ingests, indexes, and stores all logs emitted from your Workers for up to 7 days.
We've introduced a number of changes during our beta period, including:
- Dashboard enhancements with customizable fields as columns in the Logs view and support for invocation-based grouping
- Performance improvements to ensure no adverse impact
- Public API endpoints ↗ for broader consumption
The API documents three endpoints: list the keys in the telemetry dataset, run a query, and list the unique values for a key. For more, visit our REST API documentation ↗.
Visit the docs to learn more about the capabilities and methods exposed by the Query Builder. Start using Workers Logs and the Query Builder today by enabling observability for your Workers:
{ "observability": { "enabled": true, "logs": { "invocation_logs": true, "head_sampling_rate": 1 } }}[observability]enabled = true
[observability.logs]invocation_logs = truehead_sampling_rate = 1 # optional. default = 1.Was this helpful?
- Resources
- API
- New to Cloudflare?
- Products
- Sponsorships
- Open Source
- Support
- Help Center
- System Status
- Compliance
- GDPR
- Company
- cloudflare.com
- Our team
- Careers
- 2025 Cloudflare, Inc.
- Privacy Policy
- Terms of Use
- Report Security Issues
- Trademark